If there’s one thing you can count on in Britain it’s that at any given time someone, somewhere, is talking about rain. Either it’s raining, or we want it to rain, or it absolutely mustn’t be raining today. It’s just one of those things we love to complain about – and we do!
My work isn’t in forecasting rain, but observing it. It’s a little known fact that the rainfall map you see on the front page of the Met Office website doesn’t just come straight out of one giant weather radar, neatly packaged. There’s a lot of work that has to happen before we can turn the “reflectivities” from many different radar echoes into a sensible estimate of how heavily it’s raining on your street.
The Met Office owns and manages a network of 15 weather radars across the UK, and receives data from three more, in Ireland and the Channel Islands. We’ve now almost completed a major upgrade of the network, replacing key components of the old radars – some of which had been running operationally for over 30 years! – with new technology. The dual polarisation and Doppler information we obtain from the upgraded radars improves our ability to distinguish between “rain” and “non-rain” echoes, and to measure how fast the rain is moving, feeding improvements in short range “nowcasts” and flood forecasting models. It can also help us estimate the quantity of rainfall and other types of precipitation in real time.
For my PhD, I’m looking at how to improve Met Office estimates of surface rain rates from radar measurements at long range. When a radar measures weather, it does so with a beam of energy that spreads out with distance. 20 km from the radar, the echo received represents a volume of space around 600 m by 400 m by 400 m. At 50 km, the volume is 600 m by 1 km squared. By 100 km, the beam has spread out to be 2 km wide. This effect is called “beam broadening”, and limits the spatial detail with which we can measure rainfall.
The other effect of range is the increasing height of the radar beam above the ground. This means the radar isn’t always measuring liquid rain drops, but may be measuring frozen ice crystals or snow, high up in colder parts of the atmosphere, which will melt before they reach the surface. Snow, melting snow and rain all have different reflectivities, so we have to correct for this “vertical profile” to calculate how much rain is falling at ground level.
The Met Office corrects for the vertical reflectivity profile (VPR) using an iterative scheme (Kitchen et al. 1994, Kitchen 1997). We know roughly the VPR shape, and the amount of beam broadening at a given range, so we can scale this shape to the actual radar reflectivity measurement. This allows us to correct for the impacts of melting snow, which causes a huge enhancement of the radar measurement and would – if uncorrected – lead to extreme overestimates of rainfall. In the early days of weather radar, this caused rings of very high rain rates to appear in the image: an effect called “bright banding”. VPR correction also compensates for the underestimation of rain rates at very long distances from the radar.
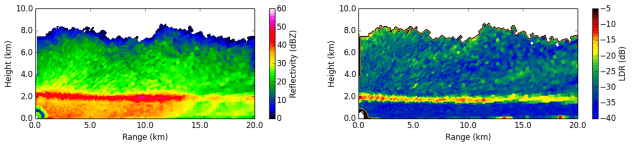
In my work, I’m using measurements from the upgraded dual polarisation radar network to choose between different VPR shapes in making this correction. Specifically, I’m investigating the depolarising properties of different melting drops, to identify the rare situations where we don’t need to correct for “bright banding”. The linear depolarisation ratio (LDR), which I’m using to identify the large melting snowflakes that cause radar bright bands, has to be measured using different scans from the ones used to collect reflectivities for rainfall rates, and the Met Office is one of very few meteorological services capable of measuring LDR operationally. Using LDR in this way can improve rainfall estimates significantly in cases where there is no bright band (Smyth and Illingworth, 1998; Sandford et al., in press).

As a logical extension to this work, I’m also looking into new VPR shapes for “non-bright band” rain, using vertical slice “range height indicator” scans from our research radar at Wardon Hill. Correction for bright band is well established in the radar literature, as this is the most common type of rain at high latitudes (where the freezing level is low enough to affect radar measurements), but other types of VPR (e.g. Fabry and Zawadzki, 1995) are rarely discussed. With the improvements in classification achieved by the new LDR algorithm, a suitable VPR shape is needed to correct for underestimation far from the radar in cases without bright band. I’ve recently developed a test profile shape for non-bright band VPRs, and demonstrated improvements to rain rates in localised convective case studies. The method is currently being trialled for use in the Met Office’s operational radar processing software.
In the future it’s hoped that the work I’m doing will further improve the accuracy of Met Office rainfall estimates, particularly in thunderstorms and convective showers. And when the weather is doing things like this, that’s good to know!
References
Fabry, F. and I. Zawadzki, 1995: Long-term radar observations of the melting layer of precipitation and their interpretation. Journal of the Atmospheric Sciences, 52, 838-851.
Kitchen, M., 1997: Towards improved radar estimates of surface precipitation rate at long range. Quarterly Journal of the Royal Meteorological Society, 123, 145-163.
Kitchen, M., R. Brown. and A. Davies, 1994: Real-time correction of weather radar data for the effects of bright band, range and orographic growth in widespread precipitation. Quarterly Journal of the Royal Meteorological Society, 120, 1231-1254.
Sandford, C., A. Illingworth, and R. Thompson, in press: The potential use of the linear depolarisation ratio to distinguish between convective and stratiform rainfall to improve radar rain rate estimates. Journal of Applied Meteorology and Climatology.
Smyth, T. and A. Illingworth, 1998: Radar estimates of rainfall rates at the ground in bright band and non-bright band events. Quarterly Journal of the Royal Meteorological Society, 124, 2417-2434.
