AGU in Sunny San Francisco

Flynn Ames - f.ames@pgr.reading.ac.uk

For my first (and given carbon budgets, possibly the last) in-person conference of my PhD, I was lucky enough to go to AGU (American Geophysical Union Conference) in December 2023, taking place in San Francisco, California. As my first time in America, there was a lot to be excited about. As my first time presenting at a conference, there was a lot to be nervous about. So what did I discover?

To echo the previous year’s post: AGU is big. I mean really big. I mean seriously (please take me seriously) its huge. The poster hall was the size of an aircraft hangar – poster slots were numbered from 1 to over 3000, with each slot used by a different person for each day. Dozens of talk sessions were held at any time simultaneously across the three separate buildings (that thankfully were very close to each other), commencing anytime from 8am to 6pm, Monday to Friday. I was recommended the AGU app and would (uncharacteristically) do the same as it was very helpful in navigating the sessions. I’d also recommend properly planning what you want to attend in advance of the conference – it is very easy to miss potentially relevant sessions otherwise.

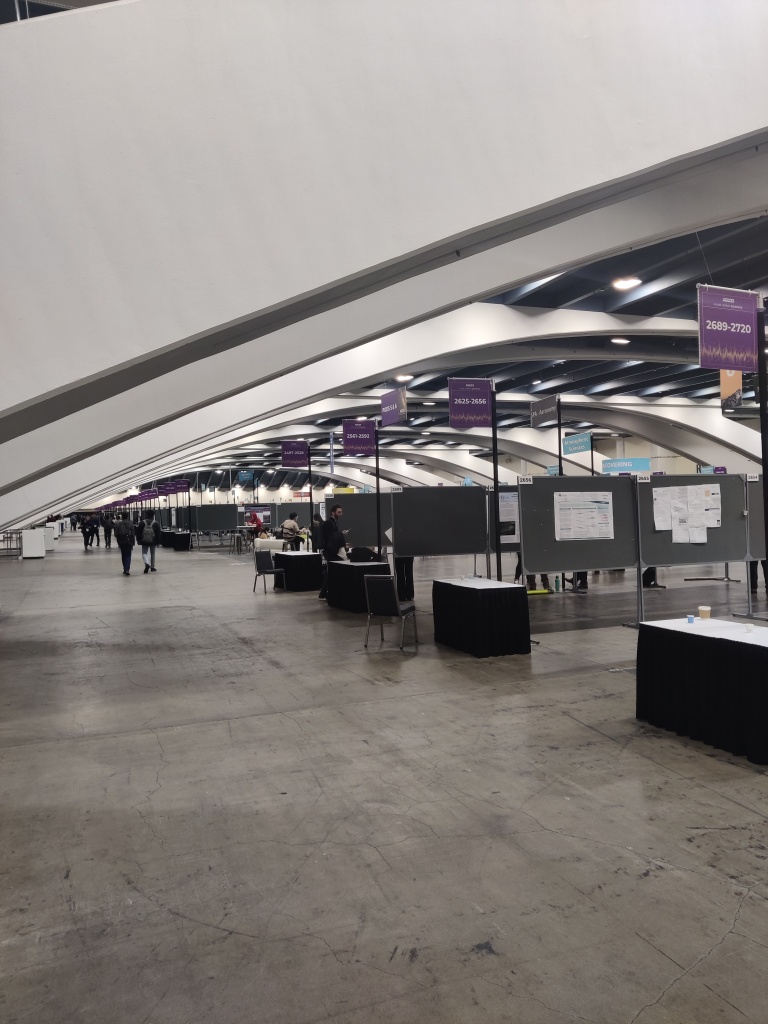
The poster hall from two different angles on Monday Morning (left) and Friday evening (right).

The keynote lectures (one per day) were like something out of Gamescom or E3. They always started with flashy, cinematic vignettes. Hosts and speakers had their own entrance theme song to walk out on stage to, whether that be Katy Perry ‘Fireworks’ or Johnny Cash ‘Ring of Fire’ (and of course, they had the cliche teleprompter from which to read). Some Keynote talks were OK in terms of content, but others were definitely a miss, seemingly prioritising style over substance or referring to subject matter in too abstract a way, so that it was difficult to gauge what the take home message was meant to be. I’d say attend at least one for the experience but skip the rest if they don’t appeal to you.

There were also miscellaneous activities to partake in. Exhibition Hall F was where you could find stalls of many research organisations, along with any American or Chinese university you can name (NASA had a cool one with some great graphics). In that same place you could also get a free massage (in plain sight of everyone else) or a professional headshot (which I tried – they brushed something on my face, I don’t know what it was) or even hang out with the puppies (a stall frequented by a certain Met PhD student). You could say there was something for everyone.

I wasn’t the only one needing rest after a long day of conferencing.

I found poster sessions to be far more useful than talks. Most talks were eight minutes long, with a red light switching on after seven. With these time constraints, presenters are often forced to assume knowledge and cram in content and slides. The presentations can be hard to follow at the best of times, but especially when you yourself are presenting later in the week and all you can do is watch and wait for that red light, knowing that it will be deciding your fate in days to come. In contrast, posters can be taken at one’s own pace – you can ask the presenter to tailor their “spiel” to you, whether that’s giving a higher-level overview (as I asked for 100% of the time) or skipping straight to the details. You get a proper chance to interact and have conversations with those doing work you’re interested in, in contrast to talks where your only hope is to hunt down and corner the presenter in the few microseconds after a session ends.

With that said, there were many great talks. Some of the coolest talks I attended were on existing and future mission concepts to Europa (moon of Jupiter) and Enceladus (moon of Saturn) respectively, which has tangential relevance to my own project (icy moon oceanography – probably best left for a future post). In these talks, they discussed the science of the upcoming Europa Clipper mission, along with a robotic EEL concept (like a robot snake) for traversing within and around the icy crevasses on Enceladus’s surface. It was really cool (and very lucky) getting to interact with people working on Europa Clipper and the current Juno mission orbiting Jupiter. Given the time taken between a mission’s proposal, getting (and sometimes losing) funding, planning, construction, and eventual launch and arrival, many of these scientists had been working on these missions for decades! 

My own talk was scheduled for the final conference day (given the luck with everything else, I won’t complain) at 8:40 am. While seemingly early, I struggled to sleep beyond 3:30am most days anyway owing to jet lag so by 8:40am, stress ensured I was wide awake, alert, and focused. 

The talk was over in a flash – I blinked and it was done (more or less).

The most academically helpful part of the conference was the conversations I had with people about my work after the talk. This was my main take away from AGU – that getting to know people in your field and having in-depth conversations really can’t have been achieved by reading someone’s paper, or even sending an email. Meeting in-person really helps. A poster session can thankfully make this feel very natural (as opposed to just randomly walking up to strangers – not for me…) and is therefore something I recommend taking advantage of. Besides, if they’re presenting a poster, they’re less able to run away, even if they want to.

A quick bullet point list of other things I learned (and didn’t) while at AGU:

Things I learned:

  • Apparently, PhD students having business cards is normal in America? – I got handed one during a dinner and the whole table didn’t understand why I was confused
  • NO BISCUITS DURING COFFEE BREAKS in America – probably because you can’t get biscuits easily in America. Regardless, my stomach deemed this a poor excuse.
  • Food portions are, in general, much bigger – surely to make up for the lack of biscuits during coffee breaks.

Things I didn’t learn:

  • How the automatic flush mechanism worked in the conference venue toilets (I really tried)
  • Given there were dozens of sessions happening simultaneously at the conference, probably many other things.

After AGU finished, I was lucky enough to spend extra time in San Francisco. The city really has a piece of everything: fantastic walks near the Golden Gate and coastal area, the characteristic steep streets and cable cars, lots of great places to eat out (great for vegans/vegetarians too! :)), and they had unexpectedly good street musicians. The weather was very nice for December – around 18 degrees. I even got sunburned on one of the days. Public transport is great in San Francisco and getting around the city was no issue.

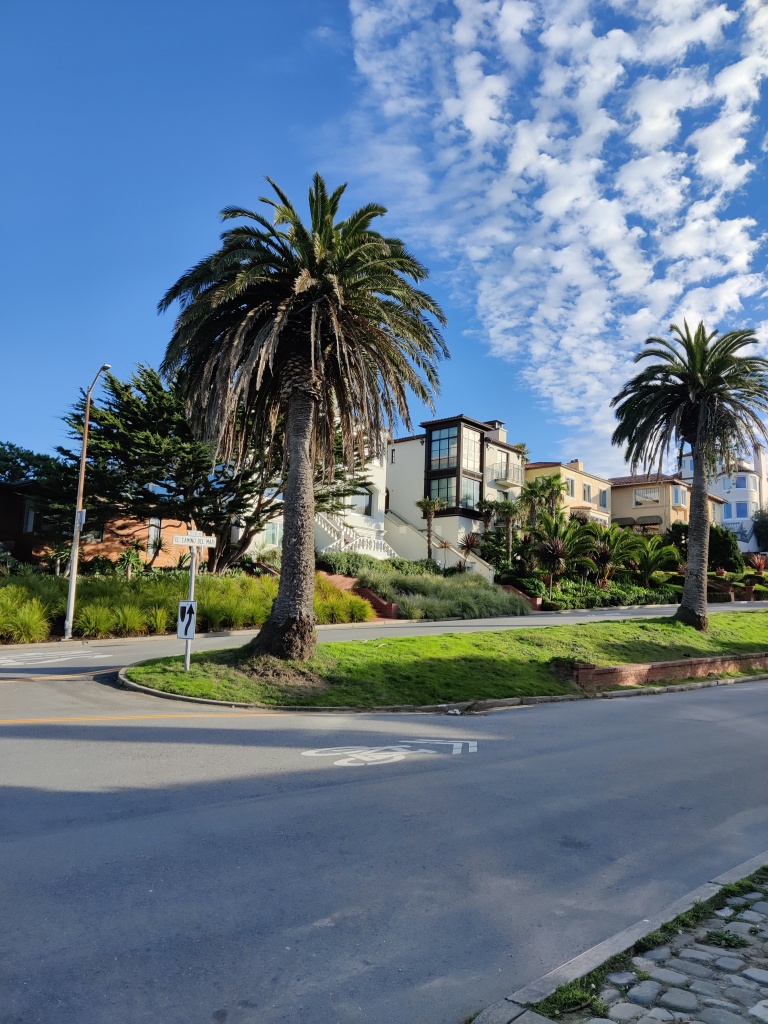
Some of the various sights (and only pictures I took) in San Francisco.

But San Francisco also appears to be a city of extremes. There are mansions near the beach in an area that looks like a screenshot from Grand Theft Auto Five. Meanwhile in the city itself, the scale of homelessness is far beyond anything I’ve observed here in the UK. I’d very frequently walk past people with large trolleys containing what appeared to be all their belongings. Nearby the Tenderloin district, pitched tents on the pathways next to roads were common, with people cooking on gas stoves. The line to what appeared to be one soup kitchen stretched outside and round the corner. Drug use was also very noticeable. I frequently spotted people slumped over in wheelchairs, others passed out in a subway station or outside a shop. People pass by as if no-ones there. It’s one thing hearing about these issues, but it is eye-opening to see it.

Overall, attending AGU in San Francisco was an experience I will not forget and certainly a highlight of my PhD so far – I’m very grateful I was able to go! Next year’s AGU will take place in Washington DC from 9th-13th December. Will you be there? Will you be the one to write next years AGU post?  Stay tuned to the Social Metwork (and for the latter, your email inbox) to find out.
Scientists Acquitted: Examining the Role of Consent in Climate Activism 

James Fallon – j.fallon@pgr.reading.ac.uk 

Ecosystem collapse and climate change threaten all of our futures. What power do scientists have to avoid this looming catastrophe? 

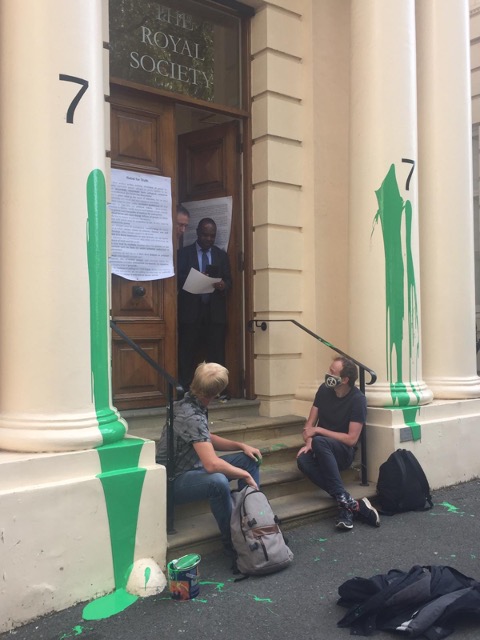
Last week, a jury at Southwark Crown Court heard statements from two scientists facing charges of criminal damage. They had taken action by calling on members of the Royal Society and the wider scientific community to engage in civil disobedience and non-violent direct action: to act as if the science is real, demonstrating a response commensurate with the catastrophic effects being predicted. 

Figure 1: In September 2020, Scientist Rebellion co-founders Mike and Tim took non-violent direct action at the UK’s most prominent scientific body, The Royal Society – source scientistrebellion.com

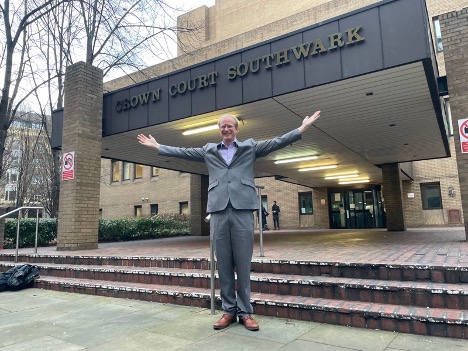
The defence rested on legal “consent”: that those working at the institute would, when confronted with the facts, consent to their actions. Had the Royal Society realised the potential of scientists to drive political change through activism, they would have agreed that the damage to their building was justified in pursuit of averting climate and ecological collapse. Dr. Tim Hewlett, astrophysicist, and Mike Lynch-White, former theoretical physicist, were unanimously acquitted on Friday.

Despite new bills being introduced to criminalise protests [1], and available legal defences being constrained, many court juries are in fact still finding climate activists not guilty for non-violent direct action .

In this blog post, I want to introduce some key ideas which explain the power and impact these types of protest can have when used by climate activists today.

Radical Intervention: What needs to happen?

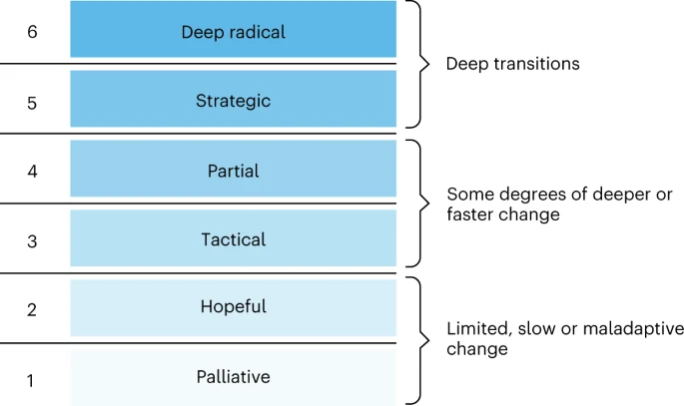
According to Morrison et al. 2020, “meaningful climate action requires interventions that are preventative, effective, and systemic – interventions that are radical rather than conventional” [2]. The term “radical” can assume different definitions, categorised in Figure 2:

Figure 2: Debates about radical intervention invoke at least six different interpretations of ‘radical’. These different interpretations can be viewed as a typology, with each type reflecting the extent to which the intervention disrupts the status quo to address the root drivers of climate change. – Morrison et al. 2022

Current approaches to address climate change focus on what may be considered category “1” and “2” interventions: avoiding systemic changes and focusing on “techno fixes” and soft economic changes (such as carbon accounting). To businesses and politicians, these approaches are often desirable and successful , because they can be rapidly implemented and offer hope. But many of these approaches can suffer from a lack of follow-up, loopholes, or may even inadvertently generate new environmental or social problems.

More radical intervention is challenging, because root drivers of climate and ecological breakdown are “deeply embedded in existing societal structures, practices and values at multiple scales, and manifest in diverse ways; including as constraints on women’s reproductive rights, through irresponsible practices of technological innovation and overconsumption, and via political obsessions with ‘small’ government”.

What might a “deep” (5 and 6) radical intervention look like? Changing our future course from one of climate collapse, to a resilient world will “require disruption of [overlooked drivers including] capitalism, colonialism and global inequality”. We should be actively questioning whether economic systems reliant on infinite growth are sustainable on a planet of finite resources, and then propose new systems that prioritise wellbeing and sustainable development within our planetary boundaries [3].

Legal Consent in Activism

Actions like throwing soup on Van Goghs, gluing a hand to a window, daubing institutions in paint may all seem disconnected from the issues protestors wish to highlight. But these actions put the focus on the absurdity of a system that has greater contempt for property damage than the knowing and wilful destruction of nature. A system where economic inequality is rising whilst the wealthiest individuals are the leading driver of emissions [4].

As Greta Thunberg says, “Our house is on fire”. Defending non-violent actions at the Royal Society and Shell’s London Offices, Dr. Hewlett used this metaphor in his closing statement:

“If I smashed a window to drag you from a burning building, most would consent to that damage; Shell has set our house on fire, and when people understand the full extent of their crimes they do not generally object to a splash of paint, they object to the crime of arson. And when scientists come to appreciate our potential to raise the fire alarm, they generally do not object to the non-violent means used to bring them to that understanding, in fact they are often grateful for having their eyes opened. In order to find us guilty, you must be sure that we did not honestly believe they might consent. If we did not honestly believe in consent, why would we even try to mobilise our community?”

Figure 3: Dr. Tim Hewlett after being acquitted from the Royal Society Case – source: Scientist Rebellion

Although the argument of “consent” was successfully used to reach an acquittal in the case of the Royal Society, during the same trial and facing the same jury, Tim was found guilty of a similar protest at Shell [5]. The deliberations of a jury are known only to the jury members, so we cannot know for sure why this conclusion was reached. Tim is currently seeking legal advice. Out of 45 pieces of evidence against Shell only 2 were accepted by the judge (the rest were hidden from the jury). Expert witnesses were denied the opportunity to talk about Shell’s human rights abuses and the company’s failure to align with the Paris agreement.

Had Tim been allowed to make arguments relevant to his protest in the Shell case, it is likely that he would have been found innocent in this case as well.

“From Publications to Public Actions”: How do we accelerate systemic changes?

Given the urgency of climate and ecological emergency, Gardner et al. 2021 suggest that universities must “expand their conception of how they contribute to the public good, and explicitly recognise engagement with advocacy as part of the work mandate of their academic staff”, and outline how work models should be adapted to support this [6].

In the most read Social Metwork blog post of 2021 [7], Gabriel Perez wrote about how our own ways of thinking are influenced by external factors, and therefore there is a need for us to be aware of our roles as scientists across all levels of politics and society. By supporting and even taking part in different forms of protest, scientists can make uniquely important contributions.

It is possible to lend additional credibility to the demands of climate activists by supporting and engaging with movements. This can range from simply signing a letter, to joining in with “low-risk” activities such as talking about these movements with friends and colleagues, joining in with marches, or engaging in outreach activities. We can even join in provocative non-violent direct actions which may pose risk to our liberty (although not everyone is as equally comfortable to do this, with potential visa issues, childcare commitment, and financial struggles being some of the barriers activists may face).

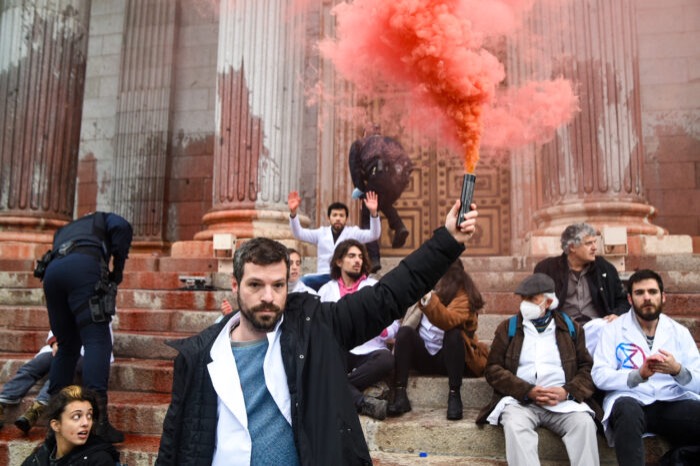
Figure 4: Una rebelión necesaria: Aprill 2022, Scientists take non-violent direct action at the Spanish congress asking for recommendations of the scientific community to become legally binding objectives with institutional mechanisms that guarantee the real participation of citizens – source: rebelioncientifica.es

As scientists, we each have a powerful toolkit to use in activism: we are trained in statistics and comprehension of complicated reports; we present our findings to different audiences; we might have experience publishing, maintaining websites, communicating across sectors, teaching. These are all valuable skills for activists to have, and we have many of them at once!

Climate activists are sometimes depicted as dangerous radicals. But, the truly dangerous radicals are the countries that are increasing the production of fossil fuels. (António Guterres, UN Secretary-General)

Closing thoughts

Climate and ecological collapse pose existential risks to humanity. If we are to avert the worst effects, and place ourselves in a position best able to support the most impacted, then we need to rethink the purpose of our societies.

Taking non-violent direct action sparks controversy, and is shocking. But as a disruptive tactic, it is successful at initiating debate.


[1] Anita Mureithi 2023 “Scrap plans to give cops more power, say women as David Carrick jailed for life” OpenDemocracy news https://www.opendemocracy.net/en/public-order-bill-metropolitan-police-david-carrick-protest

[2] Morrison, T.H., Adger, W.N., Agrawal, A. et al. Radical interventions for climate-impacted systems. Nat. Clim. Chang. 12, 1100–1106 (2022). https://doi.org/10.1038/s41558-022-01542-y

[3] Doughnut Economics Action Lab – About https://doughnuteconomics.org/about-doughnut-economics

[4] Oxfam “Survival Of The Richest: How We Must Tax The Super-Rich Now To Fight Inequality” 2023 https://www.oxfam.ca/publication/davos-report-2023

[5] Rikki Blue, “Listen to the science. Civil disobedience by 1000 scientists.”, Real Media https://realmedia.press/listen-to-the-science

[6] Gardner, C.J, Thierry, A., Rowlandson, W., Steinberger, J.K. From Publications to Public Actions: The Role of Universities in Facilitating Academic Advocacy and Activism in the Climate and Ecological Emergency. Frontiers in Sustainability. 2, 2022. https://doi.org/10.3389/frsus.2021.679019

[7] Gabriel Perez, Climate Science and Power, The Social Metwork https://socialmetwork.blog/2021/11/05/climate-science-and-power


NCAS Climate Modelling Summer School

Shammi Akhter – s.akhter@pgr.reading.ac.uk

The Virtual Climate Modelling Summer School covers the fundamental principles of climate modelling. The school is run for 2 weeks in the September of each year by the leading researchers from the National Centre for Atmospheric Science (NCAS) and from the Department of Meteorology at the University of Reading. I attended the school mainly because I have recently started using climate models in the second aspect of my research work and also because one of my supervisors recommended this to me.

What happened during the first week?

In the first week, lecturers introduced us to numerical methods used in climate models and we had a practical assignment implementing a chosen numerical method of our own in Python. We mostly worked individually on our projects that week. There were also lectures on convection parameterisation and statistical analysis for climate models.

What happened during the second week?

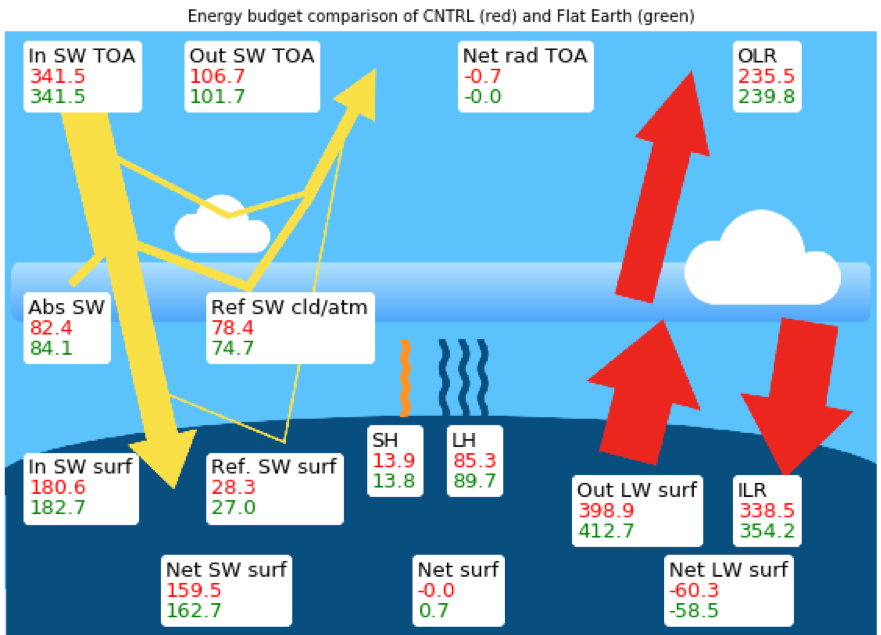
Figure 1: Earth energy budget comparison diagram between control (red) and flat earth (green) experiments produced by me in week 2.

In week two, with the assistance of NCAS and university scientists, we analysed climate model outputs. I personally was involved in the Flat Earth experiment- in which we tested the effect of changing surface elevation for terrain such as mountains, high plateaus on the climate. In this experiment, the perturbation is imposed by reducing the elevation of mountains to sea level. There were eight people in our team. As you may know, we PhD students have the occasional opportunity to do research collaboratively with other students in Reading Meteorology and encourage our teammates. For this reason, it felt very nice to me to work as the part of a research group. I was amazed by how we had been able to produce a small good piece of scientific work just within a matter of days due to our team effort. In Figure 1, I have presented a small part of our work which is the global energy budget comparison between a control experiment and the flat earth experiment (where the elevation of the mountains has been reduced to sea level). Along with our practical, we also attended some lectures on the ocean dynamics and physics, water in the climate system and land-atmosphere coupling and surface energy balance during this week.

How was it like to socialize with people virtually?

We used the Gather.town during the lunchtime and after work to socialize. I was a bit surprised though that I was the only student joining the Gather.town and as a result I always had to hang out (virtually) with NCAS and university scientists all the time. I rather consider it a blessing for me as there was no competition to introduce myself to the professionals. I even received a kind offer from one of our professors to assist him as a teaching assistant in his course in the department.

Concluding Remarks

I learnt about some of the basic concepts of climate modelling and I hope to use these things in my research someday. It was also very refreshing to talk to and work with other students as well as the scientists. While working in a group in week 2, I once again realized there are so many things we can accomplish if we work together and encourage each other.

The role of climate change in the 2003 European and 2010 Russian heatwaves using nudged storylines

Linda van Garderen – linda.vangarderen@hzg.de

During the summer of 2003, Europe experienced two heatwaves with, until then, unprecedented temperatures. The 2003 summer temperature record was shattered in 2010 by the Russian heatwave, which broke even Paleo records. The question remained, if climate change influenced these two events. Many contribution studies based on the likelihood of the dynamical situation were published, providing important input to answering this question. However, the position of low and high-pressure systems and other dynamical aspects of climate change are noisy and uncertain. The storyline method attributes the thermodynamic aspects of climate change (e.g. temperature), which are visible in observations and far more certain. 

Storylines 

All of us regularly think in terms of what if and if only. It is the human way of calculating hypothetic results in case we would have made a different choice. This helps us think in future scenarios, trying to figure out what choice will lead to which consequence. It is a tool to reduce risk by finding a future scenario that seems the best or safest outcome. In the storyline method, we use this exact mind-set. What if there was no climate change, would this heatwave be the same? What if the world was 2°C warmer, what would this heatwave have looked like then? With the help of an atmospheric model we can calculate what a heatwave would have been like in a world without climate change or increased climate change. 

In our study, we have two storylines: 1) the world as we know it that includes a changing climate, which we call the ‘factual’ storyline and 2) a world that could have been without climate change, which we call the ‘counterfactual’ storyline. We simulate the dynamical aspects of the weather extreme exactly the same in both storylines using a spectral nudging technique and compare the differences in temperatures.  To put it more precise, the horizontal wind flow is made up out of vorticity (circular movement) and divergence (spreading out or closing in). We nudge (or push) these two variables in the higher atmosphere to, on large scale, be the same in the factual and counterfactual simulations. 

Figure 1. What if we had another world where climate change did not happen? Would the heatwave have been different? Thinking in counterfactual worlds where we made (or will make) different decisions is a common way of thinking to estimate risk. Now we apply this idea in atmospheric modelling.  

European 2003 and Russian 2010 heatwaves 

Both the European heatwave in 2003 and the Russian heatwave in 2010 were extremes with unprecedented high temperatures for long periods of time. Besides, there had been little rain already from spring  in either case, which reduced the cooling effect from moisty soil to nearly nothing.  In our analysis we averaged the near surface temperatures in both storylines and compared their output to each other as well as the local climatology. Figure 2 shows the results of that averaging for the European heatwave in panel a and the Russian heatwave in panel b. We focus on the orange boxes, where the blue lines (factual storyline) and the red lines (counterfactual storyline) exceed the 5th-95th percentile climatology (green band). This means that during those days the atmosphere near the surface was uncommonly hot (thus a heatwave). The most important result in this graph is that the blue and red lines are separate from each other in the orange boxes. This means that the average temperature of the world with climate change (blue, factual) is higher than in the world without climate change (red, counterfactual).  

“Even though there would have been a heatwave with or without climate change, climate change has made the heat more extreme” 

Figure 2. Daily mean temperature at 2 meters height for (a) European summer 2003 and (b) Russian summer 2010. The orange boxes are the heatwaves, where the temperatures of the factual (blue) and counterfactual (red) are above the green band of 5th – 95th percentile climatology temperatures.  

The difference between these temperatures are not the same everywhere, it strongly depends on where you are in Europe or Russia. Let me explain what I mean with the help of Figure 3 with the difference between factual and counterfactual temperatures (right panels) on a map. In both Europe and Russia, we see that there are local regions with temperature differences of almost 0°C, and we see regions where the differences are almost 2.5°C (for Europe) or even 4°C (for Russia). A person living south from Moscow would therefore not have experienced 33°C but 29°C in a world without climate change. It is easy to imagine that such a temperature difference changes the impacts a heatwave has on e.g. public health and agriculture.  

Figure 3. Upper left: Average Temperature at 2 meter height and Geopotential height over Europe at z500 for 1-15th of August 2003, Lower left: Same as upper left but for 1-15th of Russia August 2010. Upper right: Factual minus Counterfactual average temperature at 2 meter height over Europe for 1-15th of August 2003, Lower right: same as lower left but for 1-15th of Russia August 2010. Stippling indicates robust results (all factuals are > 0.1°C warmer than all counterfactuals) 

 “The 2003 European and 2010 Russian heatwaves could locally have been 2.5°C – 4°C cooler in a world without climate change” 

We can conclude therefore, that with the help of our nudged storyline method, we can study the climate signal in extreme events with larger certainty. 

If you are interested in the elaborate explanation of the method and analysis of the two case studies, please take a look at our paper: 

van Garderen, L., Feser, F., and Shepherd, T. G.: A methodology for attributing the role of climate change in extreme events: a global spectrally nudged storyline, Nat. Hazards Earth Syst. Sci., 21, 171–186, https://doi.org/10.5194/nhess-21-171-2021 , 2021. 

If you have questions or remarks, please contact Linda van Garderen at linda.vangarderen@hzg.de

Youth voices pick up the slack: MOCK COP 26

James Fallon – j.fallon@pgr.reading.ac.uk

This year’s Conference of the Parties (COP) should have taken place earlier in November, hosted by the UK in Glasgow and in partnership with Italy. Despite many global events successfully moving online this year, from film festivals to large conferences such as the EGU general assembly, the international climate talks were postponed until November 2021.

But young people around the world are more engaged than ever before with the urgent need for international cooperation in the face of the climate emergency. The Fridays for Future (FFF) movement has recorded participation since late 2018 of more than 13,000,000 young people, in 7500 cities from all continents. FFF has adapted to the covid-19 crisis, and on 25th September this year participants from over 150 countries took part both online and in the streets, highlighting the Most Affected People and Areas (MAPA).

Unimpressed by the delay of important climate talks and negotiations, students and youth activists from FFF and a multitude of groups and movements have initiated the MOCK COP26, a 2-week online global conference on climate change that mirrors the real COP.

“My country, the Philippines, is struggling. We don’t want more floods that rise up to 15 feet, winds that peel off roofs in seconds, the rain that drowns our pets and livestock, and storm surges that ravage coastal communities. We don’t want more people to die. We’re still a developing country that contributes so little to global carbon emissions yet we face the worst of its consequences. This is absurd! 

Angelo, Philippines
https://www.mockcop.org/why

Programme

Organisers have chosen five themes to focus on:

  1. Climate education
  2. Climate justice
  3. Climate resilient livelihoods
  4. Health and wellbeing
  5. Nationally Determined Contributions

Full programme here: https://www.mockcop.org/programme

Over a dozen academic support videos break down complicated topics such as “The Kyoto Protocol”, “Agriculture and Agribusiness”, and the “History of Climate Negotiation”. These videos are helping youth delegates and all participants to understand what happens at a COP summit.

Panel sessions have featured United Nations Youth Envoy Jayathma Wickramanayake, 9 year old Climate & Environmental Activist Licypriya Kangujam, and (actual) COP26 president Alok Sharma.

High Level Country Statements

A unique aspect of MOCK COP that I have been excitedly anticipating is the high level country statements; each a 3 minute speech given by youth climate activists representing their nation.

Mock COP26 is not dominated by big polluters as COP26 is. We believe that we need to amplify the people on the frontlines of climate change, which is why we will be aiming to, throughout Mock COP, uplift the voices of those from MAPA (Most Affected People and Areas) countries above those from the Global North. This is why Mock COP26 is special.

Jamie Burrell, UK
https://www.mockcop.org/today

Youth delegates have been encouraged to give speeches in whichever language they are most comfortable talking. At the time of writing, subtitles don’t appear to be fully functioning. However a large number of talks are given in English, and transcripts of all talks have been made available here: https://drive.google.com/drive/folders/1wnQUMt-rcD9XoKtg8YPWba_LZSf16qTD

I highly recommend setting some time aside to give these speeches a listen. Although the total number might put you off, it is very easy to jump in and out of talks. You can find videos embedded below, or on the official youtube channel.

Africa

Pick: Two youth delegates represent Morocco. Whilst Morocco has been ranked a role model for climate action, the reality of the country’s future is alarming. Globally the most affected are the least protected. It’s time for world leaders to protect everyone.

Americas

Pick: The delegate for Suriname explains risks faced as a Small Island Developing State (SIDS) with infrastructure near the coast. Suriname must implement climate adaptation whilst enhancing its legislation in forestry, mining, and agriculture.

Asia

Pick: Indonesia’s delegate opens with the stark warning that the country will lose 1500 of its islands due to rising sea levels by 2050. The high level statement includes calls to incorporate climate education into the national curriculum, and find ways to protect natural habitat. Indonesia has the 2nd biggest rainforest in the world, but currently has no agreed emissions reductions pathway.

Europe

Pick: Ireland’s youth delegates present a necessarily progressive 5 year plan to stick to the EU target of reducing emissions by at least 65% by 2030. The need for much stronger climate education, and providing access to affordable and sustainable energy, are among many other commitments.

Oceania

Pick: The year started with forest fires devastating large swathes of Australia’s natural habitats. Youth delegates want their nation to lead the world as a renewable energy exporter, and an overhaul of media rules to foster new diverse media outlets and prevent monopolies that currently stall climate action.

What is the hoped outcome?

With so many connected issues relating to the climate and ecological emergency, previous COPs have often seen negotiations stall and agreements postponed. The complexity of tackling this crisis is compounded by the vested interests of powerful governments and coal, oil, and gas profiteers.

But youth messages can be heard loud and clear at MOCK COP 26, reflecting the 5 themes of the conference.

We demand concrete action, not mere promises. It’s time for our leaders to wake up, prioritize the realization of the Green Deal, and cut carbon emissions. 

We won’t have more time to alter the effects of the climate crisis if we let this opportunity pass. The clock is ticking. The time for action is NOW. 

In the wake of covid-19 induced economic shocks, policy makers must ensure genuine green recovery that engages with ideas of global climate justice.

Youth delegate panels will continue over the weekend, working towards the creation of a final statement outlining their demands for world leaders. This will be presented to High Level Climate Action Champion for COP26 Nigel Topping, at the closing ceremony (12:00 GMT Tuesday 1st December)

How Important are Post-Tropical Cyclones to European Windstorm Risk?

Elliott Sainsbury, e.sainsbury@pgr.reading.ac.uk

To date, the 2020 North Atlantic hurricane season has been the most active on record, producing 20 named storms, 7 hurricanes, and a major hurricane which caused $9 billion in damages across the southern United States. With the potential for such destructive storms, it is understandable that a large amount of attention is paid to the North Atlantic basin at this time of year. Whilst hurricanes have been known to cause devastation in the tropics for centuries, until recently there was little appreciation for the destructive potential of these systems across Europe.

As tropical cyclones such as hurricanes move poleward – away from the tropics and into regions of lower sea surface temperatures and higher vertical wind shear, they undergo a process called extratropical transition (Klein et al., 2000): Over a period of time, the cyclones change from symmetric, warm cored systems into asymmetric cold core systems fuelled by horizontal temperature gradients, as opposed to latent heat fluxes (Evans et al., 2017). These systems, so-called post-tropical cyclones (PTCs), often reintensify in the mid-latitude Atlantic with consequences for land masses downstream – often Europe. This was highlighted in 2017, when ex-hurricane Ophelia impacted Ireland, bringing with it the strongest winds Ireland had seen in 50 years (Stewart, 2018). 3 people were killed, and 360,000 homes were without power.

In a recent paper, we quantify the risk associated with PTCs across Europe relative to mid-latitude cyclones (MLCs) for the first time – in terms of both the absolute risk (i.e. what fraction of high impact wind events across Europe are caused by PTCs?) and also the relative risk (for a given PTC, how likely is it to be associated with high-impact winds, and how does this compare to a given MLC?). By tracking all cyclones impacting a European domain (36-70N, 10W-30E) in the ERA5 reanalysis (1979-2017) using a feature tracking algorithm (Hodges, 1994, 1995, 1999), we identify the post-tropical cyclones using spatiotemporal matching (Hodges et al., 2017) with the observational record, IBTrACS (Knapp et al., 2010).

Figure 1: Distributions of the maximum intensity (maximum wind speed, minimum MSLP) attained by each PTC and MLC inside (a-c) the whole European domain (36-70N, 10W-30E), (d-f) the Northern Europe domain (48-70N, 10W-30E) and (g-i) the Southern Europe domain (36-48N, 10W-30E), using cyclones tracked through the ERA5 reanalysis all year round, 1979-2017. [Figure 2 in Sainsbury et al. 2020].

Figure 1 shows the distributions of maximum intensity for PTCs and MLCs across the entire European domain (top), Northern Europe (48-70°N, 10°W-30°E; middle) and Southern Europe (36-48°N, 10°W-30°E; bottom), using all cyclone tracks all year round. The distribution of PTC maximum intensities is higher (in terms of both wind speed and MSLP) than MLCs, particularly across Northern Europe. The difference between the maximum intensity distributions of PTCs and MLCs across Northern Europe is statistically significant (99%). PTCs are also present in the highest of intensity bins, indicating that the strongest PTCs have intensities comparable to strong wintertime MLCs.

Whilst Figure 1 shows that PTCs are stronger than MLCs even when considering MLCs forming all year round (including the often much stronger wintertime MLCs), it is also useful to compare the risks posed by PTCs relative to MLCs forming at the same time of the year – during the North Atlantic hurricane season (June 1st-November 30th).

Figure 2 shows the fraction of all storms, binned by their maximum intensity in their respective domains, which are PTCs. For storms with weak-moderate maximum winds (first three bins in the figure), <1% of such events are caused by PTCs (with the remaining 99% caused by MLCs). For stronger storms, particularly those of storm force (>25 ms-1 on the Beaufort scale), this percentage is much higher. Despite less than 1% of all storms impacting Northern Europe during hurricane season being PTCs, almost 9% of all storms with storm-force winds which impact the region are PTCs, suggesting that a disproportionate fraction of high-impact windstorms are PTCs. 8.2% of all Northern Europe impacting PTCs which form during hurricane season impact the region with storm-force winds. This fraction is only 0.8% for MLCs, suggesting that the fraction of PTCs impacting Northern Europe with storm-force winds is approximately 10 times greater than MLCs.

Figure 2: The fraction of cyclones impacting Europe which are PTCs as a function of their maximum 10m wind speed in their respective domain. Lower bound of wind speed is shown on the x axis, bin width = 3. Error bars show the 95% confidence interval. All cyclone tracks forming during the North Atlantic hurricane season are used. [Figure 4 in Sainsbury et al. 2020].

Here we have shown that PTCs, at their maximum intensity over Northern Europe, are stronger than MLCs. However, the question still remains as to why this is the case. Warm-seclusion storms post-extratropical transition have been shown to have the fastest rates of reintensification (Kofron et al., 2010) and typically have the lowest pressures upon impacting Europe (Dekker et al., 2018). Given the climatological track that PTCs often take over the warm waters of the Gulf stream, along with the contribution of both baroclinic instability and latent heat release for warm-seclusion development (Baatsen et al., 2015), one hypothesis may be that PTCs are more likely to develop into warm seclusion storms than the broader class of mid-latitude cyclones, potentially explaining the disproportionate impacts they cause across Europe. This will be the topic of future work.

Despite PTCs disproportionately impacting Europe with high intensities, they are a relatively small component of the total cyclone risk in the current climate. However, only small changes are expected in MLC number and intensity under RCP 4.5 (Zappa et al., 2013). Conversely, the number of hurricane-force (>32.6 ms-1) storms impacting Norway, the North Sea and the Gulf of Biscay has been projected to increases by a factor of 6.5, virtually all of which originate in the tropics (Haarsma et al., 2013). Whilst the absolute contribution of PTCs to hurricane season windstorm risk is currently low, PTCs may make an increasingly significant contribution to European windstorm risk in a future climate.

Interested to read more? Read our paper, published in Geophysical Research Letters.

Sainsbury, E. M., R. K. H. Schiemann, K. I. Hodges, L. C. Shaffrey, A. J. Baker, K. T. Bhatia, 2020: How Important Are Post‐Tropical Cyclones for European Windstorm Risk? Geophysical Research Letters, 47(18), e2020GL089853, https://doi.org/10.1029/2020GL089853

References

Baatsen, M., Haarsma, R. J., Van Delden, A. J., & de Vries, H. (2015). Severe Autumn storms in future Western Europe with a warmer Atlantic Ocean. Climate Dynamics, 45, 949–964. https://doi.org/10.1007/s00382-014-2329-8

Dekker, M. M., Haarsma, R. J., Vries, H. de, Baatsen, M., & Delden, A. J. va. (2018). Characteristics and development of European cyclones with tropical origin in reanalysis data. Climate Dynamics, 50(1), 445–455. https://doi.org/10.1007/s00382-017-3619-8

Evans, C., Wood, K. M., Aberson, S. D., Archambault, H. M., Milrad, S. M., Bosart, L. F., et al. (2017). The extratropical transition of tropical cyclones. Part I: Cyclone evolution and direct impacts. Monthly Weather Review, 145(11), 4317–4344. https://doi.org/10.1175/MWR-D-17-0027.1

Haarsma, R. J., Hazeleger, W., Severijns, C., De Vries, H., Sterl, A., Bintanja, R., et al. (2013). More hurricanes to hit western Europe due to global warming. Geophysical Research Letters, 40(9), 1783–1788. https://doi.org/10.1002/grl.50360

Hodges, K., Cobb, A., & Vidale, P. L. (2017). How well are tropical cyclones represented in reanalysis datasets? Journal of Climate, 30(14), 5243–5264. https://doi.org/10.1175/JCLI-D-16-0557.1

Hodges, K. I. (1994). A general method for tracking analysis and its application to meteorological data. Monthly Weather Review, 122(11), 2573–2586. https://doi.org/10.1175/1520-0493(1994)122<2573:AGMFTA>2.0.CO;2

Hodges, K. I. (1995). Feature Tracking on the Unit Sphere. Monthly Weather Review, 123(12), 3458–3465. https://doi.org/10.1175/1520-0493(1995)123<3458:ftotus>2.0.co;2

Hodges, K. I. (1999). Adaptive constraints for feature tracking. Monthly Weather Review, 127(6), 1362–1373. https://doi.org/10.1175/1520-0493(1999)127<1362:acfft>2.0.co;2

Klein, P. M., Harr, P. A., & Elsberry, R. L. (2000). Extratropical transition of western North Pacific tropical cyclones: An overview and conceptual model of the transformation stage. Weather and Forecasting, 15(4), 373–395. https://doi.org/10.1175/1520-0434(2000)015<0373:ETOWNP>2.0.CO;2

Knapp, K. R., Kruk, M. C., Levinson, D. H., Diamond, H. J., & Neumann, C. J. (2010). The international best track archive for climate stewardship (IBTrACS). Bulletin of the American Meteorological Society, 91(3), 363–376. https://doi.org/10.1175/2009BAMS2755.1

Kofron, D. E., Ritchie, E. A., & Tyo, J. S. (2010). Determination of a consistent time for the extratropical transition of tropical cyclones. Part I: Examination of existing methods for finding “ET Time.” Monthly Weather Review, 138(12), 4328–4343. https://doi.org/10.1175/2010MWR3180.1

Stewart, S. R. (2018). Tropical Cyclone Report: Hurricane Ophelia. National Hurricane Center, (February), 1–32. https://doi.org/AL142016

Zappa, G., Shaffrey, L. C., Hodges, K. I., Sansom, P. G., & Stephenson, D. B. (2013). A multimodel assessment of future projections of North Atlantic and European extratropical cyclones in the CMIP5 climate models. Journal of Climate, 26(16), 5846–5862. https://doi.org/10.1175/JCLI-D-12-00573.1

A Journey through Hot British Summers

Email: s.h.lee@pgr.reading.ac.uk

The phrase “British summer” tends to evoke images of disorganised family barbecues being interrupted by heavy rain, or the covers coming on at Wimbledon, or the saying “three fine days and a thunderstorm”. Yet in recent years, hot weather has become an increasingly regular occurrence. Let me take you on a brief tour of notably hot summers in the UK. I’ll largely draw on the Met Office HadUK-Grid dataset, shown in Figure 1.

Figure 1: Nationally-averaged daily maximum temperatures for June-July-August from HadUK-Grid. In red is a 30-year centred running mean, which has risen by 1°C since the mid-20th century.

HadUK-Grid begins in 1884, but thanks to the Central England Temperature dataset (which extends back to 1659), we do have records of earlier heatwaves.  These include the hot summer of 1666, which set the scene for the Great Fire of London in September. The summers of 1781, 1826 and 1868 were also particularly hot. The first hot summer in the HadUK-Grid series is 1899, which was the warmest summer by average maxima in that series until 1976!

But our journey properly begins in 1911, when the temperature reached 36.7°C on August 9th. At the time, this was the highest reliably recorded temperature measured in the UK. It is hard to imagine how this summer must have felt at the time – not least in the cooler average climate, but also with the less developed infrastructure and clothing customs of the time. As with any heatwave, its impacts were large with increased death, drought, and agricultural impacts. The summer of 1911 was followed by the summer of 1912, which was the 2nd wettest on record for the UK. Such a turnaround must have been equally hard to believe and does highlight that extreme swings in the British weather are not, in themselves, new. In a series from 1884, the summer of 1911 is the 8th warmest in terms of the UK average maximum temperature (at the time, it would have been 2nd, with only 1899 warmer).

Stopping briefly in 1933 (which eclipsed 1911, but pales in comparison with the dustbowl conditions being experienced in the US at the time) and then again in August 1947 (which remains 2nd warmest for UK average maxima and the nation’s driest, and was in huge contrast to the tremendously snowy and cold February), our next destination is 1975.

1975 currently ranks as the 11th warmest for UK average maxima but is also the 19th driest. This, when combined with the dry winter that followed, set the scene for the infamous summer of 1976. Both these summers followed a spell of very cool summers, with no particularly remarkable summers in the 1960s, while the UK did not see a temperature above 28°C in 1974 (almost unthinkable nowadays). I won’t go into huge detail about the 1976 summer, but it is engrained in the minds of a generation thanks not only to its remarkable June heatwave (which has never been matched) but also the cool climate in which it occurred. It ranks as the 2nd driest summer for the UK and remains the warmest on record in terms of average maxima – though no individual month holds the number 1 spot.

Let us next whizz off to July 1983, which at the time had the warmest nationally averaged maxima for the month (it now ranks 3rd). Oddly enough, while the UK baked in heat, the temperature at Vostok, Antarctica dropped to -89.2°C on the 21st – the lowest surface-based temperature ever recorded. I am keeping the topic of this blog to hot summers, but I want to give 1985 a special mention – the most recent summer when the UK-average maxima were less than 17°C, a formerly frequent occurrence.

As we hot-foot it toward the end of the 20th century (pun intended), we arrive at 1990. Liverpool had just won the First Division (sound familiar?) and on August 3rd the temperature at Cheltenham, Gloucestershire reached 37.1°C – beating the record set in 1911 after 79 years. That night, the temperature fell to only 23.9°C in Brighton – the warmest night on record. However, the heatwave was rather brief but intense (3 consecutive days exceeded 35°C, the only other occurrences were in 1976). For a prolonged heatwave, we jump to August 1995. With a UK average maximum of 22.8°C, it remains the UK’s warmest August by that metric, and the 2nd driest. The summer ranks 2nd warmest by maxima. Soon after, the August of 1997 (4th warmest) added to growing evidence of a change to the British climate.

But it was in the August of 2003 when things really kicked off. In the earliest heatwave I remember, the temperature hit 38.5°C on the 10th at Faversham, Kent (satellite image in Figure 2) – the first time the UK had surpassed 37.8°C (100°F) and breaking the record from 1990 after only 23 years. 30°C was exceeded somewhere for 10 consecutive days. The summer of 2003 ranks nowadays as 6th warmest by average maxima; across Europe conditions were more extreme with a huge estimated death toll.

Figure 2: Terra-MODIS imagery from 10 August 2003, when the UK first surpassed 100°F and most of Europe was experiencing an intense heatwave (via https://worldview.earthdata.nasa.gov/)

Only 3 years later, July 2006 set the record for the hottest month for the UK-average maxima (23.3°C), and set – at the time – a record for the highest-recorded July temperature (36.5°C at Wisley on the 19th). Ranking 4th warmest by average maxima, the summer was even more extreme across mainland Europe.

What followed from 2007 through 2012 was a spell of wet summers, but we shrug off all that Glastonbury mud to arrive at July 2013, which currently ranks as 4th warmest by average maxima and saw the longest spell of >28°C weather since 1997.

Skipping through in increasingly short steps, we arrive for a brief blast on July 1st, 2015 – when the July record from 2006 fell, with 36.7°C at Heathrow in an otherwise cool month. We hop over now to 2018…

The summer of 2018, memorable for England’s performance in the World Cup, saw very warm temperatures in June and July. By nationally averaged maxima, June 2018 ranks 2nd behind 1940, and July sits 2nd behind 2006. The summer ranks 3rd, but by mean temperature is the warmest. Though not reaching the dizzying highs of 2003 (“only” 35.3°C was reached on July 26th), the prolonged dry conditions which began in May across England led to parched grasses (Figure 3), wildfires, and low river levels. I may have also had a viral tweet.

Figure 3: Brown grass during summer 2018 at the University of Reading, as seen in Google Earth.

With the present day in sight, our journey is not yet over. Stepping into 2019, an otherwise unremarkable summer was characterised with huge bursts of heat – setting records across Europe – which on July 25th saw the temperature reach 38.7°C at Cambridge Botanic Gardens. This eclipsed the 2003 record and became only the 2nd day – at the time – when 100°F or more had been reached in the UK.

But that is still not the end of the story! After a record-setting sunny spring followed by a mixed first half of summer, on July 31st 2020 the temperature at Heathrow hit 37.8°C – becoming the UK’s third warmest day on record and the third time 100°F had been recorded. The following Friday, 36.4°C was reached at Heathrow and Kew – the UK’s 9th warmest day on record, and highest temperature in August since 2003. Figure 4 shows the view at the University atmospheric observatory shortly after 34.8°C was reached, Reading’s 4th highest in August since records began in 1908.

Figure 4: The University of Reading Atmospheric Observatory on the afternoon of August 7th, shortly after 34.8°C had been recorded by the automatic sensor.

Forecasts suggest a continuation of hot weather through the next week or so, with many records up for grabs. However, we should be mindful that heatwaves cause suffering and excess deaths, too. And, with the evidently increasing frequency with which these hot extremes are occurring (note how so many of the stops on my tour were clustered in the last 30 years), they are not good news, but another sign that our climate is changing.

Now that we have blasted through the 100°F barrier, our attention turns to 40°C. Research suggests this is already becoming much more likely thanks to climate change and will continue to do so. Reaching such extremes in the UK requires a unique combination of factors – but when these do come together, expect yet more records to fall.

Thanks to Stephen Burt for useful discussions.

Further Reading:

McCarthy, M., et al. 2019: Drivers of the UK summer heatwave of 2018. Weather, https://doi.org/10.1002/wea.3628.

Black, E., et al. 2006: Factors contributing to the summer 2003 European heatwave. Weather, https://doi.org/10.1256/wea.74.04

Burt, 2006: The August 2003 heatwave in the United Kingdom: Part 1 – Maximum temperatures and historical precedents. Weather, https://doi.org/10.1256/wea.10.04A

Burt and Eden, 2007: The August 2003 heatwave in the United Kingdom: Part 2 – The hottest sites. Weather, https://doi.org/10.1256/wea.10.04B

Brugge, 1991: The record-breaking heatwave of 1-4 August 1990 over England and Wales. Weather, https://doi.org/10.1002/j.1477-8696.1991.tb05667.x

How do ocean and atmospheric heat transports affect sea-ice extent?

Email: j.r.aylmer@pgr.reading.ac.uk

Downward trends in Arctic sea-ice extent in recent decades are a striking signal of our warming planet. Loss of sea ice has major implications for future climate because it strongly influences the Earth’s energy budget and plays a dynamic role in the atmosphere and ocean circulation.

Comprehensive numerical models are used to make long-term projections of the future climate state under different greenhouse gas emission scenarios. They estimate that the Arctic ocean will become seasonally ice free by the end of the 21st century, but there is a large uncertainty on the timing due to the spread of estimates across models (Fig. 1).

Figure 1: Projections of Arctic sea-ice extent under ‘moderate’ emissions in 20 recent-generation climate models. Model data: CMIP6 multi-model ensemble; observational data: National Snow & Ice Data Center.

What causes this spread, and how might it be reduced to better constrain future projections? There are various factors (Notz et al. 2016), but of interest to our work is the large-scale forcing of the atmosphere and ocean. The mean atmospheric circulation transports about 3 PW of heat from lower latitudes into the Arctic, and the oceans transport about a tenth of that (e.g. Trenberth and Fasullo, 2017; 1 PW = 1015 W). Our goal is to understand the relative roles of Ocean and Atmospheric Heat Transports (OHT, AHT) on long timescales. Specifically, how sensitive is the sea-ice cover to deviations in OHT and AHT, and what underlying mechanisms determine the sensitivities?

We developed a highly simplified Energy-Balance Model (EBM) of the climate system (Fig. 2)—it has only latitudinal variations and is described by a few simple equations relating energy transfer between the atmosphere, ocean, and sea ice (Aylmer et al. 2020). The latitude of the sea-ice edge is an analogue for ice extent in the real world. The simplicity of the EBM allows us to isolate the basic physics of the problem, which would not be possible going directly with the complex output of a full climate model.

Figure 2: Simplified schematic of our Energy-Balance Model (EBM; see Aylmer et al. 2020 for technical details). Arrows represent energy fluxes, each varying with latitude, between the atmosphere, ocean, and sea ice.

We generated a set of simulations in which OHT varies and checked the response of the ice edge. This is a measure of the effective sensitivity of the ice cover to OHT (Fig. 3a)—it is not the actual sensitivity because AHT decreases (Fig. 3b), and we are really seeing in Fig. 3a the net response of the ice edge to changes in both OHT and AHT.

Figure 3: (a) Effective sensitivity of the (annual-mean) sea-ice edge to varying OHT (expressed as the mean convergence over the ice pack). (b) AHT convergence reduces at the same time, which partially cancels the true impact of increasing OHT on sea ice.

This reduction in AHT with increasing OHT is called Bjerknes compensation, and it occurs in full climate models too (Outten et al. 2018). Here, it has a moderating effect on the true impact of increasing OHT. With further analysis, we determined the actual sensitivity to be about 1.5 times the effective sensitivity. The actual sensitivity of the ice edge to AHT turns out to be about half that to the OHT.

What sets the difference in OHT and AHT sensitivities? This is easily answered within the EBM framework. We derived a general expression for the ratio of (actual) ice-edge sensitivities to OHT (so) and AHT (sa):

A higher-order term has been neglected for simplicity here, but the basic point remains: the ratio of sensitivities mainly depends on the parameters BOLR and Bdown. These are bulk representations of atmospheric feedbacks and determine the efficiency of outgoing and downwelling longwave radiation, respectively. They are always positive, so the ice edge is always more sensitive to OHT than AHT.

The interpretation of this equation is simple. AHT converging over the ice pack can either be transferred to the underlying sea ice, or radiated to space, having no impact on the ice, and the partitioning is controlled by Bdown and BOLR. The same amount of OHT converging under the ice pack can only go through the ice and is thus the more efficient driver.

Climate models with larger OHTs tend to have less sea ice (Mahlstein and Knutti, 2011). We have also found strong correlations between OHT and the sea-ice edge in several of the models listed in Fig. 1 individually. Ice-edge sensitivities and B values can be determined per model, and our equation predicts how these should be related. Our work thus provides a way to investigate how much physical biases in OHT and AHT contribute to sea-ice-projection uncertainties.