Flynn Ames - f.ames@pgr.reading.ac.uk
For my first (and given carbon budgets, possibly the last) in-person conference of my PhD, I was lucky enough to go to AGU (American Geophysical Union Conference) in December 2023, taking place in San Francisco, California. As my first time in America, there was a lot to be excited about. As my first time presenting at a conference, there was a lot to be nervous about. So what did I discover?
To echo the previous year’s post: AGU is big. I mean really big. I mean seriously (please take me seriously) its huge. The poster hall was the size of an aircraft hangar – poster slots were numbered from 1 to over 3000, with each slot used by a different person for each day. Dozens of talk sessions were held at any time simultaneously across the three separate buildings (that thankfully were very close to each other), commencing anytime from 8am to 6pm, Monday to Friday. I was recommended the AGU app and would (uncharacteristically) do the same as it was very helpful in navigating the sessions. I’d also recommend properly planning what you want to attend in advance of the conference – it is very easy to miss potentially relevant sessions otherwise.
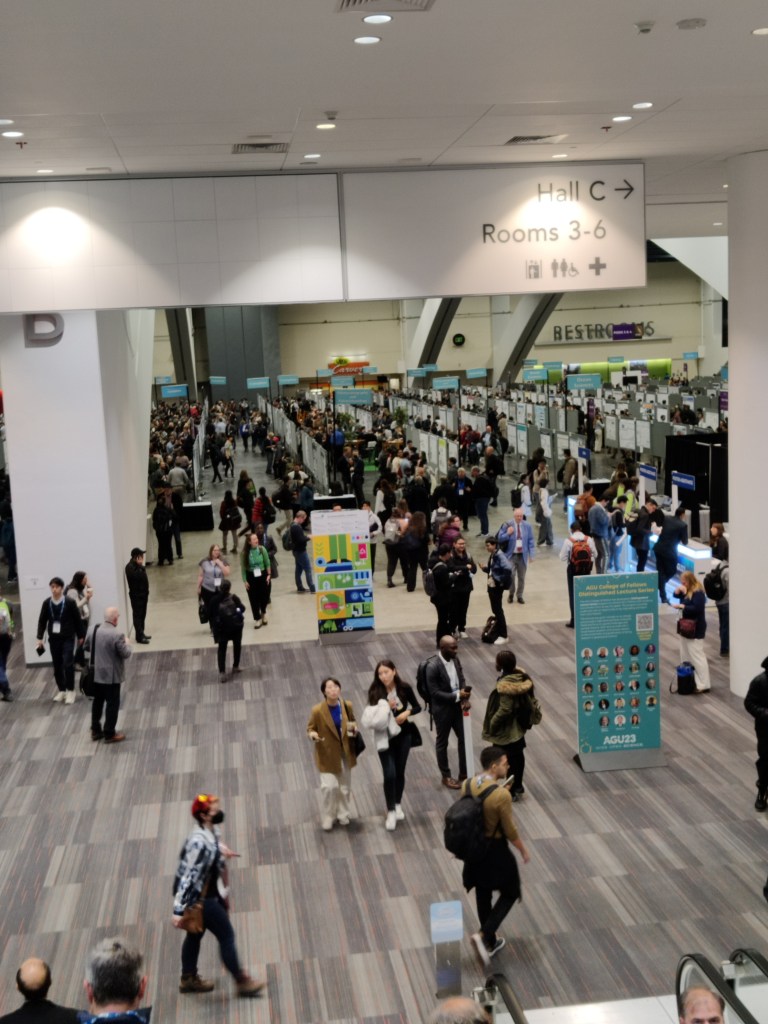
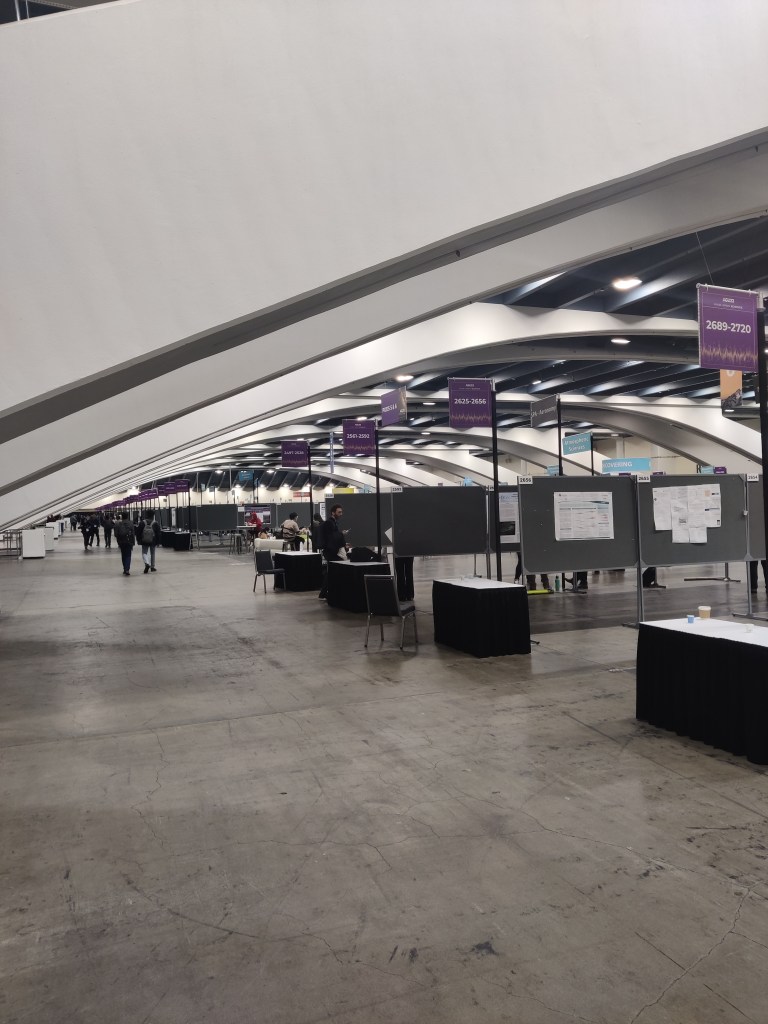
The poster hall from two different angles on Monday Morning (left) and Friday evening (right).
The keynote lectures (one per day) were like something out of Gamescom or E3. They always started with flashy, cinematic vignettes. Hosts and speakers had their own entrance theme song to walk out on stage to, whether that be Katy Perry ‘Fireworks’ or Johnny Cash ‘Ring of Fire’ (and of course, they had the cliche teleprompter from which to read). Some Keynote talks were OK in terms of content, but others were definitely a miss, seemingly prioritising style over substance or referring to subject matter in too abstract a way, so that it was difficult to gauge what the take home message was meant to be. I’d say attend at least one for the experience but skip the rest if they don’t appeal to you.
There were also miscellaneous activities to partake in. Exhibition Hall F was where you could find stalls of many research organisations, along with any American or Chinese university you can name (NASA had a cool one with some great graphics). In that same place you could also get a free massage (in plain sight of everyone else) or a professional headshot (which I tried – they brushed something on my face, I don’t know what it was) or even hang out with the puppies (a stall frequented by a certain Met PhD student). You could say there was something for everyone.
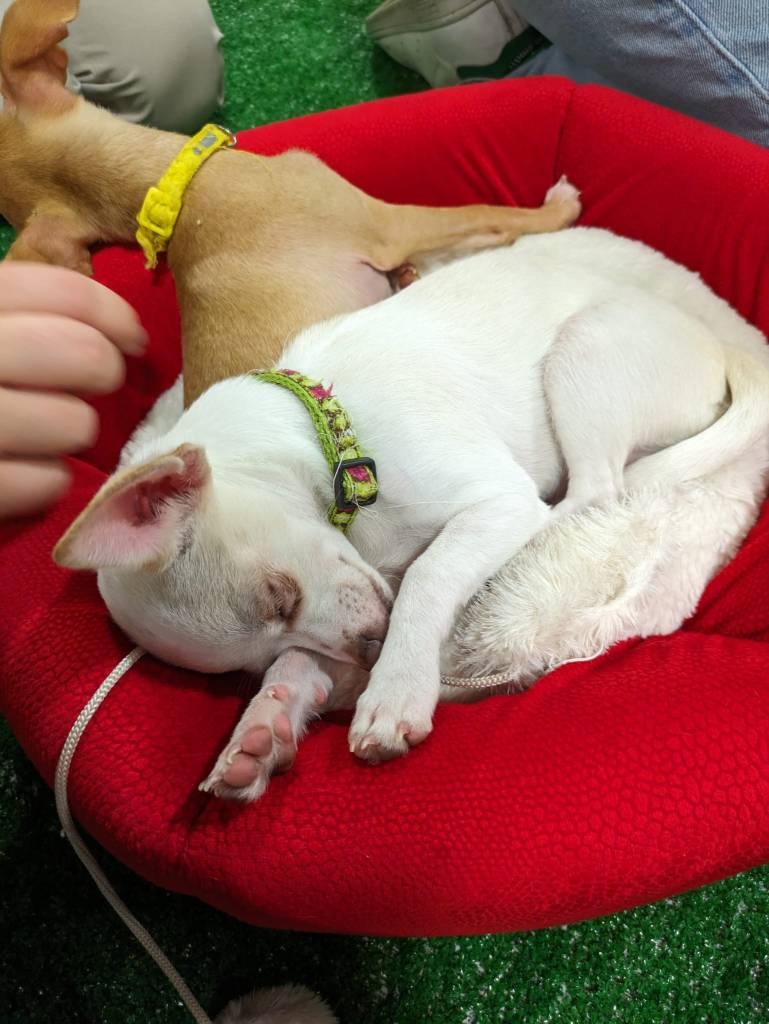
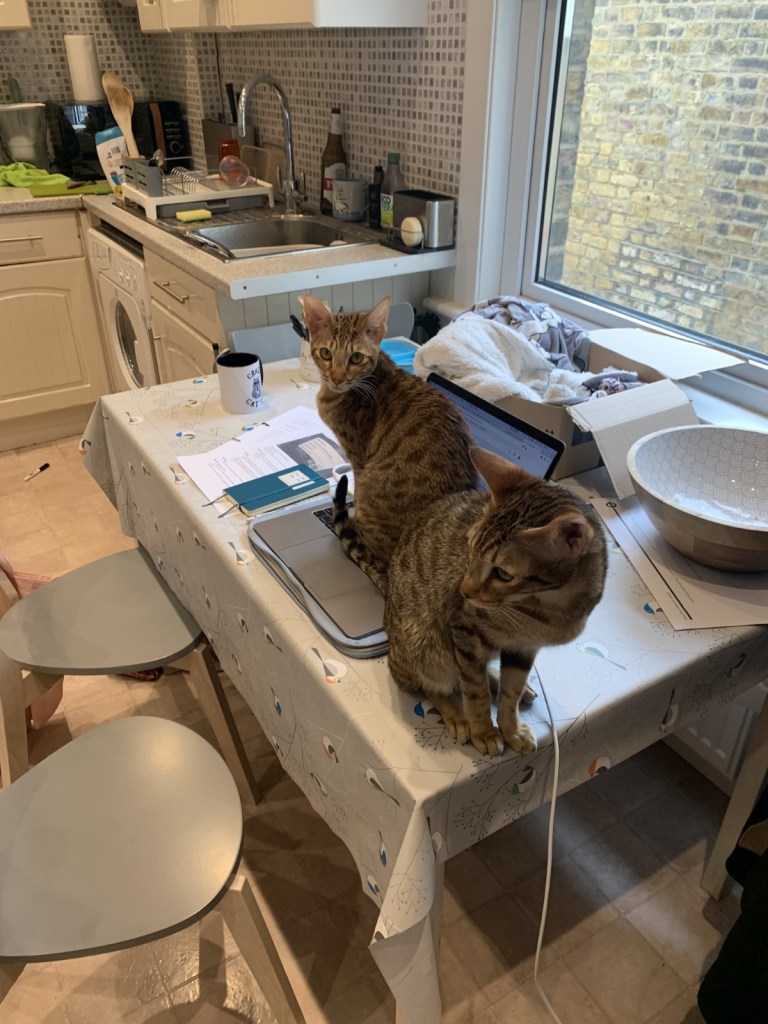
I wasn’t the only one needing rest after a long day of conferencing.
I found poster sessions to be far more useful than talks. Most talks were eight minutes long, with a red light switching on after seven. With these time constraints, presenters are often forced to assume knowledge and cram in content and slides. The presentations can be hard to follow at the best of times, but especially when you yourself are presenting later in the week and all you can do is watch and wait for that red light, knowing that it will be deciding your fate in days to come. In contrast, posters can be taken at one’s own pace – you can ask the presenter to tailor their “spiel” to you, whether that’s giving a higher-level overview (as I asked for 100% of the time) or skipping straight to the details. You get a proper chance to interact and have conversations with those doing work you’re interested in, in contrast to talks where your only hope is to hunt down and corner the presenter in the few microseconds after a session ends.
With that said, there were many great talks. Some of the coolest talks I attended were on existing and future mission concepts to Europa (moon of Jupiter) and Enceladus (moon of Saturn) respectively, which has tangential relevance to my own project (icy moon oceanography – probably best left for a future post). In these talks, they discussed the science of the upcoming Europa Clipper mission, along with a robotic EEL concept (like a robot snake) for traversing within and around the icy crevasses on Enceladus’s surface. It was really cool (and very lucky) getting to interact with people working on Europa Clipper and the current Juno mission orbiting Jupiter. Given the time taken between a mission’s proposal, getting (and sometimes losing) funding, planning, construction, and eventual launch and arrival, many of these scientists had been working on these missions for decades!
My own talk was scheduled for the final conference day (given the luck with everything else, I won’t complain) at 8:40 am. While seemingly early, I struggled to sleep beyond 3:30am most days anyway owing to jet lag so by 8:40am, stress ensured I was wide awake, alert, and focused.
The talk was over in a flash – I blinked and it was done (more or less).
The most academically helpful part of the conference was the conversations I had with people about my work after the talk. This was my main take away from AGU – that getting to know people in your field and having in-depth conversations really can’t have been achieved by reading someone’s paper, or even sending an email. Meeting in-person really helps. A poster session can thankfully make this feel very natural (as opposed to just randomly walking up to strangers – not for me…) and is therefore something I recommend taking advantage of. Besides, if they’re presenting a poster, they’re less able to run away, even if they want to.
A quick bullet point list of other things I learned (and didn’t) while at AGU:
Things I learned:
- Apparently, PhD students having business cards is normal in America? – I got handed one during a dinner and the whole table didn’t understand why I was confused
- NO BISCUITS DURING COFFEE BREAKS in America – probably because you can’t get biscuits easily in America. Regardless, my stomach deemed this a poor excuse.
- Food portions are, in general, much bigger – surely to make up for the lack of biscuits during coffee breaks.
Things I didn’t learn:
- How the automatic flush mechanism worked in the conference venue toilets (I really tried)
- Given there were dozens of sessions happening simultaneously at the conference, probably many other things.
After AGU finished, I was lucky enough to spend extra time in San Francisco. The city really has a piece of everything: fantastic walks near the Golden Gate and coastal area, the characteristic steep streets and cable cars, lots of great places to eat out (great for vegans/vegetarians too! :)), and they had unexpectedly good street musicians. The weather was very nice for December – around 18 degrees. I even got sunburned on one of the days. Public transport is great in San Francisco and getting around the city was no issue.
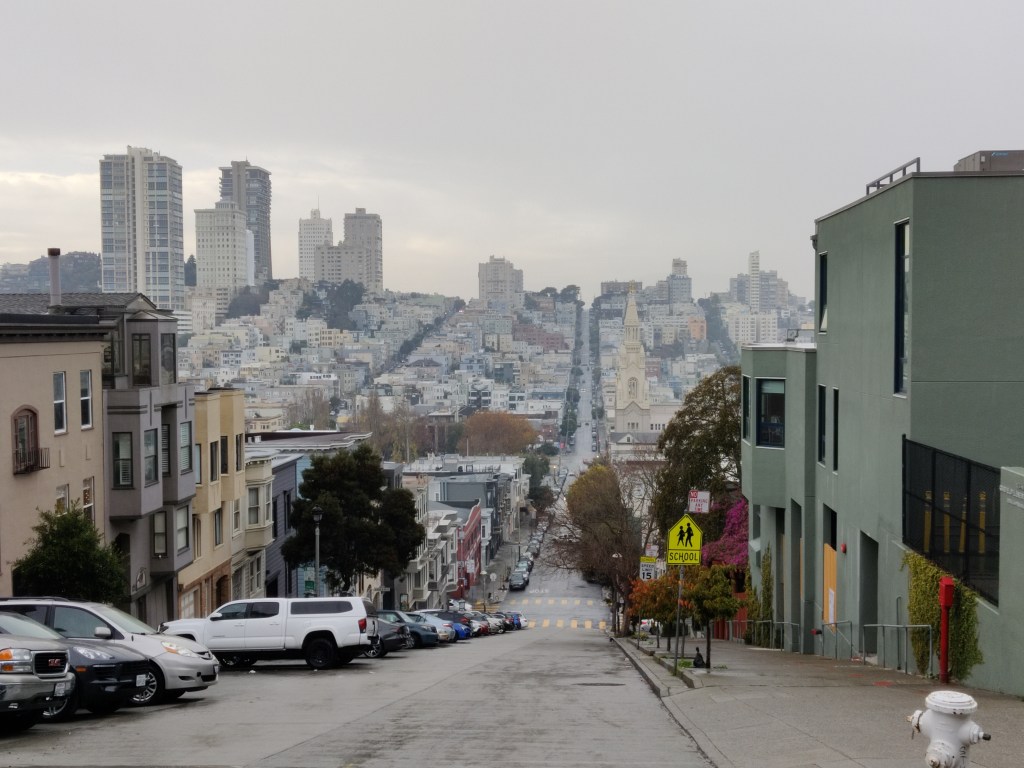
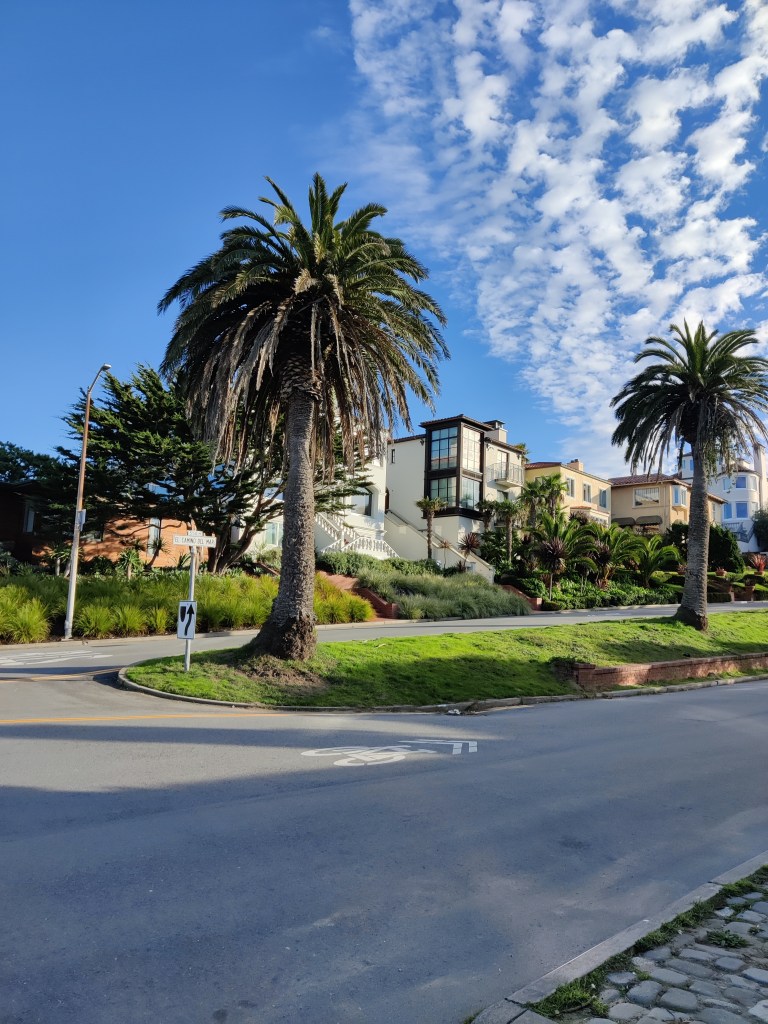
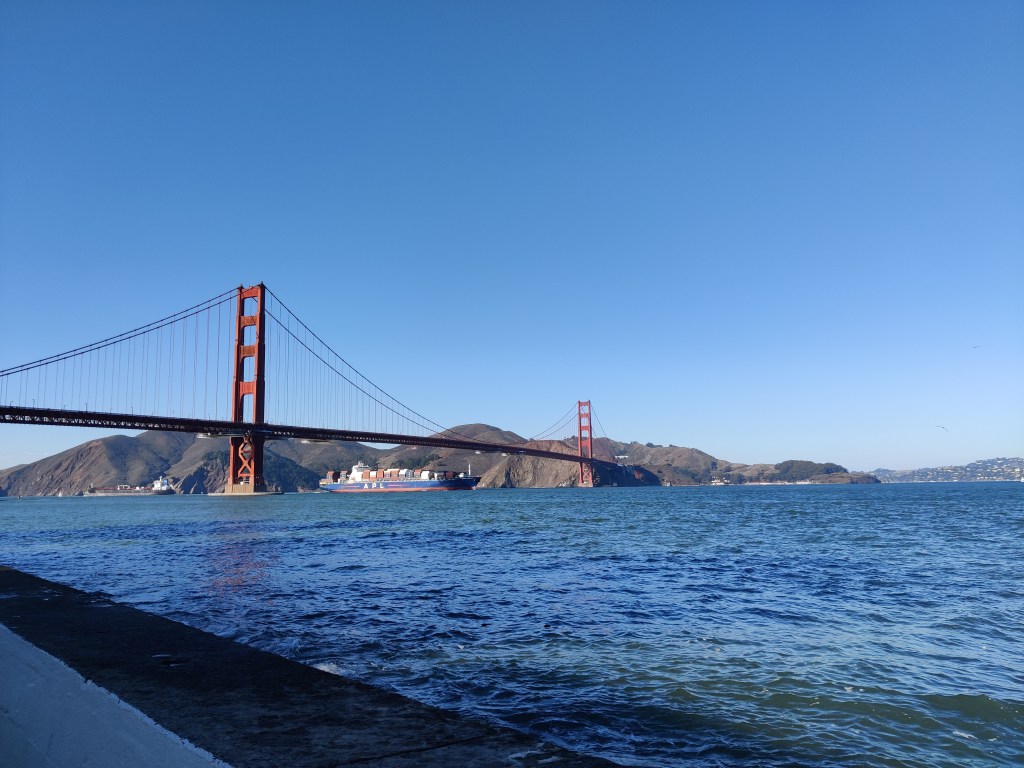
Some of the various sights (and only pictures I took) in San Francisco.
But San Francisco also appears to be a city of extremes. There are mansions near the beach in an area that looks like a screenshot from Grand Theft Auto Five. Meanwhile in the city itself, the scale of homelessness is far beyond anything I’ve observed here in the UK. I’d very frequently walk past people with large trolleys containing what appeared to be all their belongings. Nearby the Tenderloin district, pitched tents on the pathways next to roads were common, with people cooking on gas stoves. The line to what appeared to be one soup kitchen stretched outside and round the corner. Drug use was also very noticeable. I frequently spotted people slumped over in wheelchairs, others passed out in a subway station or outside a shop. People pass by as if no-ones there. It’s one thing hearing about these issues, but it is eye-opening to see it.
Overall, attending AGU in San Francisco was an experience I will not forget and certainly a highlight of my PhD so far – I’m very grateful I was able to go! Next year’s AGU will take place in Washington DC from 9th-13th December. Will you be there? Will you be the one to write next years AGU post? Stay tuned to the Social Metwork (and for the latter, your email inbox) to find out.