Email: t.hall@pgr.reading.ac.uk
Observations of sea surface temperature (SST) form one of the key components of the climate record. There are a number of different in-situ based reconstructions of SST extending back over 150 years, but they are not truly independent of each other because the observations they are based on are largely the same (Berry et al., 2018). Datasets of SST retrieved from satellite radiometers exist for the 1980s onwards, providing an independent record of SST. Before this, SST reconstructions are based on sparse, ship-based measurements.
There were meteorological measurements being made from satellites in the 1960s and 70s, however, some of which can potentially be used to retrieve SST. My PhD focuses on investigating if we can retrieve SST from one of these early satellite instruments, to test the reliability of the SST reconstructions before the 1980s. This instrument is the Infrared Interferometer Spectrometer (IRIS), which made measurements of atmospheric emission spectra on-board the Nimbus 4 satellite from April 1970 to January 1971. IRIS had over 800 thermal infrared (IR) channels, covering the 400-1600 cm-1 spectral region. Figure 1 shows an example of two typical IRIS radiance spectra, with the main spectral absorption features labelled as well as the atmospheric window regions, which are the main spectral regions used for SST retrieval.

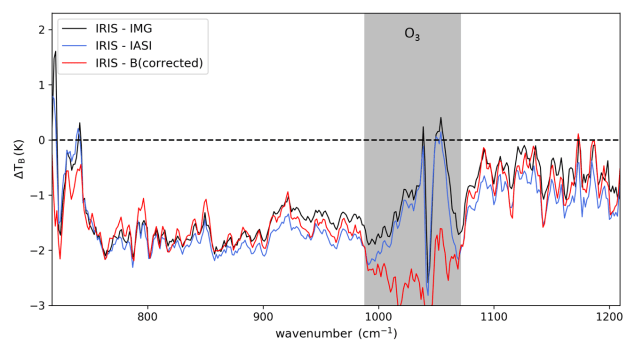
Before using the IRIS data to retrieve SST, it was necessary to apply a series of quality assurance tests to filter out bad data. A few months into my PhD, work by Bantges et al. (2016) revealed evidence for a wavelength dependent cold bias of up to 2K in the data. A large part of my PhD was spent trying to quantify this bias. This was done by comparing clear-sky IRIS spectra with spectra simulated with a radiative transfer model. Unfortunately, this meant that the SSTs eventually retrieved from IRIS are not totally independent of the SST reconstructions as the simulations are based on reanalysis data forced by the HadISST2 reconstruction. Figure 2 compares our estimate of the IRIS spectral bias with globally averaged spectral differences between IRIS, the Interferometric Monitor for Greenhouse Gases (IMG) and the Infrared Atmospheric Sounding Instrument (IASI) from Bantges et al. (2016). This shows close agreement between our bias estimate and the IRIS-IMG and IRIS-IASI differences outside of the ozone spectral region, which is not relevant for SST retrieval.
It cannot just be assumed that the bias is the same for each IRIS measurement. Comparison of IRIS (bias-corrected using our initial bias estimate) with window channel data from the Temperature-Humidity Infrared Radiometer (THIR), also on-board Nimbus 4, reveals that the relative IRIS-THIR bias varies with window brightness temperature and orbit angle. The THIR, however, may have biases of its own, so these biases cannot be attributed to IRIS.
The technique of optimal estimation was applied to retrieve SST from IRIS. This uses the observation-simulation differences together with information about the sensitivity of the simulations to the state of the atmosphere and ocean to estimate the SST. IR satellite retrievals of SST are usually performed in clear-sky conditions only. However, the low spatial resolution of IRIS means that very few cases are fully clear-sky. For this reason, we had to adapt the retrieval method to be tolerant of some cloud. This involves retrieving SST simultaneously with cloud fraction (CF). The retrieval method was then tested on partly cloudy (≤0.2 CF) IASI spectra made ‘IRIS-like’ by spatial averaging, spectral smoothing and simulating IRIS-like errors. The retrieved IRIS-like SSTs were validated against quality-controlled drifting buoy SSTs. This revealed latitudinal biases in the retrieved SSTs for the partly cloudy cases, not present in the SSTs for clear-sky cases.
SSTs were then retrieved for all IRIS cases with an expected CF ≤ 0.2. Figure 3 shows the difference between the gridded, monthly average IRIS SSTs and two of the SST reconstructions (HadSST3 and HadISST2) for July 1970. There are large, spatially correlated differences between the IRIS SSTs and reconstructions. We expect a latitudinal bias in the IRIS SSTs and some level of remaining bias in the IRIS spectra is likely, contributing to further SST bias. It is therefore likely that the differences in Figure 3 are mainly due to bias in the IRIS SSTs rather than the reconstructions.

Despite being unable to retrieve bias-free SST estimates from IRIS, my work has contributed towards better understanding the characteristics of IRIS. This ties in with a current project aiming to recover and assess the quality of data from a number of different historic satellite sensors, including IRIS, for assimilation in the next generation of climate reanalyses.
References
Bantges, R., H. Brindley, X. H. Chen, X. L. Huang, J. Harries, J. Murray (2016), On the detection of robust multi-decadal changes in the Earth’s Outgoing Longwave Radiation spectrum. J. Climate, 29, 4939-4947. https://doi.org/10.1175/JCLI-D-15-0713.1
Berry, D. I., G. K. Corlett, O. Embury, C. J. Merchant (2018), Stability assessment of the (A)ATSR Sea Surface Temperature climate dataset from the European Space Agency Climate Change Initiative. Remote Sens., 10, 126. https://doi.org/10.3390/rs10010126