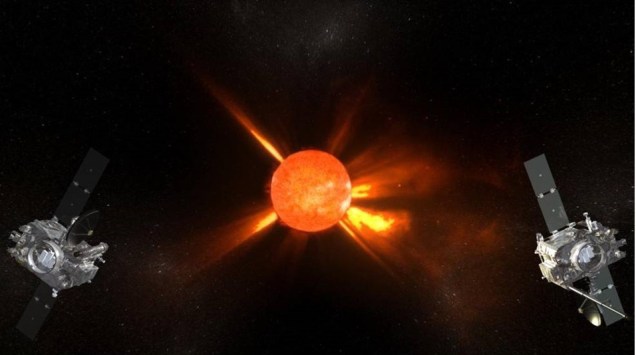
Coronal mass ejections (CMEs), also known as solar storms, are huge clouds of solar material, made up of plasma and magnetic field, emitted from the Sun. If these storms reach the Earth, they can cause geomagnetic storms with severe consequences, such as widespread long-term power-cuts (Canon et al., 2013). Therefore, it’s important to learn as much as we can about the nature and evolution of these storms, to accurately predict if and when they will hit the Earth, and how damaging they will be if they do.

For these reasons, the Solar Stormwatch project was created; a citizen science project where volunteers identify and track CMEs in remote-sensing images of space. The original project, jointly created by the Zooniverse and the Royal Observatory Greenwich, asked participants to complete six different activities, and proved very popular. More than 16,000 citizen scientists took part, resulting in seven scientific publications. Based on the success of this, a new version has been created, Solar Stormwatch II, to continue the effort to improve CME forecasts.

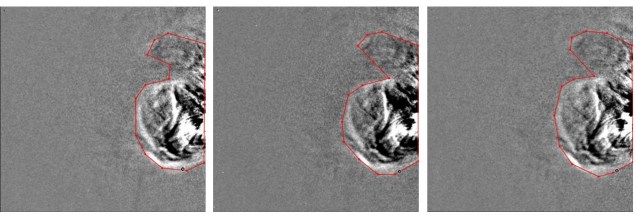
In Solar Stormwatch II, volunteers complete an activity called ‘Storm Front’, characterising CMEs in images from the heliospheric imagers (HI) on board NASA’s twin STEREO spacecraft in orbit around the Sun. These imagers take wide-angle images looking from the Sun out into space, and CMEs propagate outwards from the Sun through the field of view. To make the motion of each storm clearer, we show volunteers running difference images, where each image has the previous image subtracted, so only the differences remain. Figure 4 shows example plain and running-difference images for comparison. Each participant is shown three consecutive running-difference images of a CME, and draws around the storm fronts they see in each image, as shown in Figure 5.

This is a subjective task, and we don’t expect that everyone will draw storm fronts in exactly the same place. Even two experts might disagree, and these differences could lead to big differences in results (De Koning, 2017). Therefore, we ask 30 people to draw around every storm front, which allows us to combine the observations, find the average location of the storm front, and calculate uncertainties from the distribution of the observations. This makes the dataset more objective and robust than if one expert had created it. Figure 6a shows the average storm fronts and uncertainties found using this method for an example image.
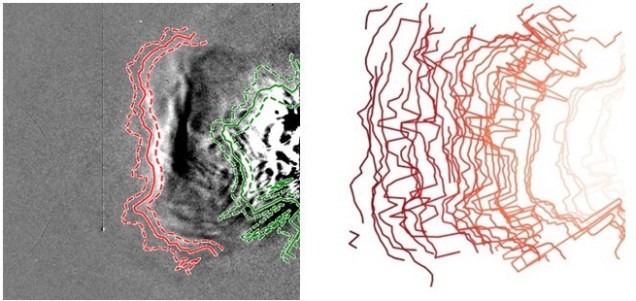
Typically, researchers only track CME propagation along one slice of each image (Sheeley Jr. et al., 1999); Storm Front allows the whole CME front to be analysed in an unprecedented level of detail (Barnard et al., 2017). This extra detail will allow us to examine how the shape of the CME is distorted as it propagates through the HI field of view (see Figure 6b). Savani et al. (2010) looked at one CME and found that the solar wind, the constant stream of solar material which the Sun emits into space, could explain how the CME shape was distorted; we intend to use the dataset created though Solar Stormwatch II for a statistical comparison between CME distortions and solar wind conditions.

At the time of writing, over 3,000 volunteers have taken part in Solar Stormwatch II, resulting in nearly 60,000 classifications. However, only 30% of the dataset has been completed, so we still need more volunteers. If you’d like to join the effort, please visit www.solarstormwatch.com and help finish the dataset!
References
· Barnard et al. 2017 doi:10.1002/2017SW001609
· Canon et al. 2013 doi:1/903496/96/9
· De Koning 2017 doi: 10.3847/1538-4357/aa7a09
· Savani et al. 2010 doi:10.1088/2041-8205/714/1/L128
· Sheeley Jr. et al. 1999 doi:10.1029/1999JA900308

3 thoughts on “The Solar Stormwatch Citizen Science Project”