Extra conference funding: how to apply and where to look

Shannon Jones – s.jones2@pgr.reading.ac.uk

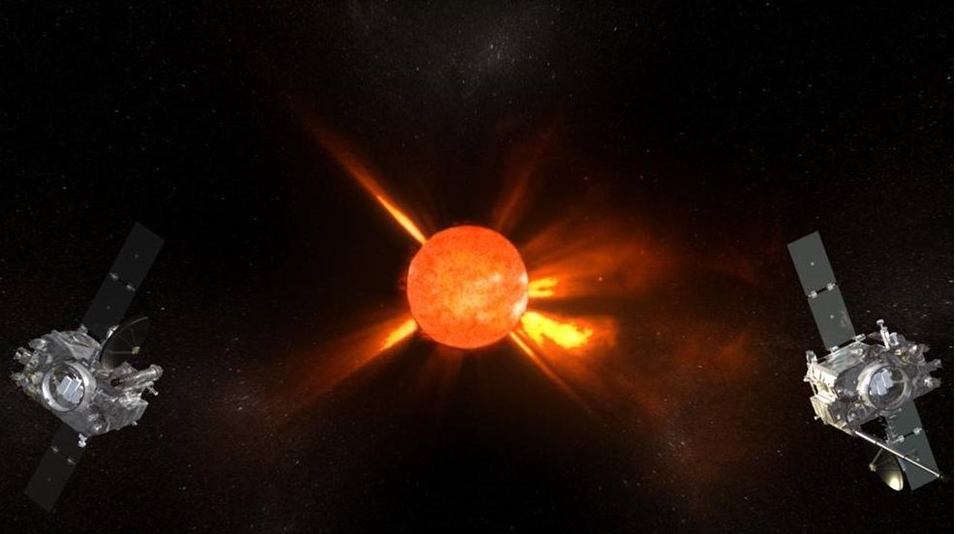
The current PhD travel budget of £2000 doesn’t go far, especially if you have your eye on attending the AGU Fall Meeting in San Francisco. If the world ever goes back to normal (and fingers crossed it will – though hopefully with more greener travel options, and remote participation in shorter conferences?) you might wonder how you are ever going to afford the conferences your supervisors suggest. Luckily, there are many ways you can supplement your budget. Receiving travel grants not only means more conferences (and more travel!), but it also looks great on your CV. In this blog post I share what I have learnt about applying for conference grants and list the main places to apply.

Sources of funding include…

Graduate School Travel Support Scheme

  • Open to 2nd and 3rd year PhD students at the university (or equivalent year if part-time) 
  • 1 payment per student of up to £200 
  • Usually 3 deadlines throughout the year 

There are two schemes open to all PhD students who are members of the IOP (any PhD student who has a degree in physics or a related subject can apply to become a member)

Research Student Conference Fund

  • Unlimited payments until you have received £300 in total
  • 4 deadlines throughout the year: 1st March, 1st June, 1st September and 1st December 
  • Note: you apply for funding from an IOP group, and the conference must be relevant to the group. For example, most meteorology PhD students would apply for conference funding from the Environmental Physics group. You get to choose which groups to join when you become an IOP member. 

CR Barber Trust

  • 1 payment per student of £100-£300 for an international conference depending on the conference location 
  • Apply anytime as long as there is more than a month before the proposed conference 

Legacies Fund

Conference/Meeting Travel Subsistence

From the conference organiser

  • Finally, many conferences offer their own student support, so it’s always worth checking the conference website to see 
  • Both EGU and AGU offer grants to attend their meetings each year 

Application Tips

Apply early!!!

Many of these schemes take months to let you know whether you have been successful. Becoming a member can also take a while, especially when societies only approve new members at certain times of the year. So, it’s good to talk to your supervisor and make a conference plan early on in your PhD, so you know when to apply. 

Writing your application

Generally, these organisations are keen to give away their funds, you just have to write a good enough application. Keep it simple and short: remember the person reading the application is very unlikely to be an expert in your research. It can be helpful to ask someone who isn’t a scientist (or doesn’t know your work well) to read it and highlight anything that doesn’t make sense to them. 

Estimating your conference expenses

You are usually expected to provide a breakdown of the conference costs with every application. The main costs to account for are: 

  • Accommodation: for non-UK stays must apply for a quote through the university travel agent 
  • Travel: UK train tickets over £100 and all international travel must be booked by university too 
  • Subsistence: i.e. food! University rules used to say this could be a maximum of £30 per day – check current guidelines 
  • Conference Fees: the conference website will usually list this 

The total cost will depend on where the conference is. You are generally expected to choose cheaper options, but there is some flexibility. As a rough guide: a 4-day conference within the UK cost me around £400 (in 2019) and a 5-night stay in San Francisco to attend AGU cost me around £2200 (in 2019).  

Reading PhD students at Union Square, San Francisco for AGU! 

Good luck! Feel free to drop me an email at s.jones2@pgr.reading.ac.uk if you have any questions 😊 

The visual complexity of coronal mass ejections follows the solar cycle

Shannon Jones – s.jones2@pgr.reading.ac.uk

Coronal Mass Ejections (CMEs), or solar storms, are huge eruptions of particles and magnetic field from the Sun. With the help of 4,028 citizen scientists, my supervisors and I have just published a paper, showing that the appearance of CMEs changes over the solar cycle, with CMEs appearing more visually complex towards solar maximum.

We created a Zooniverse citizen science project in collaboration with the UK Science Museum called ‘Protect our planet from solar storms’, where we showed pairs of images of CMEs from the Heliospheric (wide-angle white-light) Imagers on board the twin STEREO spacecraft, and asked participants to decide whether the left or right CME looked most complicated, or complex (Jones et al. 2020)  We used these data to rank 1,110 CMEs in order of their relative visual complexity, by fitting a Bradley-Terry model. This is a statistical model widely used by psychologists to rank items by human preference. Figure 1 shows three example storms from across the ranking (see figshare for an animation with all CMEs). When we asked the citizen scientists how they chose the most complex CME, they described complex CMEs as “big”, “messy” and “bright” with complicated “waves”, “patterns” and “shading”.

Figure 1. Example images showing three example CMEs in ranked order of subjective complexity increasing from low (left-hand image) through to high (right-hand image).

Figure 2 shows the relative complexity of all 1,110 CMEs, with CMEs observed by STEREO-A shown by pink dots, and CMEs observed by STEREO-B shown by blue dots. The lower panel shows the daily sunspot number over the same time period, using data from SILSO World Data Center. This shows that the annual average complexity values follow the solar cycle, and that the average complexity of CMEs observed by STEREO-B is consistently lower that the complexity of CMEs observed by STEREO-A. This might be due to slight differences between the imagers: STEREO-B is affected by pointing errors, which might blur smaller-scale features within the images.

Figure 2. Top panel: relative complexity of every CME in the ranking plotted against time. Pink points represent STEREO-A images, while blue points represent STEREO-B images. Annual means and standard deviations are over plotted for STEREO-A (red dashed line) and STEREO-B (blue dashed line) CMEs. Bottom panel: Daily total sunspot number from SILSO shown in yellow, with annual means over plotted (orange dashed line).

If a huge CME were to hit Earth, there could be serious consequences such as long-term power cuts and satellite damage. Many of these impacts could be reduced if we had adequate warning that a CME was going to hit. Our results suggest that there is some predictability in the structure of CMEs, which may help to improve future space weather forecasts.

We plan to continue our research and quantitatively determine which CME characteristics are associated with visual complexity. We also intend to investigate what is causing the CMEs to appear differently. Possible causes include: the complexity of the magnetic field at the CME source region on the Sun; the structure of the solar wind the CME passes through; or multiple CMEs merging, causing a CME to look more complex.

Please see the paper for more details, or email me at s.jones2@pgr.reading.ac.uk if you have any questions!

Jones, S. R., C. J. Scott, L. A. Barnard, R. Highfield, C. J. Lintott and E. Baeten (2020): The visual complexity of coronal mass ejections follows the solar cycle. Space Weather, https://doi.org/10.1029/2020SW002556.

The Solar Stormwatch Citizen Science Project

Coronal mass ejections (CMEs), also known as solar storms, are huge clouds of solar material, made up of plasma and magnetic field, emitted from the Sun. If these storms reach the Earth, they can cause geomagnetic storms with severe consequences, such as widespread long-term power-cuts (Canon et al., 2013). Therefore, it’s important to learn as much as we can about the nature and evolution of these storms, to accurately predict if and when they will hit the Earth, and how damaging they will be if they do.

Slide1
Figure 1: A coronal mass ejection leaving the Sun (Credit: NASA)

For these reasons, the Solar Stormwatch project was created; a citizen science project where volunteers identify and track CMEs in remote-sensing images of space. The original project, jointly created by the Zooniverse and the Royal Observatory Greenwich, asked participants to complete six different activities, and proved very popular. More than 16,000 citizen scientists took part, resulting in seven scientific publications. Based on the success of this, a new version has been created, Solar Stormwatch II, to continue the effort to improve CME forecasts.

Slide2
Figure 2: A screenshot of the Solar Stormwatch II interface (www.solarstormwatch.com)

In Solar Stormwatch II, volunteers complete an activity called ‘Storm Front’, characterising CMEs in images from the heliospheric imagers (HI) on board NASA’s twin STEREO spacecraft in orbit around the Sun. These imagers take wide-angle images looking from the Sun out into space, and CMEs propagate outwards from the Sun through the field of view. To make the motion of each storm clearer, we show volunteers running difference images, where each image has the previous image subtracted, so only the differences remain. Figure 4 shows example plain and running-difference images for comparison. Each participant is shown three consecutive running-difference images of a CME, and draws around the storm fronts they see in each image, as shown in Figure 5.

Slide3
Figure 3: An illustration of the twin STEREO spacecraft in orbit around the Sun. (Credit: NASA)

Slide4
Figure 4a: An example of a running-difference image of a CME. 4b: An example image taken by the heliospheric imagers.

Slide5
Figure 5: An example set of three consecutive running-difference images of a CME, with storm fronts traced in red.

This is a subjective task, and we don’t expect that everyone will draw storm fronts in exactly the same place. Even two experts might disagree, and these differences could lead to big differences in results (De Koning, 2017). Therefore, we ask 30 people to draw around every storm front, which allows us to combine the observations, find the average location of the storm front, and calculate uncertainties from the distribution of the observations. This makes the dataset more objective and robust than if one expert had created it. Figure 6a shows the average storm fronts and uncertainties found using this method for an example image.

Slide6
Figure 6a: A differenced HI image with the average storm fronts and uncertainties superimposed. 6b: The average storm fronts for one CME, changing from light to dark red over time, as the CME travels through the field of view.

Typically, researchers only track CME propagation along one slice of each image (Sheeley Jr. et al., 1999); Storm Front allows the whole CME front to be analysed in an unprecedented level of detail (Barnard et al., 2017). This extra detail will allow us to examine how the shape of the CME is distorted as it propagates through the HI field of view (see Figure 6b). Savani et al. (2010) looked at one CME and found that the solar wind, the constant stream of solar material which the Sun emits into space, could explain how the CME shape was distorted; we intend to use the dataset created though Solar Stormwatch II for a statistical comparison between CME distortions and solar wind conditions.

Slide7
Figure 7: Sign up at www.solarstormwatch.com

At the time of writing, over 3,000 volunteers have taken part in Solar Stormwatch II, resulting in nearly 60,000 classifications. However, only 30% of the dataset has been completed, so we still need more volunteers. If you’d like to join the effort, please visit www.solarstormwatch.com and help finish the dataset!

References
· Barnard et al. 2017 doi:10.1002/2017SW001609
· Canon et al. 2013 doi:1/903496/96/9
· De Koning 2017 doi: 10.3847/1538-4357/aa7a09
· Savani et al. 2010 doi:10.1088/2041-8205/714/1/L128
· Sheeley Jr. et al. 1999 doi:10.1029/1999JA900308