Kieran Pope – k.n.pope@pgr.reading.ac.uk
Convective self-aggregation is the process by which initially randomly scattered convection becomes spontaneously clustered in space despite uniform initial conditions. This process was first identified in numerical models, however it is relevant to real world convection (Holloway et al., 2017). Tropical weather is dominated by convection, and the degree of convective aggregation has important consequences for weather and climate. A more organised regime is associated with reduced cloudiness, increased longwave emission to space (Bretherton et al., 2005), and a higher frequency of long-lasting extreme precipitation events (Bao and Sherwood, 2019).
Because of its relevance to weather and climate, self-aggregation has been the focus of many recent studies. However, there is still much debate as to the processes that cause aggregation. There is great variability in the rate and degree of aggregation between models, and there remains uncertainty as to how aggregation is affected by climate change (Wing et al., 2020). Previous studies have shown that feedbacks between convection and shortwave & longwave radiation are key drivers and maintainers of aggregation (e.g. Wing & Cronin 2016), and that interactive radiation in models is essential for aggregation to occur (Muller & Bony 2015).
This blog summarises results from the first paper from my PhD (Pope et al., 2021), where we develop and use a framework to analyse how radiative interactions with different cloud types contribute to aggregation. We analyse self-aggregation within a set of three idealised simulations of the UK Met Office Unified Model (UM). The simulations are configured in radiative-convective equilibrium over three fixed sea surface temperatures (SSTs) of 295, 300 and 305 K. They are convection permitting models that are 432 × 6048 km2 in size with a 3 km horizontal grid spacing. The simulations neglect the earth’s rotation, so they approximately represent convection over tropical oceans within a warming climate.
Our analysis framework is based on that used in Wing and Emanuel (2014) which uses the variance of vertically-integrated frozen moist static energy (FMSE) as a measure of aggregation. FMSE is a measure of the total energy an air parcel has if all the water (vapour and frozen) was converted to liquid, neglecting its velocity. Variations in vertically-integrated FMSE come from perturbations in temperature and humidity. As aggregation increases, moist regions get moister and dry regions get drier, so the variance of vertically-integrated FMSE increases.
The problem with using FMSE variance as an aggregation metric is that it is highly sensitive to SST. A warmer atmosphere can hold more water vapour via the Clausius-Clapeyron relationship. This means there is a greater difference in FMSE between the moist and dry regions for higher-SST simulations, so the variance of FMSE is typically much greater for higher SSTs. To account for this problem, we normalise FMSE between hypothetical upper and lower limits which are functions of SST. This gives a value of normalised FMSE between 0 and 1.
Wing and Emanuel (2014) derive a budget equation for the rate of change of FMSE variance which shows how different processes contribute to aggregation. By rederiving their equation for normalised FMSE , we get:
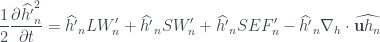
where 


Figure 1: Hovmöller plots of normalised FMSE for each SST 
Figure 2: (a) Time series of vertically-integrated FMSE variance, (b) Time series of normalised vertically-integrated FMSE variance for each SST
We use the variance of

To understand the processes contributing to aggregation, we have to look to Equation 1. We mainly focus on the two radiative terms on the right hand side. The terms show that regions in which the radiative anomalies and the 


The sensitivity of the budget terms to both aggregation and SST can be seen in Figure 4. This figure is made by creating 50 bins of

In general, we find the longwave term is the dominant driver of aggregation, being insensitive to SST during the growth phase of aggregation. Once the aggregation is mature, the longwave term remains the dominant maintainer of aggregation, however its contribution to aggregation maintenance decreases with SST. The shortwave term is initially small at early times but becomes a key maintainer of aggregation within highly-aggregated environments. This is because humidity variations are initially small, so there is little variation in shortwave heating. Once the convection is aggregated, moist regions are very moist and dry regions are very dry, so there is a large difference in shortwave heating between moist and dry regions. The variations in shortwave heating remain very similar with SST, meaning shortwave heating anomalies contribute the same amount to non-normalised
To understand the behaviour of the longwave term, we define different cloud types based on the vertical profile of cloud, assigning one cloud type per grid box in a similar way to Hill et al. (2018). We define a lower and upper level pressure threshold, assigning cloud below the lower threshold to a “Low” category, cloud above the upper threshold to a “High” category, and cloud in between to a “Mid” category. If cloud occurs in more than one of these layers, then it is assigned to a combined category. In total, there are eight cloud types: Clear, Low, Mid, Mid & Low, High, High & Low, High & Mid, and Deep. We can then find each cloud type’s contribution to the longwave term by multiplying the cloud’s mean [Equation] covariance by its domain fraction.
To see how the cloud type contributions change with aggregation, we define a Growth phase and Mature phase of aggregation. The Growth phase has 


We find that longwave interactions with high-topped clouds and clear regions drive aggregation during the Growth phase (Figure 5a). This is because high clouds are abundant, have positive longwave heating anomalies and occur in moist, high
There is great variability in the degrees of aggregation within numerical models, which has important consequences for weather and climate modelling (Wing et al. 2020). With cloud-radiation interactions being crucial for aggregation, understanding how these interactions vary between models may help to explain the differences in aggregation. This study provides a framework by which a comparison of cloud-radiation interactions and their contributions to convective self-aggregation between models and SSTs can be achieved.
Page Break
REFERENCES
Bao, J., & Sherwood, S. C. (2019). The role of convective self-aggregation in extreme instantaneous versus daily precipitation. Journal of Advances in Modeling Earth Systems, 11(1), 19– 33. https://doi.org/10.1029/2018MS001503
Bretherton, C. S., Blossey, P. N., & Khairoutdinov, M. (2005). An energy-balance analysis of deep convective self-aggregation above uniform SST. Journal of the Atmospheric Sciences, 62(12), 4273– 4292. https://doi.org/10.1175/JAS3614.1
Hill, P. G., Allan, R. P., Chiu, J. C., Bodas-Salcedo, A., & Knippertz, P. (2018). Quantifying the contribution of different cloud types to the radiation budget in Southern West Africa. Journal of Climate, 31(13), 5273– 5291. https://doi.org/10.1175/JCLI-D-17-0586.1
Holloway, C. E., Wing, A. A., Bony, S., Muller, C., Masunaga, H., L’Ecuyer, T. S., & Zuidema, P. (2017). Observing convective aggregation. Surveys in Geophysics, 38(6), 1199– 1236. https://doi.org/10.1007/s10712-017-9419-1
Muller, C., & Bony, S. (2015). What favors convective aggregation and why? Geophysical Research Letters, 42(13), 5626– 5634. https://doi.org/10.1002/2015GL064260
Pope, K. N., Holloway, C. E., Jones, T. R., & Stein, T. H. M. (2021). Cloud-radiation interactions and their contributions to convective self-aggregation. Journal of Advances in Modeling Earth Systems, 13, e2021MS002535. https://doi.org/10.1029/2021MS002535
Wing, A. A., & Cronin, T. W. (2016). Self-aggregation of convection in long channel geometry. Quarterly Journal of the Royal Meteorological Society, 142(694), 1– 15. https://doi.org/10.1002/qj.2628
Wing, A. A., & Emanuel, K. A. (2014). Physical mechanisms controlling self-aggregation of convection in idealized numerical modeling simulations. Journal of Advances in Modeling Earth Systems, 6(1), 59– 74. https://doi.org/10.1002/2013MS000269
Wing, A. A., Stauffer, C. L., Becker, T., Reed, K. A., Ahn, M.-S., Arnold, N., & Silvers, L. (2020). Clouds and convective self-aggregation in a multi-model ensemble of radiative-convective equilibrium simulations. Journal of Advances in Modeling Earth Systems, 12(9), e2020MS0021380. https://doi.org/10.1029/2020MS0021380
