Daniel Ayers – d.ayers@pgr.reading.ac.uk
The Met Office Climate Data Challenge 2022 was a two day virtual hackathon-style event where participants hacked solutions to challenges set by Aon (Wikipedia: “a British-American multinational professional services firm that sells a range of financial risk-mitigation products, including insurance, pension administration, and health-insurance plans”) and the Ministry of Justice (MoJ). Participants heralded from the Met Office and the universities of Reading, Bristol, Oxford, Exeter, Leeds and UCL. Here’s how I found the experience and what I got out of it.
If your PhD experience is anything like mine, you feel pretty busy. In particular, there are multitudinous ways one can engage in not-directly-your-research activities, such as being part of the panto or other social groups, going to seminars, organising seminars, going to conferences, etc. Obviously these can all make a positive contribution to your experience – and seminars are often very useful – but my point is: it can sometimes feel like there are too few periods of uninterrupted time to focus deeply on actually doing your research.
So: was it worth investing two precious days into a hackathon? Definitely. The tl;dr is: I got to work with interesting people, I got an experience of working on a commercial style project (very short deadline for the entire process from raw data to delivered product), and I got an insight into the reinsurance industry. I’ll expand on these points in a bit.
Before the main event, the four available challenges were sent out a few weeks in advance. There was a 2hr pre-event meeting the week beforehand. In this pre-meeting, the challenges were formally introduced by representatives from Aon and MoJ, and all the participants split into groups to a) discuss ideas for challenge solutions and b) form teams for the main event. It really would have helped to have done a little bit of individual brainstorming and useful-material reading before this meeting.
As it happened, I didn’t prepare any further than reading through the challenges, but this was useful. I had time to think about what I thought I could bring to each challenge, and vaguely what might be involved in solutions to each challenge. I concluded that the most appropriate challenge for me was an Aon challenge about determining how much climate change was likely to impact insurance companies through changes to the things insurance companies insure (as opposed to, for example, the frequency or intensity of extreme weather events which might cause payouts to be required). In the pre-meeting, someone else presented an idea that lined up with what I wanted to do: model some change in earth and human systems and use this to create new exposure data sets (for exposure data set, read “list of things the insurance companies insure for, and how much a full payout will cost”). This was a lofty ambition, as I will explain. Regardless, I signed up to this team and I was all set for the main two-day event.
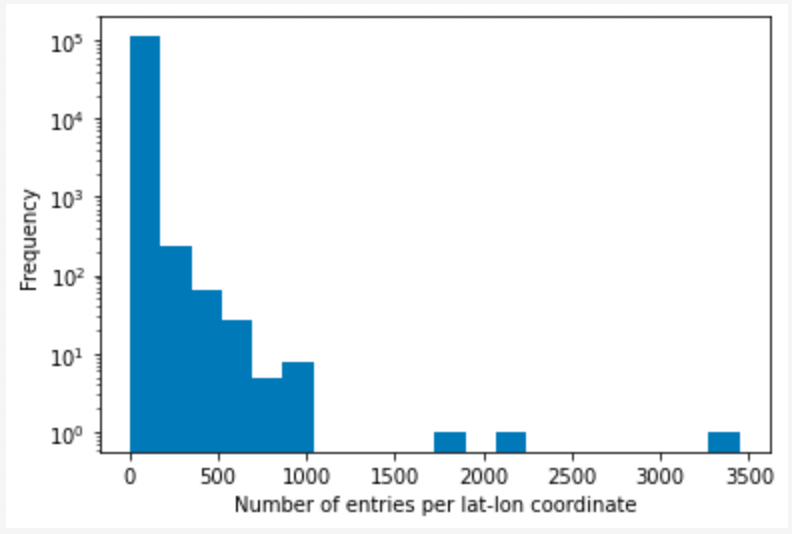
Here are some examples of plots that helped us to understand the exposure data set. We were told, for example, that for some countries, a token lat-lon coordinate was used for all entries in that country. This resulted in some lat-lon coords being used with comparatively high frequency, despite the entries potentially describing large or distinct areas of land.
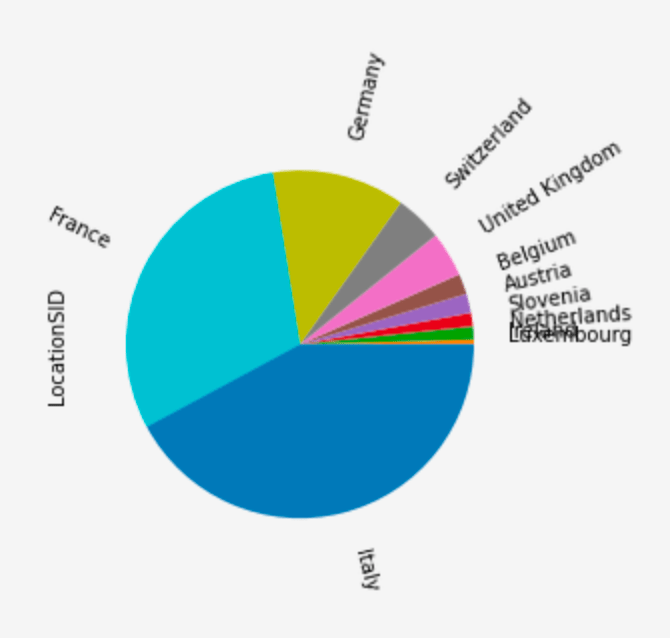
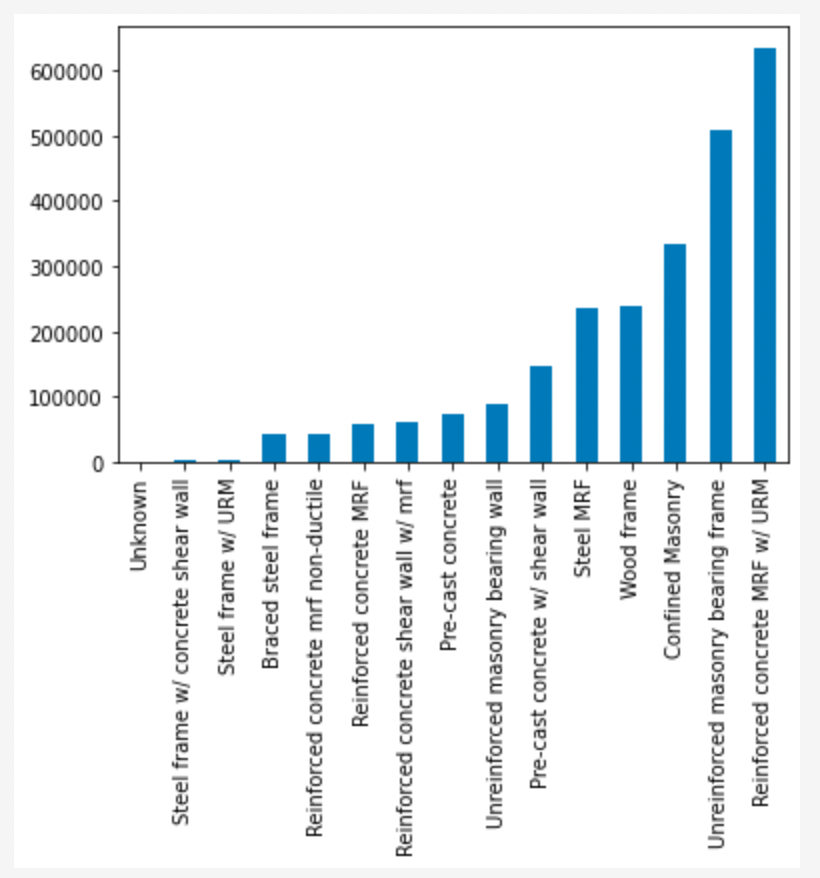
The next two plots show the breakdown of the entries by country, and then by construction type. Each entry is for a particular set of buildings. When modelling the likely payout following an event (e.g. a large storm) it is useful to know how the buildings are made.
One thing I want to mention, in case the reader is involved with creating a hackathon at any point, is the importance of challenge preparation. The key thing is that participants need to be able to hit the ground running in the event itself. Two things are key to this being possible.
First, the challenge material should ideally provide a really good description of the problem space. In our case, we spent half of the first day in a meeting with the (very helpful) people from Aon, picking their brains about how the reinsurance industry worked, what they really cared about, what would count as an answer to this question, what was in the mysterious data set we had been given and how should the data be interpreted. Yes, this was a great opportunity to learn and have a discussion with someone I would ordinarily never meet, but my team could have spent more precious hackathon hours making a solution if the challenge material had done a better job of explaining what was going on.
Second, any resources that are provided (in our case, a big exposure data set – see above), need to be ready to use. In our case, only one person in some other team had been sent the data set, it wasn’t available before the main event started, there was no metadata, and once I managed to get hold of it I had to spend 2-3 hours working out which encoding to use and how to deal with poorly-separated lines in the .csv file. So, to all you hackathon organisers out there: test the resources you provide, and check they can be used quickly and easily.
By the end of the second day, we’d not really got our envisioned product working. I’d managed to get the data open at last, and done some data exploration plots, so at least we had a better idea of what we were playing with. My team mates had found some really useful data for population change, and for determining if a location in our data set was urban or rural. They had also set up a slack group so that we could collaborate and discuss the different aspects of the problem, and a GitHub repo so we could share our progress (we coded everything in Python, mainly using Jupyter notebooks). We’d also done a fair amount of talking with the experts from Aon, and amongst ourselves as a team, to work out what was viable. This was a key experience from the event: coming up with a minimal viable product. The lesson from this experience was: be ok with cutting a lot of big corners. This is particularly useful for me as a PhD student, where it can be tempting to think I have time to go really deep into optimising and learning about everything required. My hackathon experience showed how much can be achieved even when the time frame forces most corners to be cut.
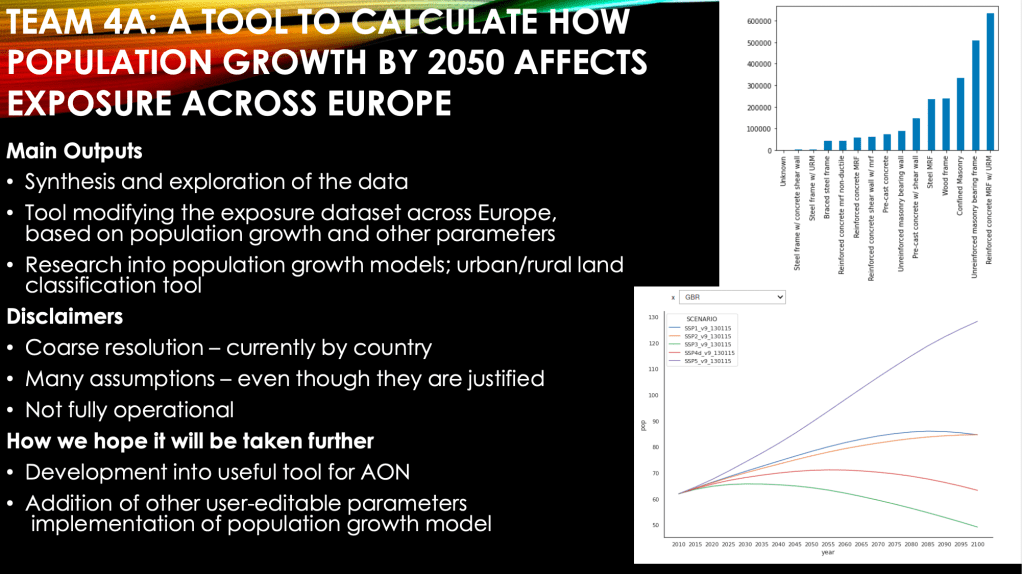
To give an example of cutting corners, think about how many processes in the human-earth system might have an effect over the next 30 years on what things there are to insure, where they are, and how much they cost. Population increase, urbanisation and ruralisation, displacement from areas of rising water levels or increased flooding risk, construction materials being more expensive in order to be more environmentally friendly, immigration, etc. Now, how many of these could we account for in a simplistic model that we wanted to build in two days? Answer: not many! Given we spent the first day understanding the problem and the data, we only really had one day, or 09:45 – 15:30, so 5 hours and 45 minutes, to build our solution. We attempted to account for differences in population growth by country, by shared socio-economic pathway, and by a parameterised rural-urban movement. As I said, we didn’t get the code working by the deadline, and ended up presenting our vision, rather than a demonstration of our finished solution.
There might be an opportunity to do more work on this project. A few of the projects from previous years’ hackathons have resulted in publications, and we are meeting shortly to see whether there is the appetite to do the same with what we’ve done. It would certainly be nice to create a more polished piece of work. That said, preserving space for my own research is also important!
As a final word on the hackathon: it was great fun, and I really enjoyed working with my team. PhD work can be a little isolated at times, so the opportunity to work with others was enjoyable and motivating. Hopefully, next time it will be in person. I would recommend others to get involved in future Met Office Climate Data Challenges!