WesCon 2023: From Unexpected Radiosondes to Experimental Forecasts

Adam Gainford – a.gainford@pgr.reading.ac.uk

Summer might seem like a distant memory at this stage, with the “exact date of snow” drawing ever closer and Mariah Carey’s Christmas desires broadcasting to unsuspecting shoppers across the country. But cast your minds back four-to-six months and you may remember a warmer and generally sunnier time, filled with barbeques, bucket hats, and even the occasional Met Ball. You might also remember that, weather-wise, summer 2023 was one of the more anomalous summers we have experienced in the UK. This summer saw 11% more rainfall recorded than the 1991-2020 average, despite June being dominated by hot, dry weather. In fact, June 2023 was also the warmest June on record and yet temperatures across the summer turned out to be largely average. 

Despite being a bit of an unsettled summer, these mixed conditions provided the perfect opportunity to study a notoriously unpredictable type of weather: convection. Convection is often much more difficult to accurately forecast compared to larger-scale features, even using models which can now explicitly resolve these events. As a crude analogy, consider a pot of bubbling water which has brought to the boil on a kitchen hob. As the amount of heat being delivered to the water increases, we can probably make some reasonable estimates of the number of bubbles we should expect to see on the surface of the water (none initially, but slowly increasing in number as the temperature of the water approaches the boiling point). But we would likely struggle if we tried to predict exactly where those bubbles might appear. 

This is where the WesCon (Wessex Convection) field campaign comes in. WesCon participants spent the entire summer operating radars, launching radiosondes, monitoring weather stations, analysing forecasts, piloting drones, and even taking to the skies — all in an effort to better understand convection and its representation within forecast models. It was a huge undertaking, and I was fortunate enough to be a small part of it. 

In this blog I discuss two of the ways in which I was involved: launching radiosondes from the University of Reading Atmospheric Observatory and evaluating the performance of models at the Met Office Summer Testbed.

Radiosonde Launches and Wiggly Profiles

A core part of WesCon was frequent radiosonde launches from sites across the south and south-west of the UK. Over 300 individual sondes were launched in total, with each one requiring a team of two to three people to calibrate the sonde, record station measurements and fill balloons with helium. Those are the easy parts – the hard part is making sure your radiosonde gets off the ground in one piece.

You can see in the picture below that the observatory is surrounded by sharp fences and monitoring equipment which can be tricky to avoid, especially during gusty conditions. In the rare occurrences when the balloon experienced “rapid unplanned disassembly”, we had to scramble to prepare a new one so as not to delay the recordings by too long.
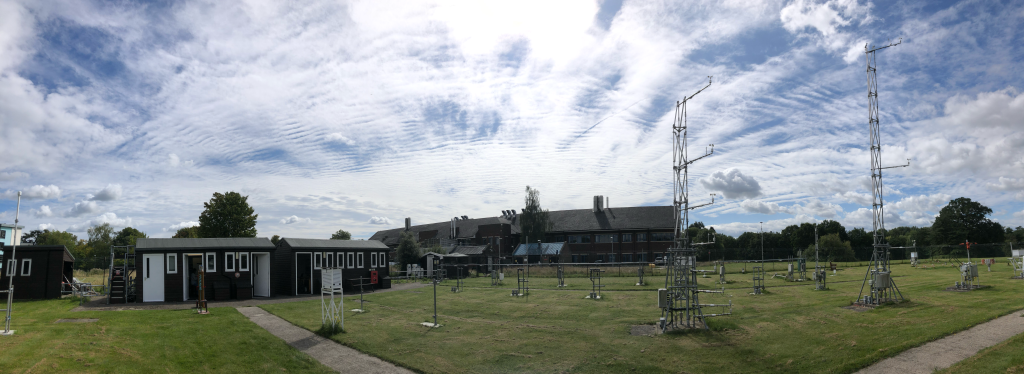
The University of Reading Atmospheric Observatory, overlooked by some mid-level cloud streets. 

After a few launches, however, the procedure becomes routine. Then you can start taking a cursory look at the data being sent back to the receiving station.

During the two weeks I was involved with launching radiosondes, there were numerous instances of elevated convection, which were a particular priority for the campaign given the headaches these cause for modellers. Elevated convection is where the ascending airmass originates from somewhere above the boundary layer, such as on a frontal boundary. We may therefore expect profiles of elevated convection to include a temperature inversion of some kind, which would prevent surface airmasses from ascending above the boundary layer. 

However, what we certainly did not expect to see were radiosondes appearing to oscillate with height (see my crude screenshot below). 
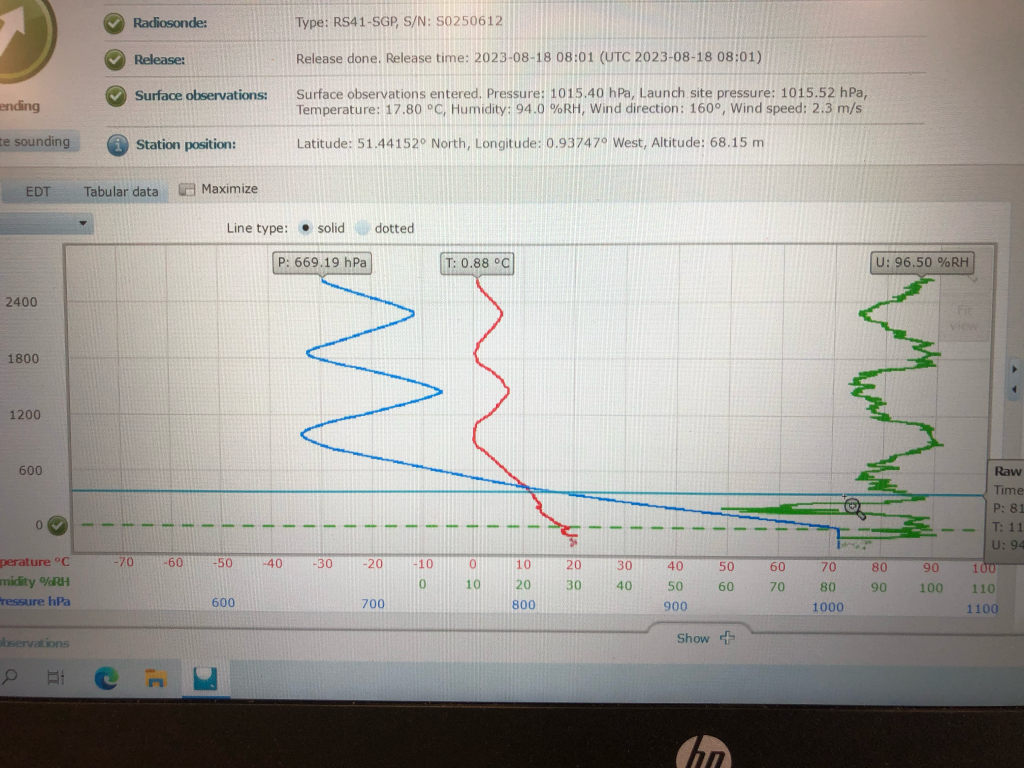
“The wiggler”! Oscillating radiosondes observed during elevated convection events.

Cue the excited discussions trying to explain what we were seeing. Sensor malfunction? Strong downdraughts? Not quite. 

Notice that the peak of each oscillation occurs almost exactly at 0°C. Surely that can’t be coincidental! Turns out these “wiggly” radiosondes have been observed before, albeit infrequently, and is attributed to snow building up on the surface of the balloon, weighing it down. As the balloon sinks and returns to above-freezing temperatures, the accumulated snow gradually melts and departs the balloon, allowing it to rise back up to the freezing level and accumulate more snow, and so on. 

That sounds reasonable enough. So why, then, do we see this oscillating behaviour so infrequently? One of the reasons discovered was purely technical. 

If you would like to read more about these events, a paper is currently being prepared by Stephen Burt, Caleb Miller and Brian Lo. Check back on the blog for further updates!
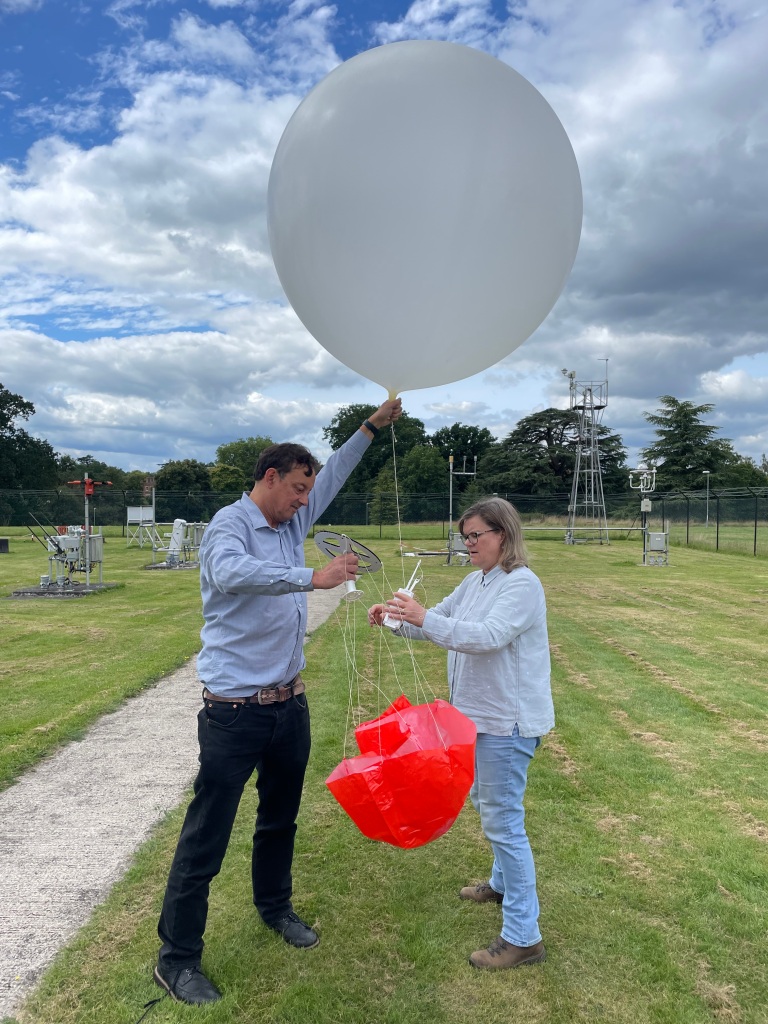
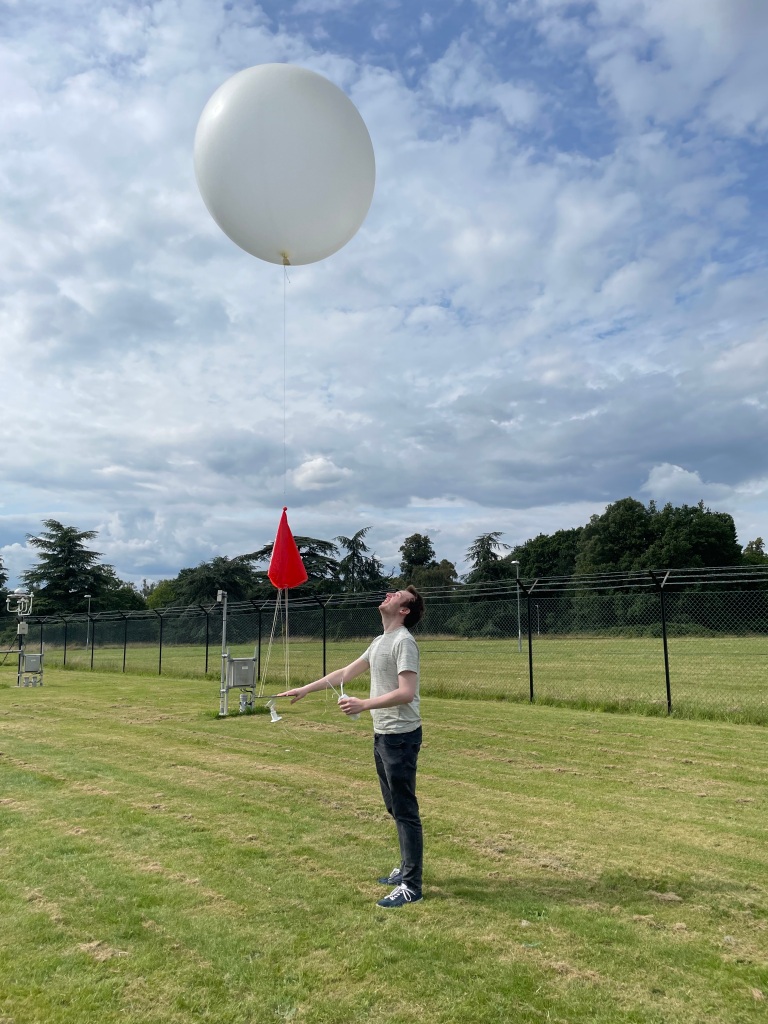
Humphrey Lean, Eme Dean-Lewis (left) and myself (right) ready to launch a sonde.

Met Office Summer Testbed

While not strictly a part of WesCon, this summer’s Met Office testbed was closely connected to the themes of the field campaign, and features plenty of collaboration. 

Testbeds are an opportunity for operational meteorologists, researchers, academics, and even students to evaluate forecast outputs and provide feedback on particular model issues. This year’s testbed was focussed on two main themes: convection and ensembles. These are both high priority areas for development in the Met Office, and the testbed provides a chance to get a broader, more subjective evaluation of these issues.
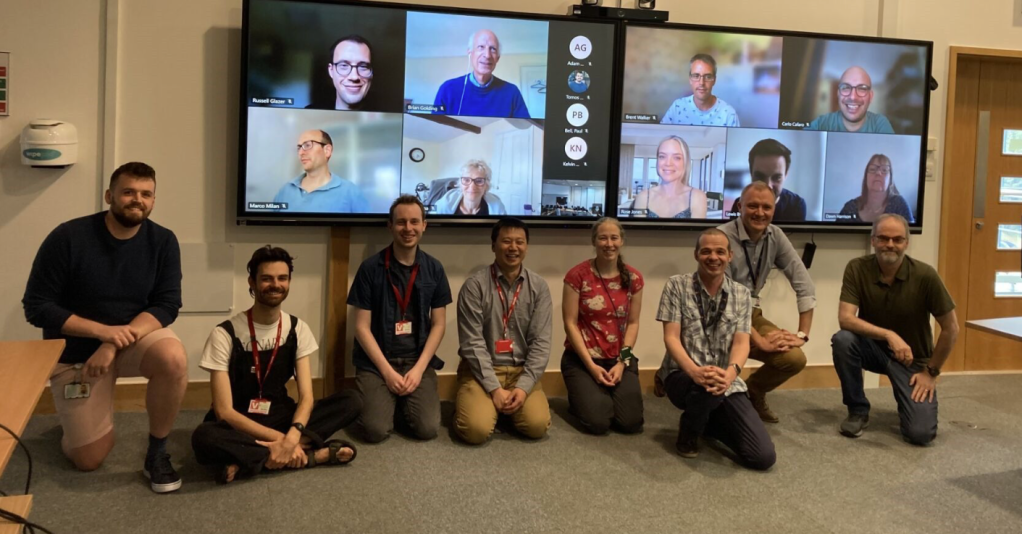
Group photo of the week 2 testbed participants.

Each day was structured into six sets of activities. Firstly, we were divided into three groups to perform a “Forecast Denial Experiment”, whereby each group is given access to a limited set of data and asked to issue a forecast for later in the day. One group only had access to the deterministic UKV model outputs, another group only had access to the MOGREPS-UK high-resolution ensemble output, and the third group has access to both datasets. The idea was to test whether ensemble outputs provide added value and accuracy to forecasts of impactful weather compared to just deterministic outputs. Each group was led by one or two operational meteorologists who navigated the data and, generally, provided most of the guidance. Personally, I found it immensely useful to shadow the op-mets as they made their forecasts, and came away with a much better understanding of the processes which goes into issuing a forecast.

After lunch, we would begin the ensemble evaluation activity which focussed on subjectively evaluating the spread of solutions in the high-resolution MOGREPS-UK ensemble. Improving ensemble spread is one of the major priorities for model development; currently, the members of high-resolution ensembles tend to diverge from the control member too slowly, leading to overconfident forecasts. It was particularly interesting to compare the spread results from MOGREPS-UK with the global MOGREPS-G ensemble and to try to understand the situations when the UK ensemble seemed to resemble a downscaled version of the global model. Next, we would evaluate three surface water flooding products, all combining ensemble data with other surface and impact libraries to produce flooding risk maps. Despite being driven by the same underlying model outputs, it was surprising how much each model differed in the case studies we looked at. 

Finally, we would end the day by evaluating the WMV (Wessex Model Variable) 300 m test ensemble, run over the greater Bristol area over this summer for research purposes. Also driven by MOGREPS-UK, this ensemble would often pick out convective structure which MOGREPS-UK was too coarse to resolve, but also tended to overdo the intensities. It was also very interesting to see the objective metrics suggested that WMV had much worse spread than MOGREPS-UK over the same area, a surprising result which didn’t align with my own interpretation of model performance.

Overall, the testbed was a great opportunity to learn more about how forecasts are issued and to get a deeper intuition for how to interpret model outputs. As researchers, it’s easy to look at model outputs as just abstract data, which is there to be verified and scrutinised, forgetting the impacts that it can have on the people experiencing it. While it was an admittedly exhausting couple of weeks, I would highly recommend more students take part in future testbeds!

Tiger Teams: Using Machine Learning to Improve Urban Heat Wave Predictions

Adam Gainford a.gainford@pgr.reading.ac.uk

Brian Lobrian.lo@pgr.reading.ac.uk

Flynn Ames – f.ames@pgr.reading.ac.uk

Hannah Croad – h.croad@pgr.reading.ac.uk  

Ieuan Higgs  – i.higgs@pgr.reading.ac.uk

What is Tiger Teams?  

You may have heard the term Tiger Teams mentioned around the department by some PhD students, in a SCENARIO DTP weekly update email or even in the department’s pantomime. But what exactly is a tiger team? It is believed the term was coined in a 1964 Aerospace Reliability and Maintainability Conference paper to describe “a team of undomesticated and uninhibited technical specialists, selected for their experience, energy, and imagination, and assigned to track down relentlessly every possible source of failure in a spacecraft subsystem or simulation”.  

This sounds like a perfect team activity for a group of PhD students, although our project had less to do with hunting for flaws in spacecraft subsystems or simulations. Translating the original definition of a tiger team into the SCENARIO DTP activity, “Tiger Teams” is an opportunity for teams of PhD students to apply our skills to real-world challenges supplied by industrial partners.   

The project culminated in a visit to the Met Office to present our work.

Why did we sign up to Tiger Teams?  

In addition to a convincing pitch by our SCENARIO director, we thought that collaborating on a project in an unfamiliar area would be a great way to learn new skills from each other. The cross pollination of ideas and methods would not just be beneficial for our project, it may even help us with our individual PhD work.  

More generally, Tiger Teams was an opportunity to do something slightly different connected to research. Brainstorming ideas together for a specific real-life problem, maintaining a code repository as a group and giving team presentations were not the average experiences one could have as a PhD student. Even when, by chance, we get to collaborate with others, is it ever that different to our PhD? The sight of the same problems …. in the same area of work …everyday …. for months on end, can certainly get tiring. Dedicating one day per week on an unrelated, short-term project which will be completed within a few months helps to break the monotony of the mid-stage PhD blues. This is also much more indicative of how research is conducted in industry, where problems are solved collaboratively, and researchers with different talents are involved in multiple projects at once.

What did we do in this round’s Tiger Teams?  

One project was offered for this round of Tiger Teams: “Crowdsourced Data for Machine Learning Prediction of Urban Heat Wave Temperatures”. The bones of this project started during a machine learning hackathon at the Met Office and was later turned into a Tiger Teams proposal. Essentially, this project aimed to develop a machine learning model which would use amateur observations from the Met Offices Weather Observation Website (WOW), combined with landcover data, to fine-tune model outputs onto higher resolution grids.   

Having various backgrounds from environmental science, meteorology, physics and computer science, we were well equipped to carry out tasks formulated to predict urban heat wave temperatures. Some of the main components included:  

  • Quality control of data – as well as being more spatially dense, amateur observation stations are also more unreliable  
  • Feature selection – which inputs should we select to develop our ML models  
  • Error estimation and visualisation – How do we best assess and visualise the model performance  
  • Spatial predictions – Developing the tools to turn numerical weather prediction model outputs and high resolution landcover data into spatial temperature maps.  

Our supervisor for the project, Lewis Blunn, also provided many of the core ingredients to get this project to work, from retrieving and processing NWP data for our models, to developing a novel method for quantifying upstream land cover to be included in our machine learning models. 

An example of the spatial maps which our ML models can generate. Some key features of London are clearly visible, including the Thames and both Heathrow runways.

What were the deliverables?  

For most projects in industry, the team agrees with the customer (the industrial partner) on end-products to be produced before the conclusion of the project. Our two main deliverables were to (i) develop machine learning models that would predict urban heatwave temperatures across London and (ii) a presentation on our findings at the Met Office headquarters.  

By the end of the project, we had achieved both deliverables. Not only was our seminar at the Met Office attended by more than 120 staff, we also exchanged ideas with scientists from the Informatics Lab and briefly toured around the Met Office HQ and its operational centre. The models we developed as a team are in a shared Git repository, although we admit that we could still add a little more documentation for future development.  

As a bonus deliverable, our supervisor (and us) are consolidating our findings into a publishable paper. This is certainly a good deal considering our team effort in the past few months. Stay tuned for results from our paper perhaps in a future blog post!  

Met Office Climate Data Challenge 2022

Daniel Ayers – d.ayers@pgr.reading.ac.uk  

The Met Office Climate Data Challenge 2022 was a two day virtual hackathon-style event where participants hacked solutions to challenges set by Aon (Wikipedia: “a British-American multinational professional services firm that sells a range of financial risk-mitigation products, including insurance, pension administration, and health-insurance plans”) and the Ministry of Justice (MoJ). Participants heralded from the Met Office and the universities of Reading, Bristol, Oxford, Exeter, Leeds and UCL. Here’s how I found the experience and what I got out of it. 

If your PhD experience is anything like mine, you feel pretty busy. In particular, there are multitudinous ways one can engage in not-directly-your-research activities, such as being part of the panto or other social groups, going to seminars, organising seminars, going to conferences, etc. Obviously these can all make a positive contribution to your experience – and seminars are often very useful – but my point is: it can sometimes feel like there are too few periods of uninterrupted time to focus deeply on actually doing your research. 

Fig. 1: There are many ways to be distracted from actually doing your research. 

So: was it worth investing two precious days into a hackathon? Definitely. The tl;dr is: I got to work with interesting people, I got an experience of working on a commercial style project (very short deadline for the entire process from raw data to delivered product), and I got an insight into the reinsurance industry. I’ll expand on these points in a bit. 

Before the main event, the four available challenges were sent out a few weeks in advance. There was a 2hr pre-event meeting the week beforehand. In this pre-meeting, the challenges were formally introduced by representatives from Aon and MoJ, and all the participants split into groups to a) discuss ideas for challenge solutions and b) form teams for the main event. It really would have helped to have done a little bit of individual brainstorming and useful-material reading before this meeting.  

As it happened, I didn’t prepare any further than reading through the challenges, but this was useful. I had time to think about what I thought I could bring to each challenge, and vaguely what might be involved in solutions to each challenge. I concluded that the most appropriate challenge for me was an Aon challenge about determining how much climate change was likely to impact insurance companies through changes to the things insurance companies insure (as opposed to, for example, the frequency or intensity of extreme weather events which might cause payouts to be required). In the pre-meeting, someone else presented an idea that lined up with what I wanted to do: model some change in earth and human systems and use this to create new exposure data sets (for exposure data set, read “list of things the insurance companies insure for, and how much a full payout will cost”). This was a lofty ambition, as I will explain. Regardless, I signed up to this team and I was all set for the main two-day event. 

Here are some examples of plots that helped us to understand the exposure data set. We were told, for example, that for some countries, a token lat-lon coordinate was used for all entries in that country. This resulted in some lat-lon coords being used with comparatively high frequency, despite the entries potentially describing large or distinct areas of land.  

The next two plots show the breakdown of the entries by country, and then by construction type. Each entry is for a particular set of buildings. When modelling the likely payout following an event (e.g. a large storm) it is useful to know how the buildings are made. 

One thing I want to mention, in case the reader is involved with creating a hackathon at any point, is the importance of challenge preparation. The key thing is that participants need to be able to hit the ground running in the event itself. Two things are key to this being possible.  

First, the challenge material should ideally provide a really good description of the problem space. In our case, we spent half of the first day in a meeting with the (very helpful) people from Aon, picking their brains about how the reinsurance industry worked, what they really cared about, what would count as an answer to this question, what was in the mysterious data set we had been given and how should the data be interpreted. Yes, this was a great opportunity to learn and have a discussion with someone I would ordinarily never meet, but my team could have spent more precious hackathon hours making a solution if the challenge material had done a better job of explaining what was going on.  

Second, any resources that are provided (in our case, a big exposure data set – see above), need to be ready to use. In our case, only one person in some other team had been sent the data set, it wasn’t available before the main event started, there was no metadata, and once I managed to get hold of it I had to spend 2-3 hours working out which encoding to use and how to deal with poorly-separated lines in the .csv file. So, to all you hackathon organisers out there: test the resources you provide, and check they can be used quickly and easily.  

By the end of the second day, we’d not really got our envisioned product working. I’d managed to get the data open at last, and done some data exploration plots, so at least we had a better idea of what we were playing with. My team mates had found some really useful data for population change, and for determining if a location in our data set was urban or rural. They had also set up a slack group so that we could collaborate and discuss the different aspects of the problem, and a GitHub repo so we could share our progress (we coded everything in Python, mainly using Jupyter notebooks). We’d also done a fair amount of talking with the experts from Aon, and amongst ourselves as a team, to work out what was viable. This was a key experience from the event: coming up with a minimal viable product. The lesson from this experience was: be ok with cutting a lot of big corners. This is particularly useful for me as a PhD student, where it can be tempting to think I have time to go really deep into optimising and learning about everything required. My hackathon experience showed how much can be achieved even when the time frame forces most corners to be cut. 

To give an example of cutting corners, think about how many processes in the human-earth system might have an effect over the next 30 years on what things there are to insure, where they are, and how much they cost. Population increase, urbanisation and ruralisation, displacement from areas of rising water levels or increased flooding risk, construction materials being more expensive in order to be more environmentally friendly, immigration, etc. Now, how many of these could we account for in a simplistic model that we wanted to build in two days? Answer: not many! Given we spent the first day understanding the problem and the data, we only really had one day, or 09:45 – 15:30, so 5 hours and 45 minutes, to build our solution. We attempted to account for differences in population growth by country, by shared socio-economic pathway, and by a parameterised rural-urban movement. As I said, we didn’t get the code working by the deadline, and ended up presenting our vision, rather than a demonstration of our finished solution. 

There might be an opportunity to do more work on this project. A few of the projects from previous years’ hackathons have resulted in publications, and we are meeting shortly to see whether there is the appetite to do the same with what we’ve done. It would certainly be nice to create a more polished piece of work. That said, preserving space for my own research is also important! 

As a final word on the hackathon: it was great fun, and I really enjoyed working with my team.  PhD work can be a little isolated at times, so the opportunity to work with others was enjoyable and motivating. Hopefully, next time it will be in person. I would recommend others to get involved in future Met Office Climate Data Challenges! 

On relocating to the Met Office for five weeks of my PhD

Some PhD projects are co-organised by an industrial CASE partner which provides supervisory support and additional funding. As part of my CASE partnership with the UK Met Office, in January I had the opportunity to spend 5 weeks at the Exeter HQ, which proved to be a fruitful experience. As three out of my four supervisors are based there, it was certainly a convenient set-up to seek their expertise on certain aspects of my PhD project!

One part of my project aims to understand how certain neighbourhood-based verification methods can affect the level of surface air quality forecast accuracy. Routine verification of a forecast model against observations is necessary to provide the most accurate forecast possible. Ensuring that this happens is crucial, as a good forecast may help keep the public aware of potential adverse health risks resulting from elevated pollutant concentrations.

The project deals with two sides of one coin: evaluating forecasts of regional surface pollutant concentrations; and evaluating those of meteorological fields such as wind speed, precipitation, relative humidity or temperature. All of the above have unique characteristics: they vary in resolution, spatial scale, homogeneity, randomness… The behaviour of the weather and pollutant variables is also tricky to compare against one another because the locations of their numerous measurement sites nearly never coincide, whereas the forecast encompasses the entirety of the domain space. This is kind of the crux of this part of my PhD: how can we use these irregularly located measurements to our advantage in verifying the skill of the forecast in the most useful way? And – zooming out still – can we determine the extent to which the surface air pollution forecast is dependent on some of those aforementioned weather variables? And can this knowledge (once acquired!) be used to further improve the pollution forecast?

IMG_4407
Side view of the UK Met Office on a cold day in February.

While at the Met Office, I began my research specifically into methods which analyse the forecast skill when a model “neighbourhood” of a particular size around a particular point-observation is evaluated. These methods are being developed as part of a toolkit for evaluation of high resolution forecasts, which can be (and usually are) more accurate than a lower resolution equivalent, but traditional metrics (e.g. root mean square error (RMSE) or mean error (ME)) often fail to demonstrate the improvement (Mittermaier, 2014). They can also fall victim to various verification errors such as the double-penalty problem. This is when an ‘event’ might have been missed at a particular time in the forecast at one gridpoint because it was actually forecast in the neighbouring grid-point one time-step out, so the RMSE counts this error both in the spatial and temporal axes. Not fair, if you ask me. So as NWP continues to increase in resolution, there is a need for robust verification methods which relax the spatial (or temporal) restriction on precise forecast-to-observation matching somewhat (Ebert, 2008).

One way to proceed forward is via a ‘neighbourhood’ approach which treats a deterministic forecast almost as an ensemble by considering all the grid-points around an observation as an individual forecast and formulating a probabilistic score. Neighbourhoods are made of varying number of model grid-points, i.e. a 3×3 or a 5×5 or even bigger. A skill score such as the ranked probability score (RPS) or Brier Score is calculated using the cumulative probability distribution across the neighbourhood of the exceedance of a sensible pollutant concentration threshold. So, for example, we can ask what proportion of a 5×5 neighbourhood around an observation has correctly forecasted an observed exceedance (i.e. ‘hit’)? What if an exceedance forecast has been made, but the observed quantity didn’t reach that magnitude (i.e. ‘false alarm’)? And how do these scores change when larger (or smaller) neighbourhoods are considered? And, if these spatial verification methods prove informative, how could they be implemented in operational air quality forecast verification? All these questions will hopefully have some answers in the near future and form a part of my PhD thesis!

Although these kind of methods have been used for meteorological variables, they haven’t yet been widely researched in the context of regional air quality forecasts. The verification framework for this is called HiRA – High Resolution Assessment, which is part of the wider verification network Model Evaluation Tools (which, considering it is being developed as a means of uniformly assessing high-resolution meteorological forecasts, has the most unhelpful acronym: MET). It is quite an exciting opportunity to be involved in the testing and evaluation of this new set of verification tools for a surface pollution forecast at a regional scale, and I am very grateful to be involved in this. Also, having the opportunity to work at the Met Office and “pretend” to be a real research scientist for a while is awesome!

Email: k.m.milczewska@pgr.reading.ac.uk

Evaluating aerosol forecasts in London

Email: e.l.warren@pgr.reading.ac.uk

Aerosols in urban areas can greatly impact visibility, radiation budgets and our health (Chen et al., 2015). Aerosols make up the liquid and solid particles in the air that, alongside noxious gases like nitrogen dioxide, are the pollution in cities that we often hear about on the news – breaking safety limits in cities across the globe from London to Beijing. Air quality researchers try to monitor and predict aerosols, to inform local councils so they can plan and reduce local emissions.

Figure 1: Smog over London (Evening Standard, 2016).

Recently, large numbers of LiDARs (Light Detection and Ranging) have been deployed across Europe, and elsewhere – in part to observe aerosols. They effectively shoot beams of light into the atmosphere, which reflect off atmospheric constituents like aerosols. From each beam, many measurements of reflectance are taken very quickly over time – and as light travels further with more time, an entire profile of reflectance can be constructed. As the penetration of light into the atmosphere decreases with distance, the reflected light is usually commonly called attenuated backscatter (β). In urban areas, measurements away from the surface like these are sorely needed (Barlow, 2014), so these instruments could be extremely useful. When it comes to predicting aerosols, numerical weather prediction (NWP) models are increasingly being considered as an option. However, the models themselves are very computationally expensive to run so they tend to only have a simple representation of aerosol. For example, for explicitly resolved aerosol, the Met Office UKV model (1.5 km) just has a dry mass of aerosol [kg kg-1] (Clark et al., 2008). That’s all. It gets transported around by the model dynamics, but any other aerosol characteristics, from size to number, need to be parameterised from the mass, to limit computation costs. However, how do we know if the estimates of aerosol from the model are actually correct? A direct comparison between NWP aerosol and β is not possible because fundamentally, they are different variables – so to bridge the gap, a forward operator is needed.

In my PhD I helped develop such a forward operator (aerFO, Warren et al., 2018). It’s a model that takes aerosol mass (and relative humidity) from NWP model output, and estimates what the attenuated backscatter would be as a result (βm). From this, βm could be directly compared to βo and the NWP aerosol output evaluated (e.g. see if the aerosol is too high or low). The aerFO was also made to be computationally cheap and flexible, so if you had more information than just the mass, the aerFO would be able to use it!

Among the aerFO’s several uses (Warren et al., 2018, n.d.), was the evaluation of NWP model output. Figure 2 shows the aerFO in action with a comparison between βm and observed attenuated backscatter (βo) measured at 905 nm from a ceilometer (a type of LiDAR) on 14th April 2015 at Marylebone Road in London. βm was far too high in the morning on this day. We found that the original scheme the UKV used to parameterise the urban surface effects in London was leading to a persistent cold bias in the morning. The cold bias would lead to a high relative humidity, so consequently the aerFO condensed more water than necessary, onto the aerosol particles as a result, causing them to swell up too much. As a result, bigger particles mean bigger βm and an overestimation. Not only was the relative humidity too high, the boundary layer in the NWP model was developing too late in the day as well. Normally, when the surface warms up enough, convection starts, which acts to mix aerosol up in the boundary layer and dilute it near the surface. However, the cold bias delayed this boundary layer development, so the aerosol concentration near the surface remained high for too long. More mass led to the aerFO parameterising larger sizes and total numbers of particles, so overestimated βm. This cold bias effect was reflected across several cases using the old scheme but was notably smaller for cases using a newer urban surface scheme called MORUSES (Met Office – Reading Urban Surface Exchange Scheme). One of the main aims for MORUSES was to improve the representation of energy transfer in urban areas, and at least to us it seemed like it was doing a better job!

Figure 2: Vertical profiles of attenuated backscatter [m−1 sr−1] (log scale) that are (a, g) observed (βo) with estimated mixing layer height (red crosses, Kotthaus and Grimmond,2018) and (b, h) forward modelled (βm) using the aerFO (section 2).(c, i) Attenuated backscatter difference (βm – βo) calculated using the hourly βm vertical profile and the vertical profile of βo nearest in time; (d, j) aerosol mass mixing ratio (m) [μg kg−1]; (e, k) relative humidity (RH) [%] and (f, l) air temperature (T) [°C] at MR on 14th April 2015.

References

Barlow, J.F., 2014. Progress in observing and modelling the urban boundary layer. Urban Clim. 10, 216–240. https://doi.org/10.1016/j.uclim.2014.03.011

Chen, C.H., Chan, C.C., Chen, B.Y., Cheng, T.J., Leon Guo, Y., 2015. Effects of particulate air pollution and ozone on lung function in non-asthmatic children. Environ. Res. 137, 40–48. https://doi.org/10.1016/j.envres.2014.11.021

Clark, P.A., Harcourt, S.A., Macpherson, B., Mathison, C.T., Cusack, S., Naylor, M., 2008. Prediction of visibility and aerosol within the operational Met Office Unified Model. I: Model formulation and variational assimilation. Q. J. R. Meteorol. Soc. 134, 1801–1816. https://doi.org/10.1002/qj.318

Warren, E., Charlton-Perez, C., Kotthaus, S., Lean, H., Ballard, S., Hopkin, E., Grimmond, S., 2018. Evaluation of forward-modelled attenuated backscatter using an urban ceilometer network in London under clear-sky conditions. Atmos. Environ. 191, 532–547. https://doi.org/10.1016/j.atmosenv.2018.04.045

Warren, E., Charlton-Perez, C., Kotthaus, S., Marenco, F., Ryder, C., Johnson, B., Lean, H., Ballard, S., Grimmond, S., n.d. Observed aerosol characteristics to improve forward-modelled attenuated backscatter. Atmos. Environ. Submitted


Quantifying the skill of convection-permitting ensemble forecasts for the sea-breeze occurrence

Email: carlo.cafaro@pgr.reading.ac.uk

On the afternoon of 16th August 2004, the village of Boscastle on the north coast of Cornwall was severely damaged by flooding (Golding et al., 2005). This is one example of high impact hazardous weather associated with small meso- and convective-scale weather phenomena, the prediction of which can be uncertain even a few hours ahead (Lorenz, 1969; Hohenegger and Schar, 2007). Taking advantage of the increased computer power (e.g. https://www.metoffice.gov.uk/research/technology/supercomputer) this has motivated many operational and research forecasting centres to introduce convection-permitting ensemble prediction systems (CP-EPSs), in order to give timely weather warnings of severe weather.

However, despite being an exciting new forecasting technology, CP-EPSs place a heavy burden on the computational resources of forecasting centres. They are usually run on limited areas with initial and boundary conditions provided by global lower resolution ensembles (LR-EPS). They also produce large amounts of data which needs to be rapidly digested and utilized by operational forecasters. Assessing whether the convective-scale ensemble is likely to provide useful additional information is key to successful real-time utilisation of this data. Similarly, knowing where equivalent information can be gained (even if partially) from LR-EPS using statistical/dynamical post-processing both extends lead time (due to faster production time) and also potentially provides information in regions where no convective-scale ensemble is available.

There have been many studies on the verification of CP-EPSs (Klasa et al., 2018, Hagelin et al., 2017, Barret et al., 2016, Beck et al., 2016 amongst the others), but none of them has dealt with the quantification of the skill gained by CP-EPSs in comparison with LR-EPSs, when fully exploited, for specific weather phenomena and for a long enough evaluation period.

In my PhD, I have focused on the sea-breeze phenomenon for different reasons:

  1. Sea breezes have an impact on air quality by advecting pollutants, on heat stress by providing a relief on hot days and also on convection by providing a trigger, especially when interacting with other mesoscale flows (see for examples figure 1 or figures 6, 7 in Golding et al., 2005).
  2. Sea breezes occur on small spatio-temporal scales which are properly resolved at convection-permitting resolutions, but their occurrence is still influenced by synoptic-scale conditions, which are resolved by the global LR-EPS.

Blog_Figure1
Figure 1: MODIS visible of the southeast of Italy on 6th June 2018, 1020 UTC. This shows thunderstorms occurring in the middle of the peninsula, probably triggered by sea-breezes.
Source: worldview.earthdata.nasa.gov

Therefore this study aims to investigate whether the sea breeze is predictable by only knowing a few predictors or whether the better representation of fine-scale structures (e.g. orography, topography) by the CP-EPS implies a better sea-breeze prediction.

In order to estimate probabilistic forecasts from both the models, two different methods have been applied. A novel tracking algorithm for the identification of sea-breeze front, in the domain represented in figure 2, was applied to CP-EPSs data. A Bayesian model was used instead to estimate the probability of sea-breeze conditioned on two LR-EPSs predictors and trained on CP-EPSs data. More details can be found in Cafaro et al. (2018).

Cafaro_Fig2
Figure 2: A map showing the orography over the south UK domain. Orography data are from MOGREPS-UK. The solid box encloses the sub-domain used in this study with red dots indicating the location of synoptic weather stations. Source: Cafaro et al. (2018)

The results of the probabilistic verification are shown in figure 3. Reliability (REL) and resolution (RES) terms have been computed decomposing the Brier score (BS) and Information gain (IGN) score. Finally, scores differences (BSD and IG) have been computed to quantify any gain in the skill by the CP-EPS. Figure 3 shows that CP-EPS forecast is significantly more skilful than the Bayesian forecast. Nevertheless, the Bayesian forecast has more resolution than a climatological forecast (figure 3e,f), which has no resolution by construction.

Cafaro_Fig11
Figure 3: (a)-(d) Reliability and resolution terms calculated for both the forecasts (green for the CP-EPS forecast and blue for LR-EPSs). (e) and (f) represent the Brier score difference (BSD) and Information gain (IG) respectively. Error bars represent the 95th confidence interval. Positive values of BSD and IG indicate that CP-EPS forecast is more skilful. Source: Cafaro et al. (2018)

This study shows the additional skill provided by the Met Office convection-permitting ensemble forecast for the sea-breeze prediction. The ability of CP-EPSs to resolve meso-scale dynamical features is thus proven to be important and only two large-scale predictors, relevant for the sea-breeze, are not sufficient for skilful prediction.

It is believed that both the methodologies can, in principle, be applied to other locations of the world and it is thus hoped they could be used operationally.

References:

Barrett, A. I., Gray, S. L., Kirshbaum, D. J., Roberts, N. M., Schultz, D. M., and Fairman J. G. (2016). The utility of convection-permitting ensembles for the prediction of stationary convective bands. Monthly Weather Review, 144(3):1093–1114, doi: 10.1175/MWR-D-15-0148.1

Beck,  J., Bouttier, F., Wiegand, L., Gebhardt, C., Eagle, C., and Roberts, N. (2016). Development and verification of two convection-allowing multi-model ensembles over Western europe. Quarterly Journal of the Royal Meteorological Society, 142(700):2808–2826, doi: 10.1002/qj.2870

Cafaro C., Frame T. H. A., Methven J., Roberts N. and Broecker J. (2018), The added value of convection-permitting ensemble forecasts of sea breeze compared to a Bayesian forecast driven by the global ensemble, Quarterly Journal of the Royal Meteorological Society., under review.

Golding, B. , Clark, P. and May, B. (2005), The Boscastle flood: Meteorological analysis of the conditions leading to flooding on 16 August 2004. Weather, 60: 230-235, doi: 10.1256/wea.71.05

Hagelin, S., Son, J., Swinbank, R., McCabe, A., Roberts, N., and Tennant, W. (2017). The Met Office convective-scale ensemble, MOGREPS-UK. Quarterly Journal of the Royal Meteorological Society, 143(708):2846–2861, doi: 10.1002/qj.3135

Hohenegger, C. and Schar, C. (2007). Atmospheric predictability at synoptic versus cloud-resolving scales. Bulletin of the American Meteorological Society, 88(11):1783–1794, doi: 10.1175/BAMS-88-11-1783

Klasa, C., Arpagaus, M., Walser, A., and Wernli, H. (2018). An evaluation of the convection-permitting ensemble cosmo-e for three contrasting precipitation events in Switzerland. Quarterly Journal of the Royal Meteorological Society, 144(712):744–764, doi: 10.1002/qj.3245

Lorenz, E. N. (1969). Predictability of a flow which possesses many scales of motion.Tellus, 21:289 – 307, doi: 10.1111/j.2153-3490.1969.tb00444.x

The Role of the Cloud Radiative Effect in the Sensitivity of the Intertropical Convergence Zone to Convective Mixing

Email: j.f.talib@pgr.reading.ac.uk

Talib, J., S.J. Woolnough, N.P. Klingaman, and C.E. Holloway, 2018: The Role of the Cloud Radiative Effect in the Sensitivity of the Intertropical Convergence Zone to Convective Mixing. J. Climate, 31, 6821–6838, https://doi.org/10.1175/JCLI-D-17-0794.1

Rainfall in the tropics is commonly associated with the Intertropical Convergence Zone (ITCZ), a discontinuous line of convergence collocated at the ascending branch of the Hadley circulation, where strong moist convection leads to high rainfall. What controls the location and intensity of the ITCZ remains a fundamental question in climate science.

ensemble_precip_neat_thesis
Figure 1: Annual-mean, zonal-mean tropical precipitation (mm day-1) from Global Precipitation Climatology Project (GPCP, observations, solid black line) and CMIP5 (current coupled models) output. Dashed line indicates CMIP5 ensemble mean.

In current and previous generations of climate models, the ITCZ is too intense in the Southern Hemisphere, resulting in two annual-mean, zonal-mean tropical precipitation maxima, one in each hemisphere (Figure 1).  Even if we take the same atmospheric models and couple them to a world with only an ocean surface (aquaplanets) with prescribed sea surface temperatues (SSTs), different models simulate different ITCZs (Blackburn et al., 2013).

Within a climate model parameterisations are used to replace processes that are too small-scale or complex to be physically represented in the model. Parameterisation schemes are used to simulate a variety of processes including processes within the boundary layer, radiative fluxes and atmospheric chemistry. However my work, along with a plethora of others, shows that the representation of the ITCZ is sensitive to the convective parameterisation scheme (Figure 2a). The convective parameterisation scheme simulates the life cycle of clouds within a model grid-box.

Our method of showing that the simulated ITCZ is sensitive to the convective parameterisation scheme is by altering the convective mixing rate in prescribed-SST aquaplanet simulations. The convective mixing rate determines the amount of mixing a convective parcel has with the environmental air, therefore the greater the convective mixing rate, the quicker a convective parcel will become similar to the environmental air, given fixed convective parcel properties.

AEIprecipCREon
Figure 2: Zonal-mean, time-mean (a) precipitation rates (mm day-1}$) and (b) AEI (W m-2) in simulations where the convective mixing rate is varied.

In our study, the structure of the simulated ITCZ is sensitive to the convective mixing rate. Low convective mixing rates simulate a double ITCZ (two precipitation maxima, orange and red lines in Figure 2a), and high convective mixing rates simulate a single ITCZ (blue and black lines).

We then associate these ITCZ structures to the atmospheric energy input (AEI). The AEI is the amount of energy left in the atmosphere once considering the top of the atmosphere and surface energy budgets. We conclude, similar to Bischoff and Schneider, 2016, that when the AEI is positive (negative) at the equator, a single (double) ITCZ is simulated (Figure 2b). When the AEI is negative at the equator, energy is needed to be transported towards the equator for equilibrium. From a mean circulation perspective, this take place in a double ITCZ scenario (Figure 3). A positive AEI at the equator, is associated with poleward energy transport and a single ITCZ.

blog_figure_ITCZ_simulation
Figure 3: Schematic of a single (left) and double ITCZ (right). Blue arrows denote energy transport. In a single ITCZ scenario more energy is transported in the upper branches of the Hadley circulation, resulting in a net-poleward energy transport. In a double ITCZ scenario, more energy is transport equatorward than poleward at low latitudes, leading to an equatorward energy transport.

In our paper, we use this association between the AEI and ITCZ to hypothesize that without the cloud radiative effect (CRE), atmospheric heating due to cloud-radiation interactions, a double ITCZ will be simulated. We also hypothesize that prescribing the CRE will reduce the sensitivity of the ITCZ to convective mixing, as simulated AEI changes are predominately due to CRE changes.

In the rest of the paper we perform simulations with the CRE removed and prescribed to explore further the role of the CRE in the sensitivity of the ITCZ. We conclude that when removing the CRE a double ITCZ becomes more favourable and in both sets of simulations the ITCZ is less sensitive to convective mixing. The remaining sensitivity is associated with latent heat flux alterations.

My future work following this publication explores the role of coupling in the sensitivity of the ITCZ to the convective parameterisation scheme. Prescribing the SSTs implies an arbitary ocean heat transport, however in the real world the ocean heat transport is sensitive to the atmospheric circulation. Does this sensitivity between the ocean heat transport and atmospheric circulation affect the sensitivity of the ITCZ to convective mixing?

Thanks to my funders, SCENARIO NERC DTP, and supervisors for their support for this project.

References:

Blackburn, M. et al., (2013). The Aqua-planet Experiment (APE): Control SST simulation. J. Meteo. Soc. Japan. Ser. II, 91, 17–56.

Bischoff, T. and Schneider, T. (2016). The Equatorial Energy Balance, ITCZ Position, and Double-ITCZ Bifurcations. J. Climate., 29(8), 2997–3013, and Corrigendum, 29(19), 7167–7167.


Oceans in Weather and Climate Course 2018

email: r.frew@pgr.reading.ac.uk

Between the 11th-16th March myself and four other PhDs and post docs attended the Ocean in Weather and Climate (OiWC) course at the Met Office, Exeter. This NERC advanced training course was aimed at PhDs, postdocs and beyond. It provided a great opportunity to spend a week meeting other Oceanography researchers at varying stages of their career, and to expand your understanding of the oceans role in climate beyond the scope of your own work.

The week kicked off with an ice breaker where we had do some ‘Scientific speed dating’, chatting to other participants about: Where are you from? What do you work on? What is your main hobby? What is the biggest question in your field of research? This set the tone for a very interactive week full of interesting discussions between all attendees and speakers alike. Course participants were accommodated at The Globe Inn situated in Topsham, a cute village-sized town full of pastel-coloured houses, cosy pubs, art galleries, and beautiful riverside walks to stretch your legs in the evenings.

The days consisted of four 1.5 hour sessions, split up by caffeine and biscuit breaks to recharge before the next session.

Topics covered in the lecture-style talks included…

  • Dynamical Theory
  • Modelling the Ocean
  • Observations
  • Ocean-atmosphere coupling
  • Air-sea fluxes
  • High Resolution Ocean modelling in coupled forecast systems
  • The Meridional Overturning Circulation
  • The Southern Ocean in climate and climatic change
  • Climate variability on diurnal, seasonal, annual, inter-annual, decadal timescales
  • Climate extremes
  • Climate sensitivity, heat uptake and sea level.

OceanResolutionFigure
A recurring figure of the week…. taken from Helene Hewitt’s talk on high resolution ocean modelling showing ocean surface currents from HadGEM3-based global coupled models at different resolutions (eddy resolving, eddy permitting and eddy parameterised).


All the talks were very interesting and were followed by some stimulating discussion. Each session provided an overview of each topic and an indication of the current research questions in each area at the moment.

In the post lunch session, there were group practical sessions. These explored observational ARGO float data and model output. The practicals, written in iPython notebooks, were designed to let us play with some data, giving us a series of questions to trigger group discussions to deepen understanding of topics covered that morning.

The course also included some ‘softer’ evening talks, giving research career advice in a more informal manner. Most evenings were spent exploring the lovely riverside walks and restaurants/pubs of Topsham. The final evening was spent all together at the Cosy Club in Exeter, rounding off a very interesting and enjoyable week!