Email: c.p.webber@pgr.reading.ac.uk
Air pollution is a major global problem, with the World Health Organisation recently linking 1 in 8 global deaths to this invisible problem. I say invisible, what air pollution may seem is an almost invisible problem. My PhD looks at some of the largest air pollutants, particulate matter PM10, which is still only 1/5th the width of a human hair in diameter!
My project looks at whether winter (December – February) UK PM10 concentration ([PM10]) exceedance events will change in frequency or composition in a future climate. To answer this question, a state of the art climate model is required. This model simulates the atmosphere only and is an iteration of the Met-Office HADGEM3 model. The climate simulation models a future 2050 under the RCP8.5 emissions scenario, the highest greenhouse-gas emission scenario considered in IPCC-AR5 (Riahi et al., 2011).
In an attempt to model PM10 in the climate model (a complex feat, currently tasked to the coupled UKCA model), we have idealised the problem, making the results much easier to understand. We have emitted chemically inert tracers in the model, which represent the key sources of PM10 throughout mainland Europe and the UK. The source regions identified were: West Poland, Po Valley, BENELUX and the UK. While the modelled tracers were shown to replicate observed PM10 well, albeit with inevitable sources of lost variability, they were primarily used to identify synoptic flow regimes influencing the UK. The motivation of this work is to determine whether the flow regimes that influence the UK during UK PM10 episodes, change in a future climate.
As we are unable to accurately replicate observed UK [PM10] within the model, we need to generate a proxy for UK [PM10] episodes. We chose to identify the synoptic meteorological conditions (synoptic scale ~ 1000 km) that result in UK air pollution episodes. We find that the phenomenon of atmospheric blocking in the winter months, in the Northeast Atlantic/ European region, provide the perfect conditions for PM10 accumulation in the UK. In the Northern Hemisphere winter, Rossby Wave Breaking (RWB) is the predominant precursor to atmospheric blocking (Woollings et al., 2008). RWB is the meridional overturning of air masses in the upper troposphere, so that warm/cold air is advected towards the pole/equator. The diagnostic chosen to detect RWB on is potential temperature (θ) on the potential vorticity = 2 Potential vorticity units surface, otherwise termed the dynamical tropopause. The advantages of using this diagnostic for detecting RWB have been outlined in this study’s first publication; Webber et al., (2016). Figure 1 illustrates this mechanism and the metric used to diagnose RWB, BI, introduced by Pelly and Hoskins (2003).

In Fig. 1 warm air is transported to the north of cold air to the south. This mechanism generates an anticyclone to the north of the centre of overturning (black circle in Fig 1) and a cyclone to the south. If the anticyclone to north becomes quasi-stationary, a blocking anticyclone is formed, which has been shown to generate conditions favourable for the accumulation of PM10.
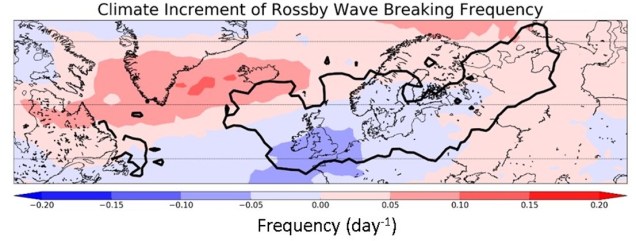
To determine whether there exists a change in RWB frequency, due to climate change (a climate increment), the difference in RWB frequency between two simulations must be taken. The first of these is a free-running present day simulation, which provides us with the models representation of a present day atmosphere. The second is a future time-slice simulation, representative of the year 2050. Figure 2 shows the difference between the two simulations, with positive values representing an increase in RWB frequency in a future climate. The black contoured region corresponds to the region where the occurrence of RWB significantly increases UK [PM10].
Climate shifts in flow regimes were analysed, however only for the most prominent subset of RWB events. RWB can be subset into cyclonic and anti-cyclonic RWB (CRWB and ACRWB respectively) and both have quite different impacts on UK [PM10] (Webber et al., 2016). ACRWB events are the most prominent RWB subset within the Northeast Atlantic/ European region (Weijenborg et al., 2012). Figure 1 represents ACRWB, with overturning occurring in a clockwise direction about the centre of overturning and these events were analysed for climate shifts in resultant flow regimes.
The analysis of climate flow regime shifts, provides the most interesting result of this study. We find that there exists a significant (p<0.05) increase in near European BENELUX tracer transport into the UK and a significant reduction of UK tracer accumulation, following ACRWB events. What we therefore see is that while in the future we see a reduction in the number of RWB and ACRWB events in a region most influential to UK [PM10], there also exists a robust shift in the resulting flow regime. Following ACRWB, there exists an increased tendency for the transport of European PM10 and decreased locally sourced [PM10] in the UK. Increased European transport may result in increased long-range transport of smaller and potentially more toxic (Gehring et al., 2013) PM2.5 particles from Europe.
References
Gehring, U., Gruzieva, O., Agius, R. M., Beelen, R., Custovic, A., Cyrys, J., Eeftens, M., Flexeder, C., Fuertes, E., Heinrich, J., Hoffmann, B., deJongste, J. C., Kerkhof, M., Klümper, C., Korek, M., Mölter, A., Schultz, E. S., Simpson, A.,Sugiri, D., Svartengren, M., von Berg, A., Wijga, A. H., Pershagen, G. and Brunekreef B.: Air Pollution Exposure and Lung Function in Children: The ESCAPE Project. Children’s Health Prespect, 121,
1357-1364, doi:10.1289/ehp.1306770 , 2013.
Pelly, J. L and Hoskins, B. J.: A New Perspective on Blocking. J. Atmos. Sci, 50, 743-755, doi: http://dx.doi.org/10.1175/1520- 0469(2003)060<0743:ANPOB>2.0.CO;2, 2003.
Riahi, K., Rao S., Krey, V., Cho, C., Chirkov, V., Fischer, G., Kindermann, G., Nakicenovic, N. and Rafaj, P.: RCP 8.5—A scenario of comparatively high greenhouse gas emissions. Climatic Change, 109, no. 1-2, 33-57, doi: 10.1007/s10584-011-0149-y, 2011.
Webber, C. P., Dacre, H. F., Collins, W. J., and Masato, G.: The Dynamical Impact of Rossby Wave Breaking upon UK PM10 Concentration. Atmos. Chem. and Phys. Discuss, doi; 10.5194/acp-2016-571, 2016.
Weijenborg, C., de Vries, H. and Haarsma, R. J.: On the direction of Rossby wave breaking in blocking. Climate Dynamics, 39, 2823- 2831, doi: 10.1007/s00382-012-1332-1, 2012.
Woollings, T. J., Hoskins, B. J., Blackburn, M. and Berrisford, P.: A new Rossby wave-breaking interpretation of the North Atlantic Oscillation. J. Atmos. Sci, 65, 609-626, doi: http://dx.doi.org/10.1175/2007JAS2347.1, 2008.
