Email: r.s.williams@pgr.reading.ac.uk
Williams, R. S., Hegglin, M. I., Kerridge, B. J., Jöckel, P., Latter, B. G., and Plummer, D. A.: Characterising the seasonal and geographical variability in tropospheric ozone, stratospheric influence and recent changes, Atmos. Chem. Phys., 19, 3589–3620, https://doi.org/10.5194/acp-19-3589-2019, 2019.
Approximately 90 % of atmospheric ozone (O3) today resides in the stratosphere, which we know as the ozone layer (extending from ~15-35 km), where it plays a critical role in filtering out most of the harmful ultraviolet (UV) rays from the sun. The gradual formation of the ozone layer from around 600 million years ago was key in Earth’s evolutionary history, as it enabled life to flourish on land. Lesser known is the importance of the remaining ~ 10 % of atmospheric ozone, which is found in the troposphere and has implications for air quality, radiative forcing and the oxidation capacity of the troposphere. Whilst ozone is a pollutant at ground level, contributing to an estimated 6 million premature deaths globally per year, it also acts to cleanse the troposphere by breaking down a large number of pollutants, along with some greenhouse gases. Ozone is however a greenhouse gas in itself – where it has a maximum radiative forcing in the upper troposphere. It is an example of a non-well mixed gas, owing to its spatially and temporally highly varying sources and sinks, as well as its relatively short global mean tropospheric lifetime of about 3 weeks.
A major source of tropospheric ozone is the photochemical reactions of emission precursors such as carbon monoxide (CO), nitrogen oxides (NOx) and volatile organic compounds (VOCs), which have both natural and anthropogenic sources, in addition to the natural influx of ozone-rich air from the stratosphere. The magnitude of these two competing influences has been poorly quantified until the recent advent of satellite observations and the development of comprehensive chemistry-climate models (CCMs), which simulate interactive chemistry and are stratospherically well-resolved.
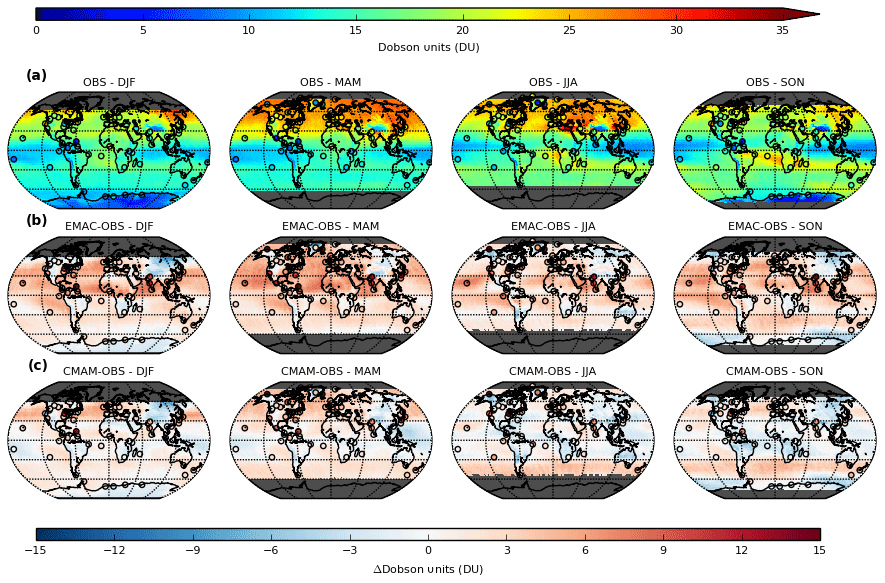
Our study aimed to update and extend the knowledge of a previous key study (Lamarque et al., 1999), that investigated the role of stratosphere-troposphere exchange (STE) on tropospheric ozone, using two contemporary state-of-the-art CCMs (EMAC and CMAM) with stratospheric-tagged ozone tracers as a diagnostic. We first sought to validate the realism of the model ozone estimates with respect to satellite observations from the Ozone Monitoring Instrument (OMI), together with spatially and temporally limited vertical profile information provided from ozonesondes, which we resolved globally on a seasonal basis for the troposphere (1000-450 hPa) (Figure 1).
Whilst we found broad overall agreement with both sets of observations, an overall systematic bias in EMAC of + 2-8 DU (Dobson Units) and regionally and seasonally varying biases in CMAM (± 4 DU) can be seen in the respective difference panels (Figure 1b and 1c). A height-resolved comparison of the models with respect to regionally aggregated ozonesonde observations helped us to understand the origin of these model biases. We showed that apparent closer agreement in CMAM arises due to compensation of a low bias in photochemically produced ozone in the troposphere, resulting from the omission of a group of emission precursors in this model, by excessive smearing of ozone from the lower stratosphere due to an inherent high bias. This smearing is induced when accounting for the satellite observation geometry of OMI, necessary to ensure a direct comparison with vertically well-resolved models, which has limited vertical resolution due to its nadir field of view. The opposite was found to be the case in EMAC, with a high (low) bias in the troposphere (lower stratosphere) relative to ozonesondes. Given the similarity in the emission inventories used in both models, the high bias in this model indicates that excess in situ photochemical production from emission precursors is simulated within the interactive chemistry scheme. These findings emphasise the importance of understanding the origin of such biases, which can help prevent erroneous interpretations of subsequent model-based evaluations.
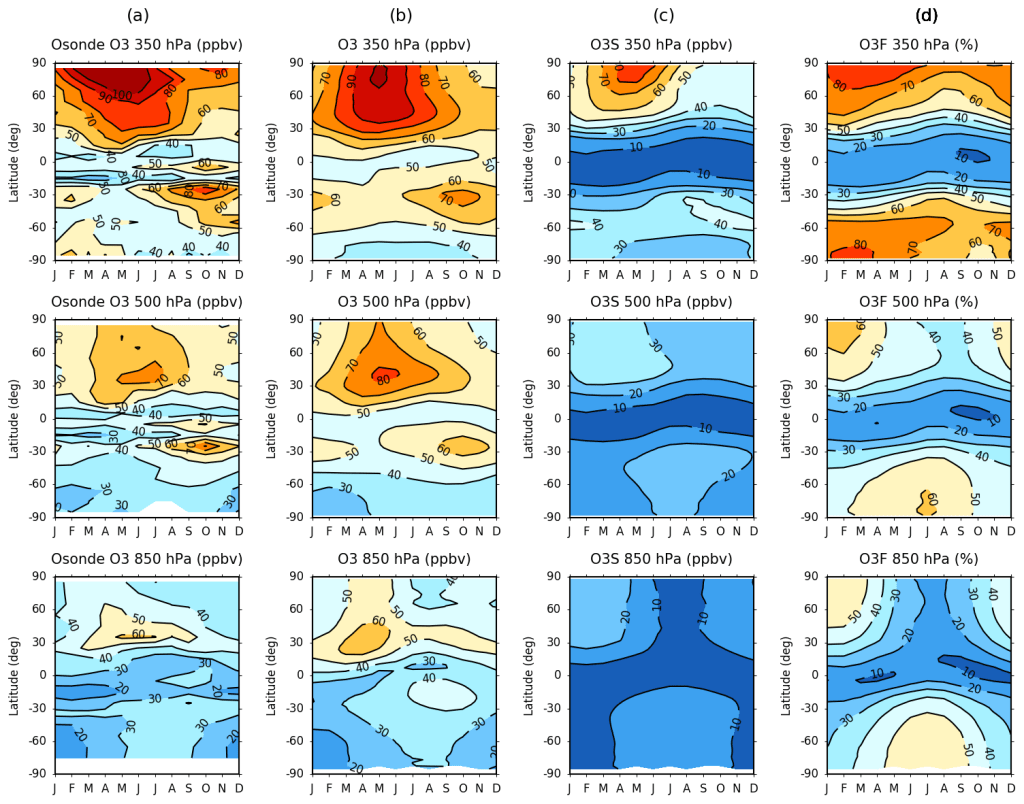
Noting these model biases, we next exploited the fine scale vertical resolution offered by the CCMs to investigate the regional and seasonal variability of the stratospheric influence. Analysis of the model stratospheric ozone (O3S) tracers revealed large differences in the burden of ozone in the extratropical upper troposphere-lower stratosphere (UTLS) region, with some 50-100 % more ozone in CMAM compared to EMAC. We postulated that CMAM must simulate a stronger lower branch of the Brewer-Dobson Circulation, the meridional stratospheric overturning circulation, since the stratospheric influence is isolated using these simulations. This has implications for the simulated magnitude and distribution of the downward flux of ozone from the stratosphere in each model. Shown in Figure 2 is the zonal-mean monthly evolution of ozone volume mixing ratio (ppbv) from ozonesondes and EMAC over the period 1980-2013 for the upper (350 hPa), middle (500 hPa) and lower (850 hPa) troposphere, together with the EMAC O3S and derived fraction of ozone of stratospheric origin (O3F) (%) evolution.
We found that the ozonesonde evolution closely resembles that of both EMAC and CMAM (not shown) throughout the troposphere. A clear correspondence in the seasonality of ozone is also evident for the EMAC O3S tracer, and in turn the O3F evolution, particularly towards the upper troposphere. Nonetheless, both models imply that over 50 % of near-surface ozone is derived from the stratosphere during wintertime in the extratropics, which is substantially greater than that estimated by Lamarque et al. (1999) (~ 10-20 %), and still considerably higher than more recent studies (~ 30-50 %) (e.g. Banarjee et al., 2016). This indicates that the stratospheric influence may indeed be larger than previously thought and is thus an important consideration when attempting to understand past, present and future trends in tropospheric ozone.
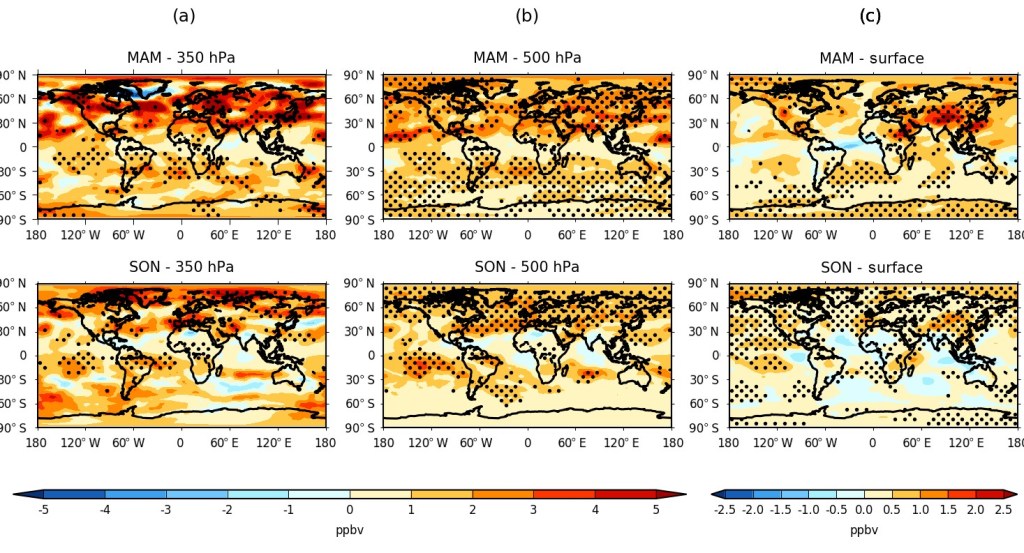
Finally, we analysed height-resolved seasonal changes in both the model O3 and O3S between 1980-89 and 2001-10. The calculated hemispheric springtime (MAM/SON) changes in ozone are shown in Figure 3, and equivalently for O3S in Figure 4, for the upper and middle troposphere (350 and 500 hPa), as well as for the surface model level. A general increase in tropospheric ozone was found worldwide in all seasons, which is maximised overall during spring in both the Northern Hemisphere (~ 4-6 ppbv) and the Southern Hemisphere subtropics (~ 2-6 ppbv), corresponding to a relative increase of about 5-10 %. Respectively, a significant stratospheric contribution to this change of ~ 3-5 ppbv and ~ 1-4 ppbv is estimated using the model O3S tracers (~ 50-80 % of the total change), although with substantial inter-model disagreement over the magnitude and sometimes the sign of the attributable change for any given region or season from the stratosphere.
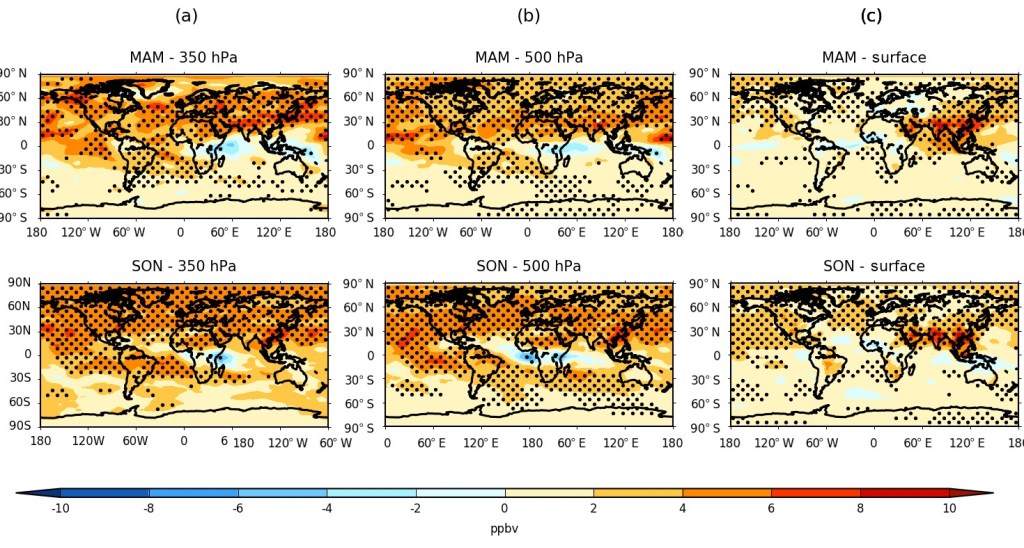
Although surface ozone changes are dominated by regional changes in precursor emissions between the two periods – the largest, statistically significant increases (> 6 ppbv) being over south-east Asia – the changing influence from the stratosphere were estimated to be up to 1–2 ppbv between the two periods in the Northern Hemisphere, albeit with high regional, seasonal and inter-model variability. In relative terms, the stratosphere can be seen to typically explain 25-30 % of the surface change over regions such as the Himalayas, although locally it may represent the dominant driver (> 50 %) where changes in emission precursors are negligible or even declining due to the enforcement of more stringent air quality regulations over regions such as western Europe and eastern North America in recent years.
To summarise, our paper highlights some of the shortcomings of the EMAC and CMAM CCMs with respect to observations and we emphasise the importance of understanding model bias origins when performing subsequent model-based evaluations. Additionally, our evaluations highlight the necessity of a well-resolved stratosphere in models for quantifying the stratospheric influence on tropospheric ozone. We find evidence that the stratospheric influence may be larger than previously thought, compared with previous model-based studies, which is a highly significant finding for understanding tropospheric ozone trends.
References:
Lamarque, J. F., Hess, P. G. and Tie, X. X.: Three‐dimensional model study of the influence of stratosphere‐troposphere exchange and its distribution on tropospheric chemistry., J. Geophys. Res. Atmos., 104(D21), 26363-26372, https://doi:10.1029/1999JD900762, 1999.
Banerjee, A., Maycock, A. C., Archibald, A. T., Abraham, N. L., Telford, P., Braesicke, P., and Pyle, J. A.: Drivers of changes in stratospheric and tropospheric ozone between year 2000 and 2100., Atmos. Chem. Phys., 16, 2727-2746, https://doi.org/10.5194/acp-16-2727-2016, 2016.

One thought on “Characterising the seasonal and geographical variability in tropospheric ozone, stratospheric influence and recent changes”