Email: Rachael.Byrom@pgr.reading.ac.uk
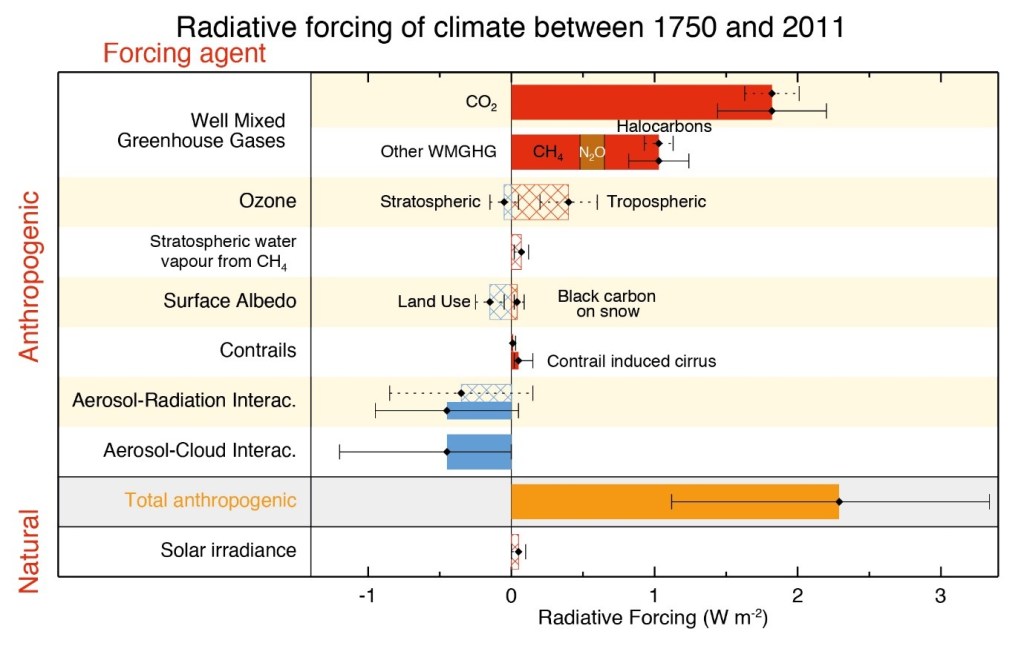
Methane (CH4) is a potent greenhouse gas. Its ability to effectively alter fluxes of longwave (thermal-infrared) radiation emitted and absorbed by the Earth’s surface and atmosphere has been well studied. As a result, methane’s thermal-infrared impact on the climate system has been quantified in detail. According to the Intergovernmental Panel on Climate Change (IPCC) Fifth Assessment Report (AR5), methane has the second largest radiative forcing (0.48 W m-2) of the well-mixed greenhouse gases after carbon dioxide (CO2) (Myhre et al. 2013, See Figure 1). This means that due to its change in atmospheric concentration since the pre-industrial era (from 1750 – 2011), methane has directly perturbed the tropopause net (incoming minus outgoing) stratospheric temperature-adjusted radiative flux by 0.48 W m-2, causing the climate system to warm.
However, an important effect is missing from the current IPCC AR5 estimate of methane’s climate impact – its absorption of solar radiation. In addition to longwave radiation, methane also alters fluxes of incoming solar shortwave radiation at wavelengths between 0.7 – 10 µm.
Until recently this shortwave effect had not been thoroughly quantified and as such was largely overlooked. My PhD work focuses on quantifying methane’s shortwave effect in detail and aims to build upon the significant, initial findings of Etminan et al. (2016) and a more recent study by Collins et al. (2018).
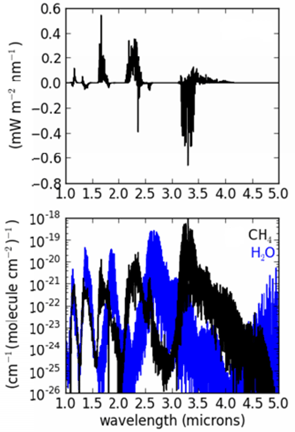
Etminan et al. (2016) analysed methane’s absorption of solar near-infrared radiation (at wavelengths between 0.2 – 5 µm) and found that it exerted a direct instantaneous, positive forcing on the climate system, largely due to the absorption of upward scattered, reflected near-infrared radiation by clouds in the troposphere. Essentially, this processes results in photons taking multiple passes throughout the troposphere, which in turn results in increased absorption by CH4. Figure 2 shows the net (downwards minus upwards) spectral variation of this forcing at the tropopause under all-sky (i.e. cloudy) conditions. Here it is clear to see methane’s three key absorption bands across the near-infrared region at 1.7, 2.3 and 3.3 µm.
As Etminan et al. (2016) explain, following a perturbation in methane concentrations all of these bands decrease the downwards shortwave radiative flux at the tropopause, due to increased absorption in the stratosphere. However, the net sign of the forcing depends on whether this negative contribution compensates over increased absorption by these bands in the troposphere (which constitutes a positive forcing). As Figure 2 shows, whilst the 3.3 µm band has a strongly net negative forcing due to the absorption of downwelling solar radiation in the stratosphere, both the 1.7 µm and 2.3 µm bands have a net positive forcing due to increased CH4 absorption in an all-sky troposphere. When summed across the entire spectral range, the positive forcing at 1.7 µm and 2.3 µm dominates over the negative forcing at 3.3 µm – resulting in a net positive forcing. Etminan et al. (2016) also found that the nature of this positive forcing is partly explained by methane’s spectral overlap with water vapour (H2O). The 3.3 µm band overlaps with a region of relatively strong H2O absorption, which reduces its ability to absorb shortwave radiation in the troposphere, where high concentrations of H2O are present. However, both the 1.7 µm and 2.3 µm bands overlap much less with H2O, and so are able to absorb more shortwave radiation in the troposphere.
In addition to this, Etminan et al. (2016) also found that the shortwave effect serves to impact methane’s stratospheric temperature-adjusted longwave radiative forcing (the process whereby stratospheric temperatures readjust to radiative equilibrium before the change in net radiative flux is calculated at the tropopause; Myhre et al. (2013)). Here, absorption of solar radiation in the stratosphere results in a warmer stratosphere, and hence increased emission of longwave radiation by methane downwards to the troposphere. This process results in a positive tropopause longwave radiative forcing. Combing both the direct, instantaneous shortwave forcing and its impact on the stratospheric-temperature adjusted longwave forcing, Etminan et al. (2016) found that the inclusion of the shortwave effect enhances methane’s radiative forcing by a total of 15%. The results presented in this study are significant and indicate the importance of methane’s shortwave absorption. However, Etminan et al. (2016) note several areas of uncertainty surrounding their estimate and highlight the need for a more detailed analysis of the subject.
My work aims to address these uncertainties by investigating the impact of factors such as updates to the HITRAN spectroscopic database (which provides key spectroscopic parameters for climate models to simulate the transmission of radiation through the atmosphere), the inclusion of the solar mid-infrared (7.7 µm) band in calculations of the shortwave effect and potential sensitivities, such as the vertical representation of CH4 concentrations throughout the atmosphere and the specification of land surface albedo. My work also extends Etminan et al. (2016) by investigating the shortwave effect at a global spatial resolution, since a two-atmosphere approach (using tropical and extra-tropical profiles) was employed by the latter. To do this I use the model SOCRATES-RF (Checa-Garcia et al. 2018) which computes monthly-mean radiative forcings at a global 5° x 5°
spatial resolution using a high resolution 260-band shortwave spectrum (from 0.2 – 10 µm) and a standard 9-band longwave spectrum.
Initial results calculated by SOCRATES-RF confirm that methane’s all-sky tropopause shortwave radiative forcing is positive and that the inclusion of shortwave bands serves to increase the stratospheric-temperature adjusted longwave radiative forcing. In total my calculations estimate that the shortwave effect increases methane’s total radiative forcing by 10%. Whilst this estimate is lower than the 15% proposed by Etminan et al. (2016) it’s important to point out that this SOCRATES-RF estimate is not a final figure and investigations into several key forcing sensitivities are currently underway. For example, methane’s shortwave forcing is highly sensitive to the vertical representation of concentrations throughout the atmosphere. Tests conducted using SOCRATES-RF reveal that when vertically-varying profiles of CH4 concentrations are perturbed, the shortwave forcing almost doubles in magnitude (from 0.014 W m-2 to 0.027 W m-2) when compared to the same calculation conducted using constant vertical profiles of CH4 concentrations. Since observational studies show that concentrations of methane decrease with height above the tropopause (e.g. Koo et al. 2017), the use of realistic vertically-varying profiles in forcing calculations are essential. Highly idealised vertically-varying CH4 profiles are currently employed in SOCRATES-RF, which vary with latitude but not with season. Therefore, the realism of this representation needs to be validated against observational datasets and possibly updated accordingly.
Another key sensitivity currently under investigation is the specification of land surface albedo – a potentially important factor controlling the amount of reflected shortwave radiation absorbed by methane. Since the radiative properties of surface features are highly wavelength-dependent, it is plausible that realistic, spectrally-varying land surface albedo values will be required to accurately simulate methane’s shortwave forcing. For example, vegetation and soils typically tend to reflect much more strongly in the near-infrared than in the visible region of the solar spectrum, whilst snow surfaces reflect much more strongly in the visible (see Roesch et al. 2002). Currently in SOCRATES-RF, globally-varying, spectrally-constant land-surface albedo values are used, derived from ERA-Interim reanalysis data.
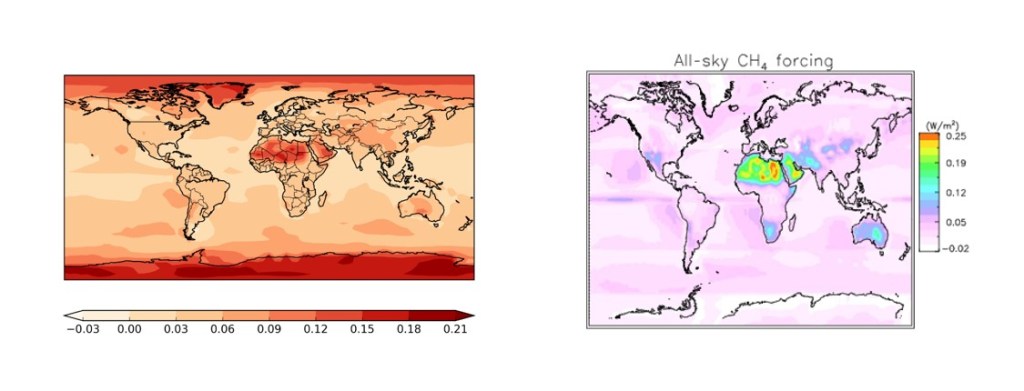
Figure 3 compares the spatial distribution of methane’s annual-mean all-sky tropopause shortwave forcing as calculated by SOCRATES-RF and Collins et al. (2018). Both calculations exhibit the same regions of maxima across, for example, the Sahara, the Arabian Peninsula, and the Tibetan Plateau. However, it is interesting to note that the poleward amplification shown by SOCRATES-RF is not evident in Collins et al. (2018). The current leading hypothesis for this difference is the fact that the land surface albedo is specified differently in each calculation. Collins et al. (2018) employ spectrally-varying surface albedo values derived from satellite observations. These are arguably more realistic than the spectrally-constant values currently specified in SOCRATES-RF. The next step in my PhD is to further explore the interdependence between methane’s shortwave forcing and land-surface albedo, and to work towards implementing spectrally-varying albedo values into SOCRATES-RF calculations. Along with the ongoing investigation into the vertical representation of CH4 concentrations, I aim to finally deliver a more definitive estimate of methane’s shortwave effect.
References:
Checa-Garcia, R., Hegglin, M. I., Kinnison, D., Plummer, D. A., and Shine, K. P. 2018: Historical tropospheric and stratospheric ozone radiative forcing using the CMIP6 database. Geophys. Res. Lett., 45, 3264–3273, https://doi.org/10.1002/2017GL076770
Collins, W. D. et al, 2018: Large regional shortwave forcing by anthropogenic methane informed by Jovian observations, Sci. Adv. 4, https://doi.org/10.1126/sciadv.aas9593
Etminan, M., G. Myhre, E. Highwood, K. P. Shine. 2016: Radiative forcing of carbon dioxide, methane and nitrous oxide: a significant revision of methane radiative forcing, Geophys. Res. Lett., 43, https://doi.org/10.1002/2016/GL071930
IPCC, 2013: Climate Change 2013: The Physical Science Basis. Contribution of Working Group I to the Fifth Assessment Report of the Intergovernmental Panel on Climate Change, Cambridge University Press, 1535 pp
Myhre, G., et al. 2013: Anthropogenic and natural radiative forcing, in Climate Change 2013: The Physical Science Basis. Contribution of Working Group I to the Fifth Assessment Report of the Intergovernmental Panel on Climate Change, edited by T. F. Stocker et al., pp. 659–740, Cambridge Univ. Press, Cambridge, U. K., and New York.
Roesch, A., M. Wild, R. Pinker, and A. Ohmura, 2002: Comparison of spectral surface albedos and their impact on the general circulation model simulated surface climate, J. Geophys. Res., 107, 13-1 – 13-18, https://doi.org/10.1029/2001JD000809
