Linda van Garderen – linda.vangarderen@hzg.de
During the summer of 2003, Europe experienced two heatwaves with, until then, unprecedented temperatures. The 2003 summer temperature record was shattered in 2010 by the Russian heatwave, which broke even Paleo records. The question remained, if climate change influenced these two events. Many contribution studies based on the likelihood of the dynamical situation were published, providing important input to answering this question. However, the position of low and high-pressure systems and other dynamical aspects of climate change are noisy and uncertain. The storyline method attributes the thermodynamic aspects of climate change (e.g. temperature), which are visible in observations and far more certain.
Storylines
All of us regularly think in terms of what if and if only. It is the human way of calculating hypothetic results in case we would have made a different choice. This helps us think in future scenarios, trying to figure out what choice will lead to which consequence. It is a tool to reduce risk by finding a future scenario that seems the best or safest outcome. In the storyline method, we use this exact mind-set. What if there was no climate change, would this heatwave be the same? What if the world was 2°C warmer, what would this heatwave have looked like then? With the help of an atmospheric model we can calculate what a heatwave would have been like in a world without climate change or increased climate change.
In our study, we have two storylines: 1) the world as we know it that includes a changing climate, which we call the ‘factual’ storyline and 2) a world that could have been without climate change, which we call the ‘counterfactual’ storyline. We simulate the dynamical aspects of the weather extreme exactly the same in both storylines using a spectral nudging technique and compare the differences in temperatures. To put it more precise, the horizontal wind flow is made up out of vorticity (circular movement) and divergence (spreading out or closing in). We nudge (or push) these two variables in the higher atmosphere to, on large scale, be the same in the factual and counterfactual simulations.
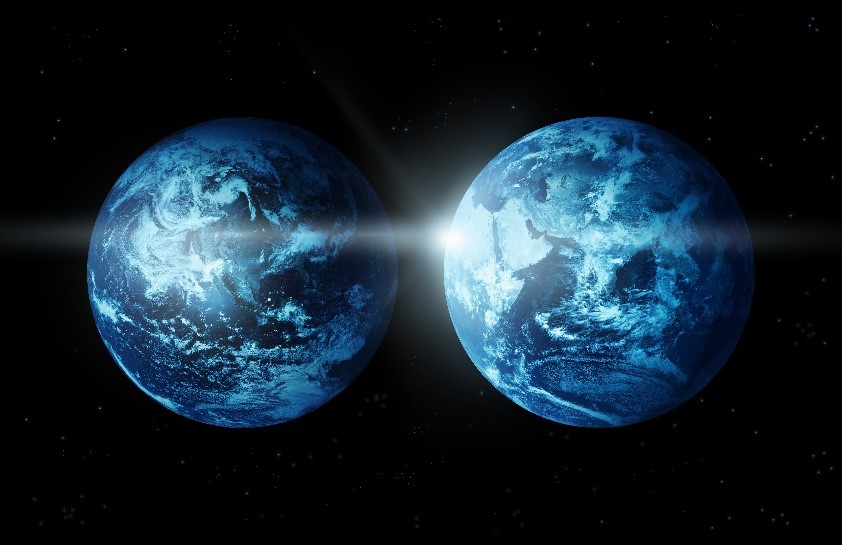
Figure 1. What if we had another world where climate change did not happen? Would the heatwave have been different? Thinking in counterfactual worlds where we made (or will make) different decisions is a common way of thinking to estimate risk. Now we apply this idea in atmospheric modelling.
European 2003 and Russian 2010 heatwaves
Both the European heatwave in 2003 and the Russian heatwave in 2010 were extremes with unprecedented high temperatures for long periods of time. Besides, there had been little rain already from spring in either case, which reduced the cooling effect from moisty soil to nearly nothing. In our analysis we averaged the near surface temperatures in both storylines and compared their output to each other as well as the local climatology. Figure 2 shows the results of that averaging for the European heatwave in panel a and the Russian heatwave in panel b. We focus on the orange boxes, where the blue lines (factual storyline) and the red lines (counterfactual storyline) exceed the 5th-95th percentile climatology (green band). This means that during those days the atmosphere near the surface was uncommonly hot (thus a heatwave). The most important result in this graph is that the blue and red lines are separate from each other in the orange boxes. This means that the average temperature of the world with climate change (blue, factual) is higher than in the world without climate change (red, counterfactual).
“Even though there would have been a heatwave with or without climate change, climate change has made the heat more extreme”
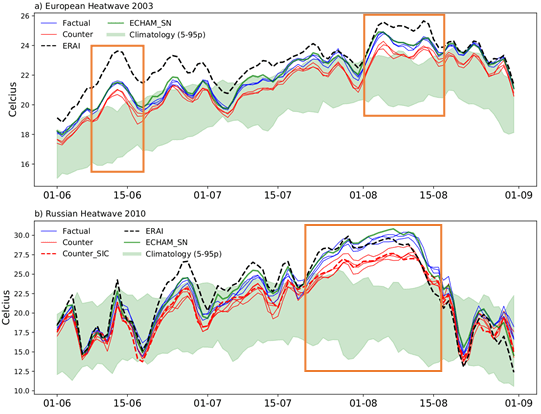
Figure 2. Daily mean temperature at 2 meters height for (a) European summer 2003 and (b) Russian summer 2010. The orange boxes are the heatwaves, where the temperatures of the factual (blue) and counterfactual (red) are above the green band of 5th – 95th percentile climatology temperatures.
The difference between these temperatures are not the same everywhere, it strongly depends on where you are in Europe or Russia. Let me explain what I mean with the help of Figure 3 with the difference between factual and counterfactual temperatures (right panels) on a map. In both Europe and Russia, we see that there are local regions with temperature differences of almost 0°C, and we see regions where the differences are almost 2.5°C (for Europe) or even 4°C (for Russia). A person living south from Moscow would therefore not have experienced 33°C but 29°C in a world without climate change. It is easy to imagine that such a temperature difference changes the impacts a heatwave has on e.g. public health and agriculture.
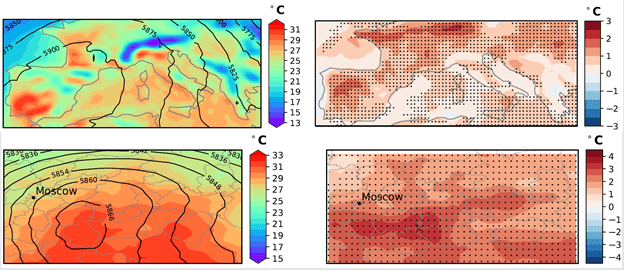
Figure 3. Upper left: Average Temperature at 2 meter height and Geopotential height over Europe at z500 for 1-15th of August 2003, Lower left: Same as upper left but for 1-15th of Russia August 2010. Upper right: Factual minus Counterfactual average temperature at 2 meter height over Europe for 1-15th of August 2003, Lower right: same as lower left but for 1-15th of Russia August 2010. Stippling indicates robust results (all factuals are > 0.1°C warmer than all counterfactuals)
“The 2003 European and 2010 Russian heatwaves could locally have been 2.5°C – 4°C cooler in a world without climate change”
We can conclude therefore, that with the help of our nudged storyline method, we can study the climate signal in extreme events with larger certainty.
If you are interested in the elaborate explanation of the method and analysis of the two case studies, please take a look at our paper:
van Garderen, L., Feser, F., and Shepherd, T. G.: A methodology for attributing the role of climate change in extreme events: a global spectrally nudged storyline, Nat. Hazards Earth Syst. Sci., 21, 171–186, https://doi.org/10.5194/nhess-21-171-2021 , 2021.
If you have questions or remarks, please contact Linda van Garderen at linda.vangarderen@hzg.de.
