Deploying an Instrument to the Reading University Atmospheric Observatory 

Caleb Miller – c.s.miller@pgr.reading.ac.uk 

In the Reading area, December and January seem to be prime fog season. Since I’m studying the effects of fog on atmospheric electricity, that means that winter is data collection season! However, in order to begin collecting data in the first year of my PhD, there was only a short amount of time to prepare an instrument and deploy it to the observatory before Christmas. 

One of the instruments that I am using to measure fog is called the Optical Cloud Sensor (OCS). It was designed by Giles Harrison and Keri Nicoll, and it is described in more detail in this paper: (Harrison and Nicoll 2014). The OCS has four channels of LEDs which shine light into the surrounding air. When fog is present, the fog droplets scatter light back to the instrument, where the intensity from each channel can be measured. 

Powering the instrument 

The OCS was originally designed to be flown on a weather balloon, which meant that it was meant to be powered by battery and run for only short periods of time. In my case, however, I wanted the device to be able to continuously collect data over a period of weeks or months without interruption. Then, we would be able to catch any fog events, even if they hadn’t been forecasted. That meant the device would need to be powered by the +15V power supply available at the observatory, and my first step was to create a power adapter for the OCS so that this would be possible. 

Initially, I had been considering using an Arduino microcontroller as a datalogger, so I decided to put together a power adapter on an Arduino shield (a small electronic platform) for maximum convenience. I included multiple voltage levels on my power adapter and connected them to different power inputs on the OCS. Once this was completed, the entire system could now be powered with a single power supply that was available at the observatory! 

I was able to find all of the required parts for the power supply in stock in the laboratory in the Meteorology Department, and I soldered it together in a few days. The technical staff of the university were very helpful in this process! A photograph of the power adapter connected to an Arduino is shown in Figure 1. 

Figure 1. The power adapter for the optical cloud sensor, built on an Arduino shield 

Storing data from the instrument 

Once the power supply had been created, the next step was setting up a datalogging system. On a balloon, the data would be streamed in real-time down to a ground station by radio link. But when this system was deployed to the ground, that would no longer be necessary. 

Instead, I decided to use a CR1000X datalogger from Campbell Scientific. This system has a number of voltage inputs which can be programmed using a graphical interface over a USB connection, and it has a port for an SD card. I programmed the datalogger to sample each of the four analog channels coming from the OCS every five seconds and to store the measurements on an SD card. Collecting the measurements was then as simple as removing the SD card from the datalogger and copying the data to my laptop. This could be done without interrupting the datalogger, as it has its own internal storage, and it would continue measuring while the SD card was removed. 

I had also considered simultaneously logging a digital form of the measurements to an Arduino in addition to the analog measurements made by the datalogger. This would give us two redundant logging systems which would decrease the chances of losing valuable information in the event of an instrument malfunction. However, due to a shortage of time and a technical issue with the instrument’s digital channels, I was unable to prepare the Arduino logger by the time we were ready to deploy the OCS, so we used only the analog datalogger. 

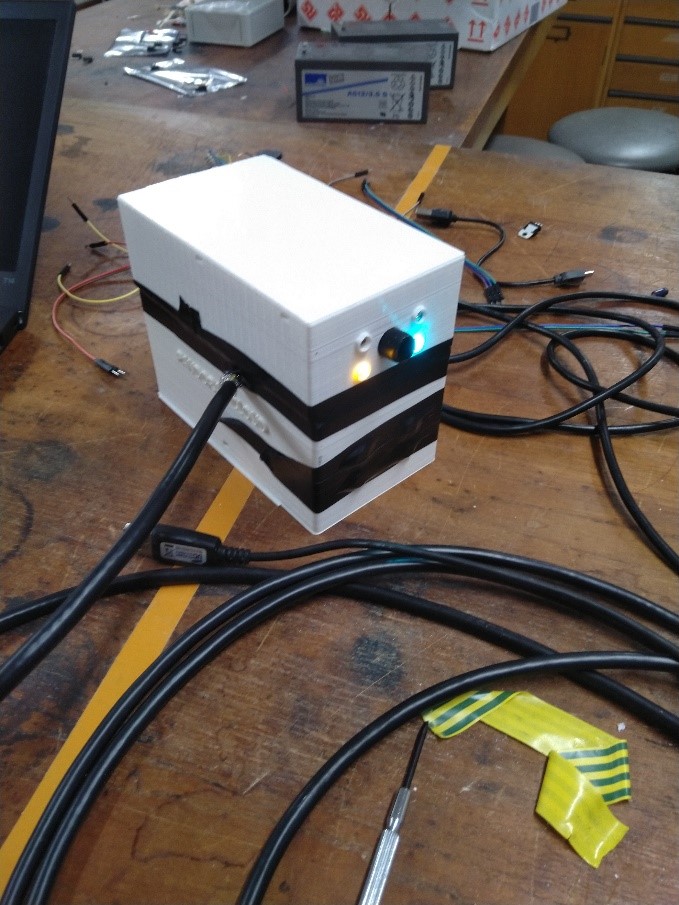
Figure 2. The OCS with its new power supply being tested in the laboratory 

Deploying the instrument 

Once the power supply and datalogger were completed, the instrument was ready to be deployed! It was a fairly simple process to get approval to put the instrument in the observatory; then I met with Ian Read to find a suitable location to set up the OCS. There were several posts in the observatory which were free, and I chose one which was close to the temperature and humidity sensors in the hopes that the conditions would be fairly similar in those locations. Once everything was ready, the technicians and I took the OCS and datalogger and set it up in the field site. At first, when we powered it on, nothing happened. Apparently, one of the solder joints on my power adapter had been damaged when I carried it across campus. However, I resoldered that connection with advice from the university technical staff, and it worked beautifully! 

Figure 3. The datalogger inside its enclosure in the observatory 

Figure 4. The OCS attached to its post in the observatory  

Except for a short period of maintenance in January, the OCS has been running continuously from December until May, and it has already captured quite a few fog events! With the data from the OCS, I now have an additional resource to use in analyzing fog. The levels of light backscattered from the four channels of the instrument provide interesting information, which I am combining with electrical and visibility measurements to analyze the microphysical properties of fog development. 

Hopefully, over the next year, we will be able to measure many more fog events with this instrument that will help us to better understand fog! 

Harrison, R. G., and K. A. Nicoll, 2014: Note: Active optical detection of cloud from a balloon platform. Rev. Sci. Instrum., 85, 066104, https://doi.org/10.1063/1.4882318. 

Climate Resilience Evidence Synthesis Training 

Lily Greig – l.greig@pgr.reading.ac.uk 

The Walker Academy, the capacity strengthening arm of the Walker Institute, based at the University of Reading, holds a brilliant week-long training course every year named (Climate Resilience Evidence Synthesis Training (CREST). The course helps PhD students from all disciplines to understand the role of academic research within wider society. I’m a third year PhD student studying ocean and sea ice interaction, and I wanted to do the course because I’m interested in understanding how to better communicate scientific research, and the process of how research is used to inform policy. The other students who participated were mainly from SCENARIO or MPECDT, studying a broad range of subjects from Agriculture to Mathematics.  

The Walker Institute  

The Walker Institute is an interdisciplinary research institute supporting the development of climate resilient societies. Their research relates to the impacts of climate variability, which includes social inequality, conflict, migration and loss of biodiversity. The projects at Walker involve partnership with communities in low-income countries to increase climate resilience on the ground. 

The institute follows a system-based approach, in which project stakeholders (e.g., scientists, village duty bearers, governments and NGOs) collaborate and communicate continuously, with the aim of making the best decisions for all. Such an approach allows, for example, communities on the ground (such as a village in North East Ghana affected by flooding) to vocalise their needs or future visions, meaning scientific research performed by local or national Meteorological agencies can be targeted and communicated according to those specific needs. Equally, with such a communication network, governments are able to understand how best to continually enforce those connections between scientists and farmers, and to make the best use of available resources or budgets. This way, the key stakeholders form part of an interacting, constantly evolving complex system. 

Format and Activities 

The course started off with introductory talks to the Walker’s work, with guest speakers from Malawi (Social Economic Research and Interventions Development) and Vietnam (Himalayan University Consortium). On the second day, we explored the topic of communication in depth, which included an interactive play, based on a negotiation of a social policy plan in Senegal. The play involved stepping on stage and improvising lines ourselves when we spotted a problem in negotiations. An example of this was a disagreement between two climate scientists and the social policy advisor to the President- the scientists knew that rainfall would get worse in the capital, but the social scientist understood that people’s livelihoods were actually more vulnerable elsewhere. Somebody stepped in and helped both characters understand that the need for climate resilience was more widespread than each individual character had originally thought.  

Quick coffee break after deciphering the timeline of the 2020 floods in North East Ghana.

The rest of the week consisted of speedy group work on our case study of increasing climate resilience to annual flood disasters in North East Ghana, putting together a policy brief and presentation. We were each assigned a stakeholder position, from which we were to propose future plans. Our group was assigned the Ghanaian government. We collected evidence to support our proposed actions (for example, training Government staff on flood action well in advance of a flood event, as not as an emergency response) and built a case for why those actions would improve people’s livelihoods. 

Alongside this group work, we had many more valuable guest speakers. See the full list of guest speakers below. Each guest gave their own unique viewpoint of working towards climate resilience. 

List of guest speakers 

Day 1: Chi Huyen Truong: Programme Coordinator Himalayan University Consortium, Mountain Knowledge and Action Networks 

Day 1: Stella Ngoleka: Country Director at Social Economic Research and Interventions Development – SERID and HEA Practitioner  

Day 2: Hannah Clark: Open Source Farmer Radio Development Manager, Lorna Young Foundation 

Day 2: Miriam Talwisa: National Coordinator at Climate Action Network-Uganda 

Day 3: panel speakers:  

Irene Amuron: Program Manager, Anticipatory Action at Red Cross Red Crescent Climate Centre 

Gavin Iley: International Expert, Crisis Management & DRR at World Meteorological Organization 

James Acidri: Former member of the Ugandan Parliament, Senio associate Evidence for Development 

Day 4: Tesse de Boer: Technical advisor in Red Cross Red Crescent Climate Centre 

Day 5: Peter Gibbs: Freelance Meteorologist & Broadcaster 

Course Highlights 

Everyone agreed that the interactive play was a highly engaging & unusual format, and one not yet encountered in my PhD journey! It allowed some of us to step right into the shoes of someone whose point of view you had potentially never stopped to consider before, like a government official or a media reporter… 

The 2022 CREST organisers and participants. Happy faces at the end of an enjoyable course!

Something else that really stayed with me was a talk given by the National Coordinator at Climate Action Network Uganda, Miriam Talwisa. She shared loads of creative ideas about how to empower climate action in small or low-income communities. These included the concept of community champions, media cafes, community dialogues, and alternative policy documentation such as citizens manifestos or visual documentaries. This helped me to think about my own local community and how such tools could be implemented to enforce climate action at the grassroots level.  

Takeaways  

An amazing workshop with a lovely and supportive team running it who built a real atmosphere. I took away a lot from the experience and I think the other students did too. It really helped us to think about our own research and our key stakeholders, and how reaching out to them is really important. 

Physical climate storylines of UK drought 

Wilson Chan – wilson.chan@pgr.reading.ac.uk  

Hydrological droughts are periods of below normal river flows. These events negatively impact public water supply and the natural environment. The UK is commonly perceived as wet and rainy with low risk of water supply shortages. A recent report explored the “Great British Rain Paradox” by showing that this perception does not hold true given past severe droughts and vulnerability to future droughts under climate change. The latest UKCP18 projections suggest the potential for more frequent and intense droughts across the UK.  

“Top-down” and “bottom-up” approaches 

There has been a lot of research carried out on the possible impacts of climate change on river flows in the UK. In our recently published review paper, we reviewed over 100 papers published over the past three decades and found that there is relative certainty among studies over a possible reduction in summer river flows for catchments across the UK. There is also evidence to suggest that slow-responding groundwater-dominated catchments in the southeast, particularly important for public water supplies, may experience a reduction in river flows across all seasons.  

There remains considerable uncertainty over the magnitude of change and the temporal evolution of future droughts. In our review, we find that studies following a traditional “top-down” assessment approach may not be able to fully address key research gaps. Most of the papers we reviewed followed this approach where output from global climate models (GCMs) are fed through hydrological models of varying complexities to simulate river flows (Figure 1a). This approach often aims to analyze as many components within the impact modelling chain as possible and incurs the cascade of uncertainty (Figure 1b). Outcomes depend on the many choices made along the way (e.g. climate models, emission scenarios, hydrological models etc.) which often results in wide uncertainty ranges that are not conducive to decision-making. A large part of this uncertainty is due to differences in the atmospheric circulation response to climate change across different climate models. Studies following a “top-down” approach are therefore limited when considering plausible worst-cases (low likelihood, high impact outcomes) and the information produced often cannot be easily used in practical water resources planning. 

Figure 1 (a) Studies on the impacts of climate change on UK river flows categorized into four modelling approaches with most of the reviewed studies following top-down GCM-driven and probabilistic approaches (b) The cascade of uncertainty incurred by “top-down” GCM-driven and probabilistic studies (Source: Wilby and Dessai 2010).

We also identified several approaches that have been developed to address drawbacks of “top-down” approaches. They do not seek to replace the traditional “top-down” approaches but instead aim to explore “top-down” projections from a wider “bottom-up” framework. For example, the scenario-neutral approach does not rely on GCM simulations and explores the sensitivity of hydrological systems to a much wider range of plausible futures. The storyline approach is another example of approaches designed to explicitly understand plausible worst cases and navigate the uncertainty cascade from a decision-making context. Storylines can be seen as plausible pathways conditioned on a discrete set of changes (e.g. in atmospheric circulation, management measures or event characteristics). They are informed by multiple lines of evidence (incl. process understanding, historical reconstructions and traditional GCM projections).  

Storylines 

The second paper of my PhD, published in Hydrology and Earth Systems Sciences, demonstrates how the storyline approach can be applied to understand UK droughts. We used an observed event, the 2010-12 drought, as the basis for developing a range of storylines. The drought is one of the top 10 most significant multi-year UK droughts. Temporary water use restrictions affected 20 million customers and drought conditions led to agricultural and industrial losses of over GBP400 million. The drought was characterized by two consecutive dry winters and terminated rapidly in early 2012 with record-breaking rainfall over spring 2012. Motivated by a series of “what-if” questions, we created downward counterfactual storylines of the 2010-12 drought to reimagine how the event could have turned out worse. 

 In our study, we created storylines quantifying what would happen if… 

  1. Hydrological preconditions of the drought were drier 
  1. Continued dry conditions persisted from a third dry winter instead of the observed rapid drought termination  
  1. The drought was to unfold in a warmer climate.  

We showed that the 2010-12 drought was highly influenced by catchment preconditions. Storylines of drier preconditions showed that catchment preconditions prior to drought inception aggravated drought conditions for some of the most affected catchments. Progressively drier preconditions could have led to short but more intense conditions for fast responding catchments in Scotland and a lag and lengthening of drought conditions in slow responding catchments in lowland England.  

The observed 2010-12 drought was characterized by two consecutive dry winters. Weather forecasts and water companies at the time widely anticipated dry conditions to continue through 2012. The prospect of three consecutive dry winters is a well-known concern in the water resources industry and can lead to significant reduction in reservoir storage. This is especially important for slow-responding catchments as groundwater reserves are normally recharged during winter. Storylines of the 2010-12 drought given an additional dry year with dry winter conditions either before or after the observed drought showed the vulnerability of catchments to a “three dry winters” situation. Figure 2 shows that drought conditions could still have intensified with even lower river flows for catchments that were already the most affected.  

Figure 2 Standardized streamflow index (SSI) over the 2010-12 drought (black) and storylines of an additional dry winter before (red) and after (blue) the observed drought for four example river catchments in SE England. Lower values of the SSI indicate below average river flows over the accumulation period (6-months; SSI-6 is shown here), and vice versa.

Applying the UKCP18 regional climate projections to the observed 2010-12 drought sequence, drought conditions are projected to worsen with temperature rise. Notably, the magnitude of change is lower for catchments in western Scotland due to the compensating effects of wetter winters in general although summer months are projected to become drier with temperature rise. Benchmark severe droughts such as the 1975-76 and the 1989-92 droughts are regularly used to test the feasibility of water management plans. Given a third dry winter or a >2°C temperature rise, the different counterfactual storylines of the 2010-12 drought could have led to worse conditions than both the selected benchmark droughts (Figure 3 for slow-responding catchments in southeast England relative to the 1989-92 drought).  

Figure 3 Comparison of the various storylines with the 1988-92 drought which was particularly severe for slow-responding catchments in SE England (especially in East Anglia). The plot shows change in mean deficit and maximum intensity for each storyline relative to the 1988-92 drought. SSI accumulated over longer periods (e.g. SSI-24) is more indicative of prolonged drought conditions in slow-responding catchments compared to SSI-6.

Event storylines created from plausible alterations made to past observed droughts can help water resources planners stress test hydrological systems against unrealised droughts. “Bottom-up” approaches exploring specific conditions relevant to water resources planning (e.g. three dry winters) can complement traditional “top-down” projections to better understand worst-cases and consider how future extreme droughts can unfold.

Chan, W.C.H., Shepherd, T.G., Facer-Childs, K., Darch, G., Arnell, N.W., 2022a. Tracking the methodological evolution of climate change projections for UK river flows. Progress in Physical Geography: Earth and Environment 030913332210792. https://doi.org/10.1177/03091333221079201  

Chan, W.C.H., Shepherd, T.G., Facer-Childs, K., Darch, G., Arnell, N.W., 2022b. Storylines of UK drought based on the 2010–2012 event. Hydrology and Earth System Sciences 26, 1755–1777. https://doi.org/10.5194/hess-26-1755-2022