A New Aviation Turbulence Forecasting Technique

Anyone that has ever been on a plane will probably have experienced turbulence at some point. Most of the time it is not likely to cause injury, but during severe turbulence unsecured objects (including people) can be thrown around the cabin, costing the airline industry millions of dollars every year in compensation (Sharman and Lane, 2016). Recent research has also indicated that in the future the frequency of clear-air turbulence will increase with climate change. Forecasting turbulence is one of the best ways to reduce the number of injuries by giving pilots and flight planners ample warning, so they can put on the seat-belt sign or avoid the turbulent region altogether. The current method used in creating a turbulence forecast is a single ‘deterministic’ forecast – one forecast model, with one forecast output. This shows the region where they suspect turbulence to be, but because the forecast is not perfect, it would be more ideal to show how certain we are that there is turbulence in that region.

To do this, a probabilistic forecast can be created using an ensemble (a collection of forecast model outputs with slightly different model physics or initial conditions). A probabilistic forecast essentially shows model confidence in the forecast, and therefore how likely it is that there will be turbulence in a given region. For example, if all 10 out of 10 forecast outputs predict turbulence in the same location, the pilots would be confident in taking action (such as avoiding the region altogether). However, if only 1 out of 10 models predict turbulence, then the pilot may choose to turn on the seat-belt sign because there is still a chance of turbulence, but not enough to warrant spending time and fuel to fly around the region. A probabilistic forecast not only provides more information in the certainty of the forecast, but it also increases the chances of forecasting turbulence that a single model might miss.

Gill and Buchanan (2014) showed this ensemble forecast method does improve the forecast skill. In my project we have taken this one step further and created a multi-model ensemble, which is combining two different ensembles, each with their own strengths and weaknesses (Storer et al., 2018). We combine the Met Office Global and Regional Ensemble Prediction System (MOGREPS-G), with the European Centre for Medium Range Weather Forecasting (ECMWF) Ensemble Prediction System (EPS).

Analysis_plot_1_new
Figure 1: Plot of a moderate-or-greater turbulence event over the possible sources of turbulence: top left: orography, shear turbulence (bottom left: MOGREPS-G and bottom right: ECMWF EPS probability forecast), and top right: convection from satellite data (colour shading indicates deep convection). Both the MOGREPS-G and ECMWF-EPS ensembles forecast the shear turbulence event. The circles indicate turbulence observations with grey indicating no turbulence, orange indicating light turbulence and red indicating moderate or greater turbulence. The convective classification can be found in Francis and Batstone (2013).

There are three main sources of turbulence. The first is mountain wave turbulence, where gravity waves are produced from mountains that ultimately lead to turbulence. The second is convectively-induced turbulence, which includes in-cloud turbulence and also gravity waves produced as a result of deep convection that also lead to turbulence. The third is shear-induced turbulence, which is the one we are trying to forecast in this example. Figure 1 is an example plot showing orography and thus mountain wave turbulence (top left), convection and thus convectively induced turbulence (top right), the MOGREPS-G ensemble forecast of shear turbulence (bottom left) and the ECMWF ensemble forecast of shear turbulence (bottom right). The red circle indicates a ‘moderate or greater’ turbulence event, and we can see that because it is over the North Atlantic it is not a mountain wave turbulence event, and there is no convection nearby, but both the ensemble forecasts correctly predict the location of the shear-induced turbulence. This shows that there is high confidence in the forecast, and action (such as putting the seat-belt sign on) can be taken.

Value_1
Figure 2: Value plot with a log scale x-axis of the global turbulence with the 98 convective turbulence cases removed showing the forecast skill of the MOGREPS-G (dot-dash), ECMWF (dot), combined multi-model ensemble (dash) and the maximum value using every threshold of the combined multi-model ensemble (solid). The data used has a forecast lead time between +24 hours and +33 hours between May 2016 and April 2017.

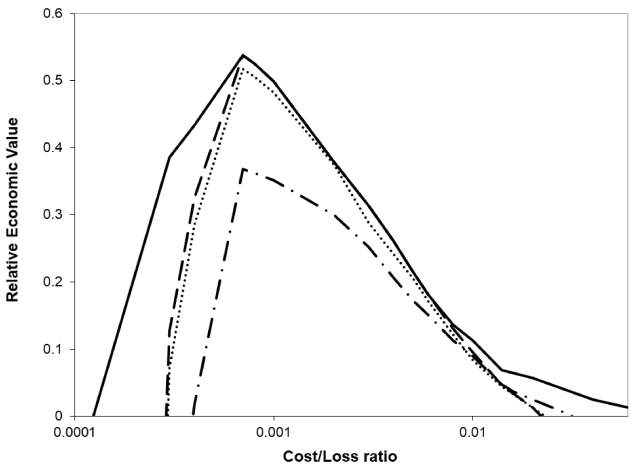
To understand the usefulness of the forecast, Figure 2 is a relative economic value plot. It shows the value of the forecast for a given cost/loss ratio (which will vary depending on the end user). The multi-model ensemble is more valuable than both of the single model ensembles for all cost/loss ratios, showing that every end user will benefit from this forecast. Although our results do show an improvement in forecast skill, it is not statistically significant. However, by combining ensemble forecasts we gain consistency and more operational resilience (i.e., we are still able to produce a forecast if one ensemble is not available), and is therefore still worth implementing in the future.

Email: luke.storer@pgr.reading.ac.uk

References

Gill PG, Buchanan P. 2014. An ensemble based turbulence forecasting system. Meteorol. Appl. 21(1): 12–19.

Sharman R, Lane T. 2016. Aviation Turbulence: Processes, Detection, Prediction. Springer.

Storer, L.N., Gill, P.G. and Williams, P.D., 2018. Multi-Model Ensemble Predictions of Aviation Turbulence. Meteorol. Appl., (Accepted for publication).

Clear-Air Turbulence and Climate Change

Europe_turbulence_blog
Figure 1: Percentage change of clear-air turbulence over Europe and the North Atlantic

Clear-Air Turbulence (CAT) is a major hazard to the aviation industry. If you have ever been on a plane you have probably heard the pilots warn that clear-air turbulence could occur at any time so always wear your seatbelt. Most people will have experienced it for themselves and wanted to grip their seat. However, severe turbulence capable of causing serious passenger injuries is rare. It is defined as the vertical motion of the aircraft being strong enough to force anyone not seat belted to leave the chair or floor if they are standing. In the United States alone, it costs over 200 million US dollars in compensation for injuries, with people being hospitalised with broken bones and head injuries. Besides passengers suffering serious injuries, the cabin crew are most vulnerable as they spend most of the time on their feet serving customers. This results in an additional cost if they are injured and unable to work.

Clear-air turbulence is defined as high altitude inflight bumpiness away from thunderstorm activity. It can appear out of nowhere at any time and is particularly dangerous because pilots can’t see or detect it using on-board instruments.  Usually the first time a pilot is aware of the turbulence is when they are already flying through it. Because it is a major hazard, we need to know how it might change in the future, so that the industry can prepare if necessary. This could be done by trying to improve forecasts so that pilots can avoid regions likely to contain severe turbulence or making sure the aircraft can withstand more frequent and severe turbulence.

Our new paper published in Geophysical Research Letters named ‘Global Response of Clear-Air Turbulence to Climate Change’ aims at understanding how clear-air turbulence will change in the future around the world and throughout the year. What our study found was that, the busiest flight routes around the world would see the largest increase in turbulence. For example, the North Atlantic, North America, North Pacific and Europe (see Figure 1) will see a significant increase in severe turbulence which could cause more problems in the future. These regions see the largest increase because of the Jet Stream. The Jet Stream is a fast flowing river of air that is found in the mid-latitudes. Clear-air turbulence is predominantly caused by the wind traveling at different speeds around the Jet Stream. Climate change is expected to increase the Jet Stream speed and therefore increase the vertical wind shear, causing more turbulence.

To put these findings in context, severe turbulence in the future will be as frequent as moderate turbulence historically. Anyone who is a frequent flyer will have likely experienced moderate turbulence at some point, but fewer people have experienced severe turbulence. Therefore, this study suggests this will change in the future with most frequent flyers experiencing severe turbulence on some flight routes as well as even more moderate turbulence. Our study also found moderate turbulence will become as frequent in the summer as it has done historically in winter. This is significant because although clear-air turbulence is more likely in winter, it will however now become much more of a year round phenomenon (see Figure 2).

Seasonal_turbulence_blog
Figure 2: Percentage change of clear-air turbulence around the world in all four seasons. No Stipling (stipling) indicates it is (is not) significant at the 90% confidence level.

This increase in clear-air turbulence highlights the importance for improving turbulence forecasting. Current research has shown that using ensemble forecasts (many forecasts of the same event) and also using more turbulence diagnostics than the one we used in this study can improve the forecast skill. By improving the forecasts, we could consistently avoid the areas of severe turbulence or make sure passengers and crew are seat-belted before the turbulence event occurs. Unfortunately, as these improvements are not yet fully operational, you can still reduce your own risk of injury by making sure you wear your seat belt as much as possible so that, if the aircraft does hit unexpected turbulence, you would avoid serious injuries.

Storer, L. N., Williams, P. D., & Joshi, M. M. (2017). Global response of clear-air turbulence to climate change. Geophysical Research Letters, 44, 99769984. https://doi.org/10.1002/2017GL074618

This blog was originaly writen for EGU Blogs

EnvironmentYes

Email: luke.storer@pgr.reading.ac.uk

What happens when you ask a bunch of PhD meteorologists (and a space physicist) to come up with an innovative business idea and pitch it to leading experts in business development?

If we’re honest, a bunch of crazy ideas that happened to land us with something believable and attainable. Some of our brainstorming ideas included:

  • Cow Power: Using Pizoelectric sheets to generate electricity from the movement of cows in turnstables.
  • Pick Me Cup: A brand new portable cup created from biodegradable products as part of a reusable scheme.
  • PVC Insulate: Encouraging PVC recycling (i.e. plastics found in food wrap) and use the products for loft insulation.
  • Satellite Design Detection: Using satellite data and weather forecast models to predict the movement of crop diseases.

As scientists we tried to develop ideas that we thought would be plausible, effective and reduce the environmental impact of humans. Therefore the idea we settled on before the start of the workshop was Pick Me Cup. We aimed to use biodegradable materials that are waste products from the agriculture industry such as straw to make a durable and reusable coffee cup. We developed a strategy that would allow consumers to use the cup, deposit it in a recycle type bin, and get a new clean one next time they buy a drink. The scheme’s aim was to reduce waste in an easy manner for customers.

When we arrived at the workshop it quickly became evident that our idea wasn’t interesting enough, and our idea had to be plausible… but importantly not real. So we developed our idea adding in what we called ‘fake science’, which we found difficult as scientists. After talks outlining important things to remember when creating a business plan, we were set loose to work on our idea, with time spent with mentors helping us with the business strategy and intellectual property.

We wrestled with our idea trying to think of something interesting that we could incorporate, then patent and sell the license for. This finally led us to ‘ThermoPaper’. The idea was adding a chemical to the paper, increasing its thermal properties without compromising its recyclability, weight or increasing the costs significantly. This way fewer paper cups would be used as people don’t have to ‘double cup’. It also removes the need for a protective sleeve.

slide1

The workshop was an interesting insight into the world of business and entrepreneurship, informing us of patenting, licensing and the most important part of any small business… the exit strategy. By combining all these elements we forged a business plan that we thought was ambitious, asking for £200 000 investment, and an estimated sale price of £14 million in 5 years. So we gave our Dragons Den style pitch and they loved our idea, but apparently we were not ambitious enough! We aimed to start small and build our way up, developing new uses for ThermoPaper, but they said we should have just gone straight for the top. As a result we didn’t win, but it was an interesting few days.

A big thanks to NERC, Syngenta and all the other organisations that made the workshop possible, and also to the speakers and mentors that helped shape our idea and business plan throughout!