Brian Lo – brian.lo@pgr.reading.ac.uk
Differential reflectivity (ZDR) is the difference in measured backscatter from emitted radio waves in the horizontal and vertical polarisations. It is an observable available from dual-polarisation radars. Conventional single-polarisation radars usually offer reflectivity ZH only which is the intensity of backscatter in the horizontal polarization available from conventional radars. The addition of measuring ZDR allows for hydrometeor type classification. In other words, we could tell between large round tumbling hail which gives near zero ZDR from large oblate raindrops that give highly positive ZDR (Kumjian, 2013a). Strong updrafts contribute to severe convective development by lofting large hydrometeors like raindrops into higher parts of the storm, giving ZDR column signatures. A differential reflectivity (ZDR) column is defined as “a region of enhanced ZDR as situated above the 0◦C level” (Kumjian, 2013b) and are known to be useful in informing forecast warning decisions (e.g. Kuster et al., 2019, 2020).
The UK Met Office has fully upgraded all 15 C-band radars as of January 2018 to have dual-polarisation capabilities. The Met Office also composites data from this radar network to provide three-dimensional gridded products covering the entirety of the UK (Scovell and al-Sakka, 2016). Whereas a single radar would only be able to detect hydrometeors as high as its highest scan elevation, thus leaving the so-called “cone of silence” aloft closest to the radar, the composite permits nearby radars to fill in these regions of missing observations. To harness the greater spatial domain of the 3D radar composite constituting data from multiple overlapping radars, the composite was upgraded to include ZDR to investigate the operational potential of using ZDR columns. But, how do we know ZDR columns can be reliably detected within this 3D radar composite?
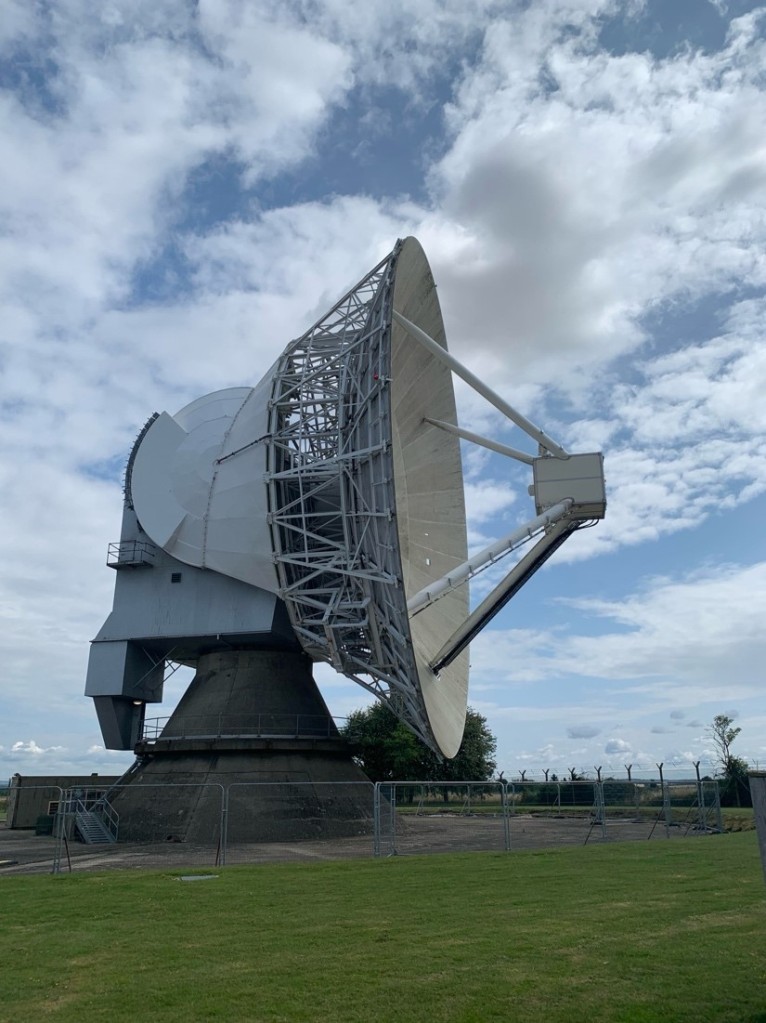
The work described in this post is to verify ZH and ZDR generated by the Met Office compositing process against range-height indicator (RHI) scans from Chilbolton Advanced Meteorological Radar (CAMRa), otherwise known as the world’s largest steerable meteorological research radar (see Figure 1). RHI scans are carried out by varying a radar antenna’s elevation angle but with the azimuth angle held constant. ZDR columns are often narrow features that may challenge the limited resolution (1km in the horizontal) of the radar composite.

CAMRa is a suitable truth owing to it being well-calibrated to within 0.1dB of ZDR, its extremely narrow beamwidth of 0.28◦, high range resolution of 75m and high resolution elevations of 0.11deg within RHIs. In contrast, the composite is made of operational radar data of lower resolution and the compositing process could further degrade the accuracy of the data. Thus its ZDR output has to be verified.
Vertical cross sections of the radar composite
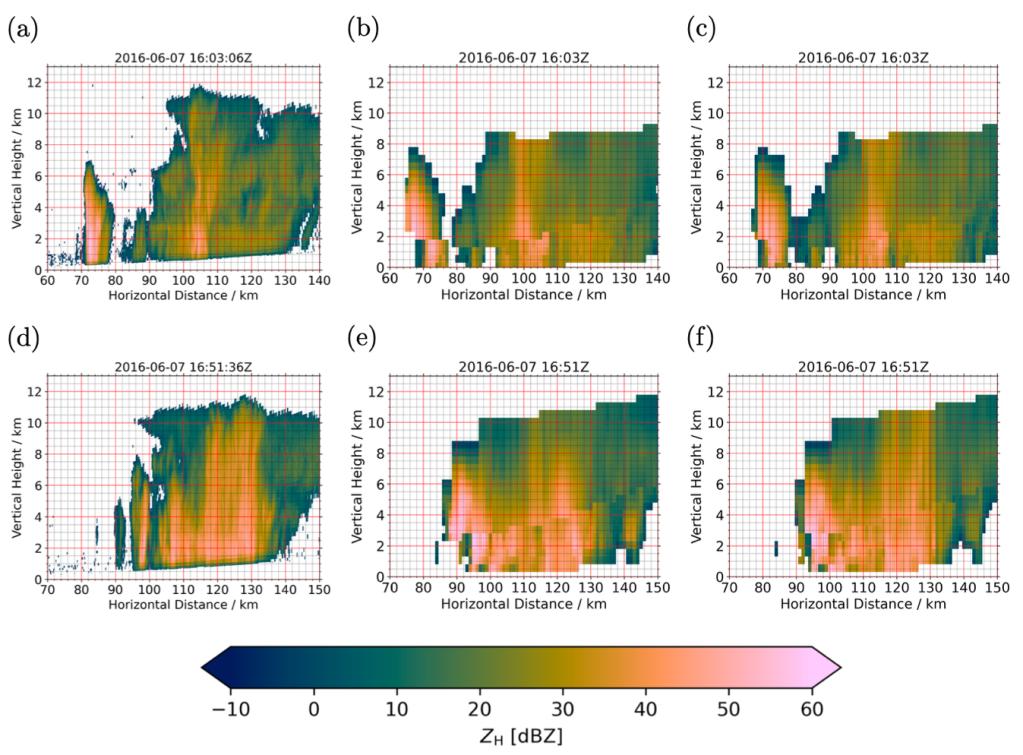
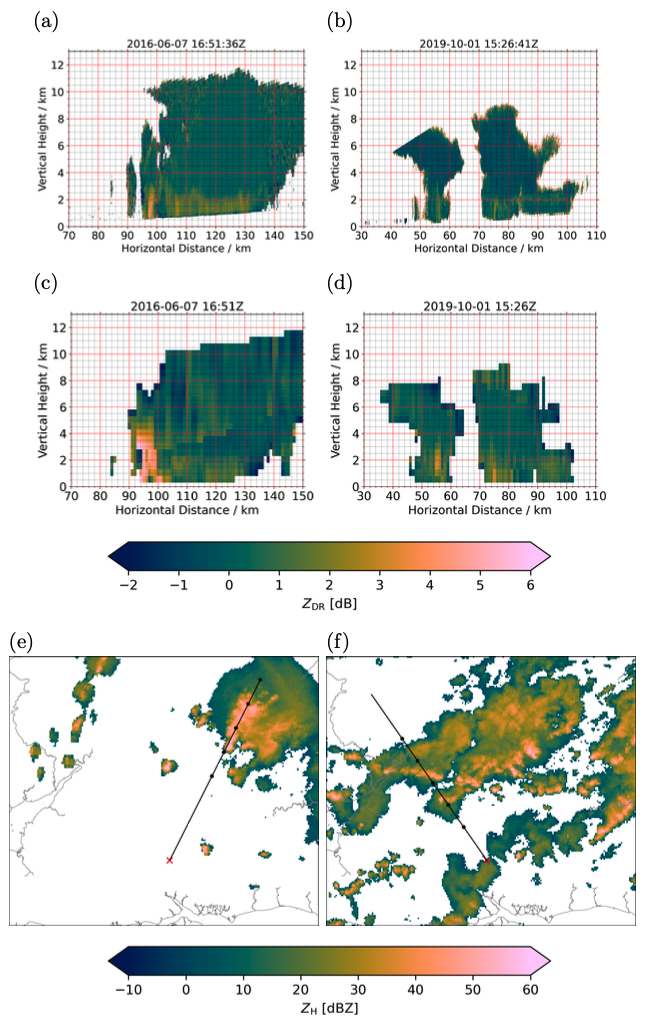
Figures 2a and 2d are RHI scans carried out by CAMRa, covering elevations from 0.02 to 10.0◦. These two figures captured an evolving convective system on 7 June 2016 at 1651Z (Figure 2e) and on 1 October 2019 at 1526Z (Figure 2f). The fine range resolution of 75m captured multiple intense reflectivity cores exceeding 40 dBZ with accompanying overshooting tops.
Figures 2b and 2e are pseudo-RHIs produced from the compositing process of the Chenies and Thurnham operational C-band radars. Both radars were chosen for the compositing process as their overlapping sampling regions offered coverage for the convective system scanned by CAMRa. Instead of generating the usual 3D composite with 1 km and 500 m of horizontal and vertical grid spacing respectively, the compositing software was modified in this verification process to interpolate C-band radar data onto a 2D grid along the CAMRa scan azimuth with the same grid resolutions thus producing the so-called pseudo-RHI plots.

However, the preliminary inspection of the pseudo-RHI plots reveals a serious vertical discontinuity of interpolated data. Such an issue would disrupt the automatic detection of vertically extending signatures such as ZDR columns. This problem is seen at around 70 and 100km down range in Figure 1b and 90km down range in Figure 2e. The displacement observed here suggests that the spatial location of storms could be misrepresented on the order of 5 km. What could have caused this problem?
Correction of spatial location of radar beams in compositing software
Through scrutiny of the Met Office compositing software, I found an error with how radar azimuths were used in the compositing process. In the pre-exisiting compositing software, radar azimuths would be formulated as azimuthal equidistant projection coordinates relative to the radar site, then directly transformed onto British National Grid coordinates. However, it was overlooked that Met Office radar azimuths are recorded with respect to British National grid north, whereas azimuthal equidistant projection coordinates require azimuths to be relative to true north. The deviations of up to a few degrees between the norths can lead to a horizontal displacement of radar data of at least a few kilometres at a range of 100km from a radar site. Lesson learnt: Attention to small details can have a large impact later on!
To fix this problem, grid convergence (Ordnance Survey, 2018) is added to all radar azimuths such that radar azimuths are adjusted with respect to true north before undergoing transformation into British National Grid coordinates. The effect of implementing such a correction can be seen in Figures 1c and 1f, where reflectivity values interpolated from two separate C-band radars result in a vertically continuous intense reflectivity core. There could still be mismatches on a smaller scale owing to radar scans happening at different times while the storm was being advected. With the radar composite corrected, is ZDR well represented?
Visual comparison of ZDR
Both Chenies and Thurnham radars used for generating pseudo-RHIs were upgraded to have dual polarimetric capability since March 2013. This allows the generation of ZDR pseudo-RHI plots as shown in Figures 2c and 2b, which can be qualitatively compared with CAMRa scans in Figures 2a and 2d on 7 June 2016 at 165136Z and on 1 October 2019 at 152641Z respectively.

Considering the observed ZDR column is approximately 95 km down range from the radar, a displacement of 0.6◦ is 1km of distance in the horizontal. Such a distance corresponds to the sampling resolution of the radar composite. The C-band operational radars also have a wider beamwidth of 1.1◦ and are unable to observe fine details unless the ZDR column is situated close to one of the radars. Thus, the discrepancy in intensity and height in Figure 2 is expected, owing to the differences in sampling resolutions between CAMRa and the radar composite. The operational radar composite, which combines measurements from radars at various ranges, is capable of detecting ZDR column features at a coarser resolution, whereas CAMRa is used to study fine details of the column structures with high precision in individual case studies.
We have shown that outputs from CAMRa captured sub-kilometre features such as the width of ZDR columns and their horizontal structures within a cell are too fine to be resolved by the composite. Despite the resolution limitations of operational radars and having done other tests not mentioned in this post, we are confident that the radar composite can be exploited to reliably capture the presence of ZDR columns at a horizontal spatial resolution of 1 km alongside an indication of their maximum heights.
References
Kumjian, M. R. (2013a). “Principles and Applications of Dual-Polarization Weather Radar. Part I: Description of the Polarimetric Radar Variables”. Journal of Operational Meteorology 1.20, pp. 243–264. doi:10.15191/nwajom.2013.0120
Kumjian, M. R. (2013b). “Principles and applications of dual-polarization weather radar. Part II: Warm- and cold-season applications”. Journal of Operational Meteorology 1.20, pp. 243–264. doi:10.15191/nwajom.2013.0120
Kuster, C. M. et al. (2019). “Rapid-update radar observations of ZDR column depth and its use in the warning decision process”. Weather and Forecasting 34.4, pp. 1173–1188. doi: 10.1175/WAF-D-19-0024.1
Kuster, C. M. et al. (2020). “Using ZDR Columns in Forecaster Conceptual Models and Warning Decision Making”. Weather and Forecasting, pp. 1–43. doi: 10.1175/WAF- D-20-0083.1 Ordnance Survey (2018). A Guide to Coordinate Systems in Great Britain. Accessed: 16-1-2024
Scovell, R. and H. al-Sakka (2016). “A Point Cloud Method for Retrieval of High-Resolution 3D Gridded Reflectivity from Weather Radar Networks for Air Traffic Management”. Journal of Atmospheric and Oceanic Technology 33.3, pp. 461–479. doi: https://doi.org/10.1175/JTECH-D-15-0051.1