AGU in Sunny San Francisco

Flynn Ames - f.ames@pgr.reading.ac.uk

For my first (and given carbon budgets, possibly the last) in-person conference of my PhD, I was lucky enough to go to AGU (American Geophysical Union Conference) in December 2023, taking place in San Francisco, California. As my first time in America, there was a lot to be excited about. As my first time presenting at a conference, there was a lot to be nervous about. So what did I discover?

To echo the previous year’s post: AGU is big. I mean really big. I mean seriously (please take me seriously) its huge. The poster hall was the size of an aircraft hangar – poster slots were numbered from 1 to over 3000, with each slot used by a different person for each day. Dozens of talk sessions were held at any time simultaneously across the three separate buildings (that thankfully were very close to each other), commencing anytime from 8am to 6pm, Monday to Friday. I was recommended the AGU app and would (uncharacteristically) do the same as it was very helpful in navigating the sessions. I’d also recommend properly planning what you want to attend in advance of the conference – it is very easy to miss potentially relevant sessions otherwise.
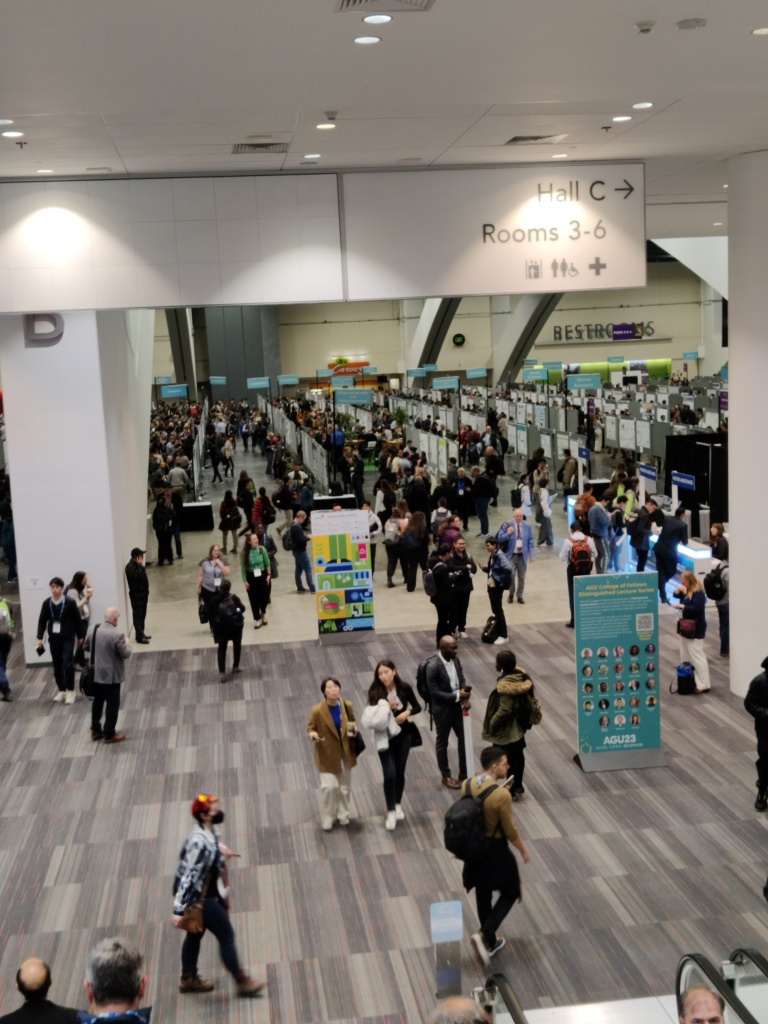
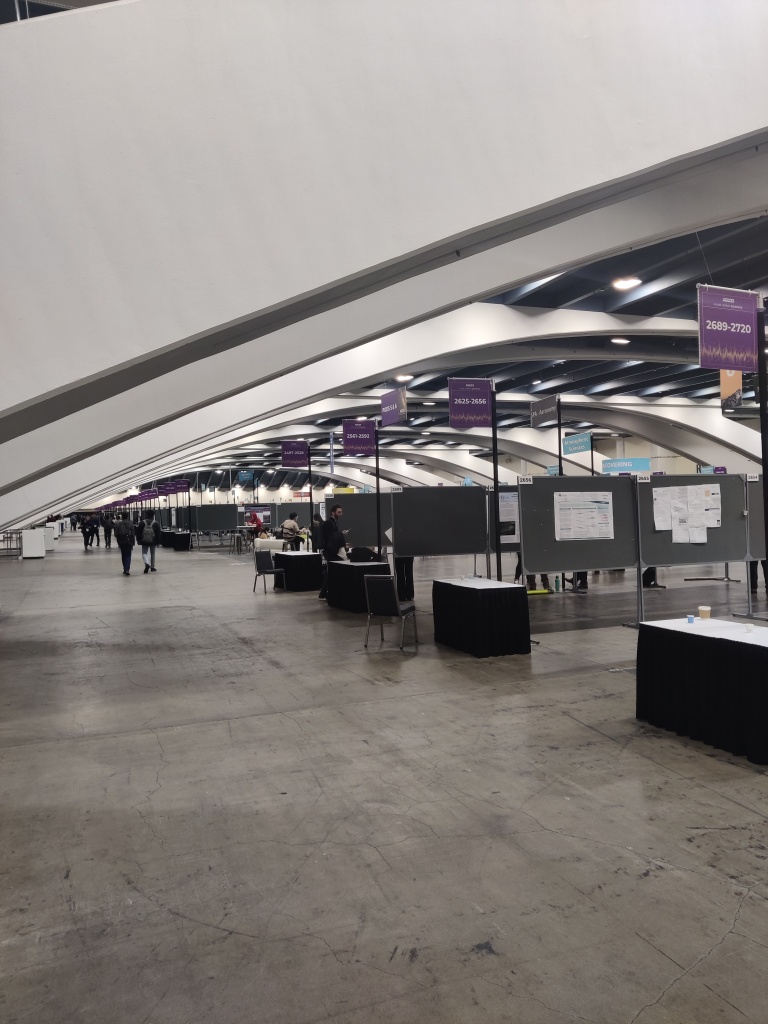
The poster hall from two different angles on Monday Morning (left) and Friday evening (right).

The keynote lectures (one per day) were like something out of Gamescom or E3. They always started with flashy, cinematic vignettes. Hosts and speakers had their own entrance theme song to walk out on stage to, whether that be Katy Perry ‘Fireworks’ or Johnny Cash ‘Ring of Fire’ (and of course, they had the cliche teleprompter from which to read). Some Keynote talks were OK in terms of content, but others were definitely a miss, seemingly prioritising style over substance or referring to subject matter in too abstract a way, so that it was difficult to gauge what the take home message was meant to be. I’d say attend at least one for the experience but skip the rest if they don’t appeal to you.

There were also miscellaneous activities to partake in. Exhibition Hall F was where you could find stalls of many research organisations, along with any American or Chinese university you can name (NASA had a cool one with some great graphics). In that same place you could also get a free massage (in plain sight of everyone else) or a professional headshot (which I tried – they brushed something on my face, I don’t know what it was) or even hang out with the puppies (a stall frequented by a certain Met PhD student). You could say there was something for everyone.

I wasn’t the only one needing rest after a long day of conferencing.

I found poster sessions to be far more useful than talks. Most talks were eight minutes long, with a red light switching on after seven. With these time constraints, presenters are often forced to assume knowledge and cram in content and slides. The presentations can be hard to follow at the best of times, but especially when you yourself are presenting later in the week and all you can do is watch and wait for that red light, knowing that it will be deciding your fate in days to come. In contrast, posters can be taken at one’s own pace – you can ask the presenter to tailor their “spiel” to you, whether that’s giving a higher-level overview (as I asked for 100% of the time) or skipping straight to the details. You get a proper chance to interact and have conversations with those doing work you’re interested in, in contrast to talks where your only hope is to hunt down and corner the presenter in the few microseconds after a session ends.

With that said, there were many great talks. Some of the coolest talks I attended were on existing and future mission concepts to Europa (moon of Jupiter) and Enceladus (moon of Saturn) respectively, which has tangential relevance to my own project (icy moon oceanography – probably best left for a future post). In these talks, they discussed the science of the upcoming Europa Clipper mission, along with a robotic EEL concept (like a robot snake) for traversing within and around the icy crevasses on Enceladus’s surface. It was really cool (and very lucky) getting to interact with people working on Europa Clipper and the current Juno mission orbiting Jupiter. Given the time taken between a mission’s proposal, getting (and sometimes losing) funding, planning, construction, and eventual launch and arrival, many of these scientists had been working on these missions for decades! 

My own talk was scheduled for the final conference day (given the luck with everything else, I won’t complain) at 8:40 am. While seemingly early, I struggled to sleep beyond 3:30am most days anyway owing to jet lag so by 8:40am, stress ensured I was wide awake, alert, and focused. 

The talk was over in a flash – I blinked and it was done (more or less).

The most academically helpful part of the conference was the conversations I had with people about my work after the talk. This was my main take away from AGU – that getting to know people in your field and having in-depth conversations really can’t have been achieved by reading someone’s paper, or even sending an email. Meeting in-person really helps. A poster session can thankfully make this feel very natural (as opposed to just randomly walking up to strangers – not for me…) and is therefore something I recommend taking advantage of. Besides, if they’re presenting a poster, they’re less able to run away, even if they want to.

A quick bullet point list of other things I learned (and didn’t) while at AGU:

Things I learned:

  • Apparently, PhD students having business cards is normal in America? – I got handed one during a dinner and the whole table didn’t understand why I was confused
  • NO BISCUITS DURING COFFEE BREAKS in America – probably because you can’t get biscuits easily in America. Regardless, my stomach deemed this a poor excuse.
  • Food portions are, in general, much bigger – surely to make up for the lack of biscuits during coffee breaks.

Things I didn’t learn:

  • How the automatic flush mechanism worked in the conference venue toilets (I really tried)
  • Given there were dozens of sessions happening simultaneously at the conference, probably many other things.

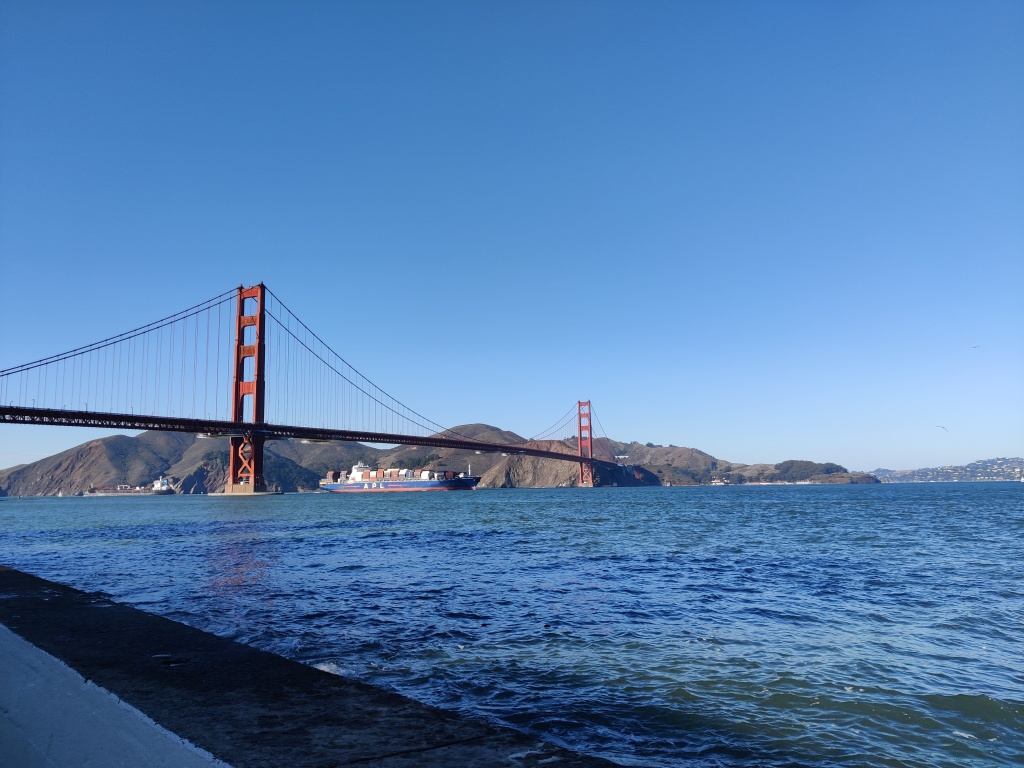
After AGU finished, I was lucky enough to spend extra time in San Francisco. The city really has a piece of everything: fantastic walks near the Golden Gate and coastal area, the characteristic steep streets and cable cars, lots of great places to eat out (great for vegans/vegetarians too! :)), and they had unexpectedly good street musicians. The weather was very nice for December – around 18 degrees. I even got sunburned on one of the days. Public transport is great in San Francisco and getting around the city was no issue.

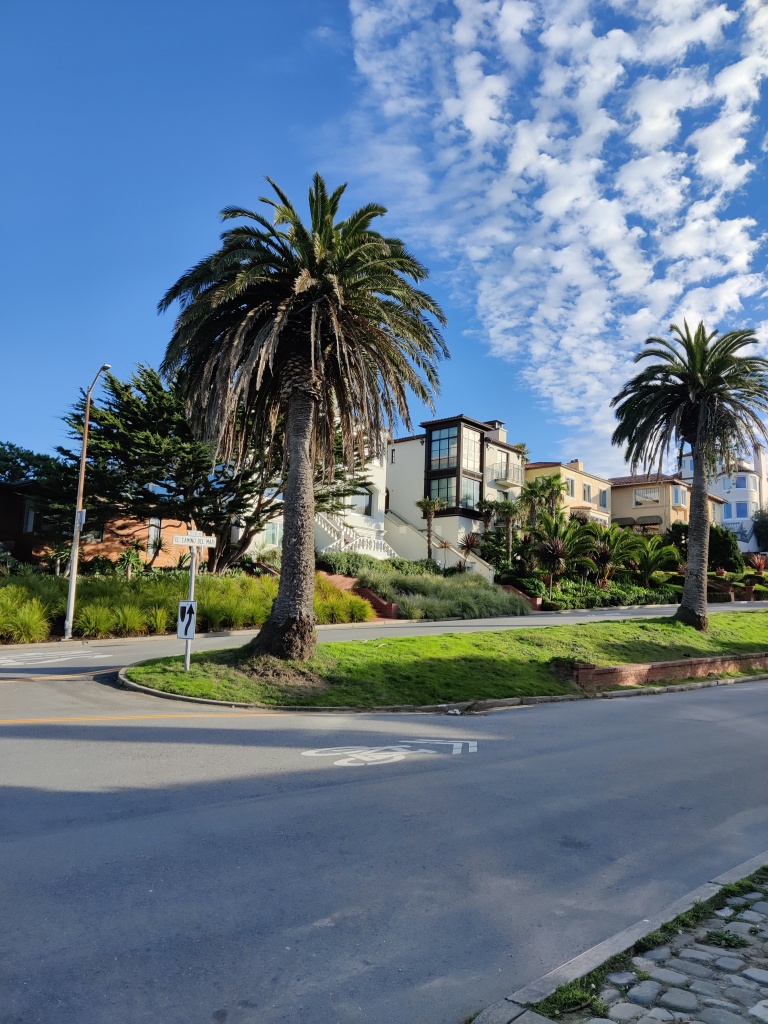
Some of the various sights (and only pictures I took) in San Francisco.

But San Francisco also appears to be a city of extremes. There are mansions near the beach in an area that looks like a screenshot from Grand Theft Auto Five. Meanwhile in the city itself, the scale of homelessness is far beyond anything I’ve observed here in the UK. I’d very frequently walk past people with large trolleys containing what appeared to be all their belongings. Nearby the Tenderloin district, pitched tents on the pathways next to roads were common, with people cooking on gas stoves. The line to what appeared to be one soup kitchen stretched outside and round the corner. Drug use was also very noticeable. I frequently spotted people slumped over in wheelchairs, others passed out in a subway station or outside a shop. People pass by as if no-ones there. It’s one thing hearing about these issues, but it is eye-opening to see it.

Overall, attending AGU in San Francisco was an experience I will not forget and certainly a highlight of my PhD so far – I’m very grateful I was able to go! Next year’s AGU will take place in Washington DC from 9th-13th December. Will you be there? Will you be the one to write next years AGU post?  Stay tuned to the Social Metwork (and for the latter, your email inbox) to find out.

Oceans in Weather and Climate Course 2018

email: r.frew@pgr.reading.ac.uk

Between the 11th-16th March myself and four other PhDs and post docs attended the Ocean in Weather and Climate (OiWC) course at the Met Office, Exeter. This NERC advanced training course was aimed at PhDs, postdocs and beyond. It provided a great opportunity to spend a week meeting other Oceanography researchers at varying stages of their career, and to expand your understanding of the oceans role in climate beyond the scope of your own work.

The week kicked off with an ice breaker where we had do some ‘Scientific speed dating’, chatting to other participants about: Where are you from? What do you work on? What is your main hobby? What is the biggest question in your field of research? This set the tone for a very interactive week full of interesting discussions between all attendees and speakers alike. Course participants were accommodated at The Globe Inn situated in Topsham, a cute village-sized town full of pastel-coloured houses, cosy pubs, art galleries, and beautiful riverside walks to stretch your legs in the evenings.

The days consisted of four 1.5 hour sessions, split up by caffeine and biscuit breaks to recharge before the next session.

Topics covered in the lecture-style talks included…

  • Dynamical Theory
  • Modelling the Ocean
  • Observations
  • Ocean-atmosphere coupling
  • Air-sea fluxes
  • High Resolution Ocean modelling in coupled forecast systems
  • The Meridional Overturning Circulation
  • The Southern Ocean in climate and climatic change
  • Climate variability on diurnal, seasonal, annual, inter-annual, decadal timescales
  • Climate extremes
  • Climate sensitivity, heat uptake and sea level.

OceanResolutionFigure
A recurring figure of the week…. taken from Helene Hewitt’s talk on high resolution ocean modelling showing ocean surface currents from HadGEM3-based global coupled models at different resolutions (eddy resolving, eddy permitting and eddy parameterised).


All the talks were very interesting and were followed by some stimulating discussion. Each session provided an overview of each topic and an indication of the current research questions in each area at the moment.

In the post lunch session, there were group practical sessions. These explored observational ARGO float data and model output. The practicals, written in iPython notebooks, were designed to let us play with some data, giving us a series of questions to trigger group discussions to deepen understanding of topics covered that morning.

The course also included some ‘softer’ evening talks, giving research career advice in a more informal manner. Most evenings were spent exploring the lovely riverside walks and restaurants/pubs of Topsham. The final evening was spent all together at the Cosy Club in Exeter, rounding off a very interesting and enjoyable week!

A week at COP23

From the 6th -17th of November the UNFCCC’s (United Nation Framework Convention on Climate Change) annual meeting or “Conference of the Parties” – COP took place. This year was COP23 and was hosted by Bonn in the UN’s world conference centre with Fiji taking the presidency.

IMG_20171106_123155780

Heading into the Bonn Zone on the first day of the COP. The Bonn Zone was the part of the conference for NGO stands and side events.

As part of the Walker Institutes Climate Action Studio another SCENARIO PhD and I attended the first week of the COP while students back in Reading participated remotely via the UNFCCC’s YouTube channel and through interviews with other participants of the COP.

There are many different components to the COP, it is primarily the meeting of a number of different international Climate agreements with lots of work currently being done on the implementation on the Paris Agreement. However it is also a space where many different civil society groups doing work connected to or impacted by climate change come together, to make connections with other NGOs as well as governments. This is done in an official capacity within the “exhibition zone” of the conference and with a vast array of side events taking place throughout the two weeks. Outside of these official events there are also many demonstrations both inside and outside of the conference space.

Demonstrations in the Bonn Zone

As an observer I was able to watch some of the official negotiations. On the Wednesday I attended the SBSTA (Subsidiary Body for Scientific and Technological Advice) informal consultation on research and systematic observations. It was an illuminating experience to see the negotiation process in action. At times it was frustrating to see how picky it feels like the negotiation teams can be, however over the week I did have a newfound appreciation for the complexity of the issues that are having to be resolved. This meeting was based on writing a short summary of the IPCC report and other scientific reports used by the COP, and so was less politically charged than a lot of the other meetings. However this didn’t stop an unexpected amount of debate over whether to include examples such as carbon-dioxide concentrations.

One of the most useful ways to learn about the COP was by talking to the different people and groups who we met at COP. It was interesting to see the different angles with which people were approaching the COP. From researchers who were observing the political process, to environmental and human rights NGO’s trying to get governments to engage with issues that they’re working on.

Interviewing other COP participants at the Walker Institutes stand

A particular highlight was the ex-leader of the Green Party Natalie Bennett, she spoke with us and the students back in Reading about a wide range of topics, from women’s involvement in the climate movement to discussing my PhD.

Kelly Stone from Action Aid provided a great insight into how charities operate at the COP. She spoke of making connections with other charities, often there are areas of overlap between their work but on other issues they had diverging opinions. However these differences have to be put aside to make progress on their shared interests. Kelly also discussed how it always amazes her that people are surprised that everyone who attends COP does not agree on everything, “we’re not deciding if climate change is real”. The issues being dealt with at the COP are complex dealing with human rights, economics, technology as well as climate change. Often serious compromises have to be made and this must be done by reaching a consensus between all 197 Parties to the UNFCCC.

To read more about the student experience of COP and summaries of specific talks and interviews you can view the COP CAS blog here. You can also read about last years COP on this blog here.

Clockwise from top left: The opening on the evening of Monday 6th November showed Fiji leaving its own mark as the President of the conference. The Norwegian Pavilion had a real Scandi feel, while the Fiji Pavilion transported visitors to a tropical island.


Two Weeks in Paris Learning about Fluid Dynamics and Sampling French Pastries

Email: r.frew@pgr.reading.ac.uk

The Fluid Dynamics of Sustainability and the Environment (FDSE) residential summer school runs every summer for two weeks, alternating between Cambridge University and Ecole polytechnique, which run the summer school in partnership. I attended this years hosted by Ecole polytechnique, situated to the South of Paris. 40 PhD students attended from institutes around the world, all working on a range of topics who want to learn more about environmental fluid dynamics.

logo-wake-green

The lectures covered topics on fundamentals of fluid dynamics, flow instabilities, environmental fluid dynamics, cryosphere, atmosphere, physical oceanography and renewable energy. The lectures went at a very fast pace (approximately triple speed!), aiming to familiarise us with as many concepts as possible in the two weeks, resulting in everyone taking home a large overflowing folder full of lecture notes to refer back to in the future.

We were kept very busy throughout the two weeks. Each day started with breakfast (coffee and croissants) between 7.30-8.20 am, followed by two back to back lectures 8.30-10.30 am. There was then half an hour for everyone to fuel their brain with coffee and (warm!) mini pastries before another hour lecture before lunch break. Lunch was roughly 12-1.30 pm, although typically there were so many interesting questions after each lecture that we ran progressively later relative to the schedule meaning that I think we only actually started lunch on time on the first day. There were also a number of guest speakers speaking on topics such as public engagement, climate policy, meteorology on mars and air quality.

After lunch we had the final lecture of the day, followed by a short break before numerical sessions and lab experiments, which ran until roughly 6 pm. These sessions gave us the chance to really learn about a particular topic in more detail and to have a more hands on experience with some of the material being lectured. My labs were on tidal energy where we explored the energy output and efficiency of tidal turbines, and Art and Science, which encouraged us to engage with Science in new and more playful ways and also to challenge us to look at it differently.

However the day didn’t end after the labs, the evenings were also jam packed! The first evening was a poster session, giving us all the opportunity to learn more about what all of the other students work on and to mingle. Other evenings consisted of learning to row sessions, visits to the observatory, movie nights and discussions about the ‘science’ in The Day After Tomorrow movie and barbeques enjoying the warm light evenings (definitely missing those now I’m back in Reading).

During the weekend sandwiched in the middle of the two weeks, we were all transferred to a hostel in the centre of Paris, setting us all up perfectly for some weekend sightseeing in Paris. On the Friday evening there was a boat party reception on the Siene, supplying us all with lots of wine, many difference French cheeses to sample and a lively dance floor.

The school ended on Friday July 14th, Bastille Day. After a morning presenting a few slides on the labs we had completed in groups to share what we had learnt, we travelled into the centre of Paris ready for an evening enjoying the spectacular Bastille Day fireworks around the Eiffel tower, ending the summer school with a bang.

Personally the main take away from the summer school was not to learn the entirety of the lecture content, but to become familiar with a wide range of topics gain more hands on experience of laboratory experiments and to have a (rather large) folder full of lecture notes to refer back to whenever I stumble across a particular concept again in the future. And of course, it was great having the opportunity to meet lots of other PhD students from around the world working on related topics and to be able to discuss, engage and get to know each other over the two weeks. I would like to thank all of the organisers and lecturers of the summer school for a really interesting and enjoyable two weeks!


RMetS Impact of Science Conference 2017.

Email – j.f.talib@pgr.reading.ac.uk

“We aim to help people make better decisions than they would if we weren’t here”

Rob Varley CEO of Met Office

This week PhD students from the University of Reading attended the Royal Meteorological Society Impact of Science Conference for Students and Early Career Scientists. Approximately eighty scientists from across the UK and beyond gathered at the UK Met Office to learn new science, share their own work, and develop new communication skills.

image4

Across the two days students presented their work in either a poster or oral format. Jonathan Beverley, Lewis Blunn and I presented posters on our work, whilst Kaja Milczewska, Adam Bateson, Bethan Harris, Armenia Franco-Diaz and Sally Woodhouse gave oral presentations. Honourable mentions for their presentations were given to Bethan Harris and Sally Woodhouse who presented work on the energetics of atmospheric water vapour diffusion and the representation of mass transport over the Arctic in climate models (respectively). Both were invited to write an article for RMetS Weather Magazine (watch this space). Congratulations also to Jonathan Beverley for winning the conference’s photo competition!

IMG_3055
Jonathan Beverley’s Winning Photo.

Alongside student presentations, two keynote speaker sessions took place, with the latter of these sessions titled Science Communication: Lessons from the past, learning for future impact. Speakers in this session included Prof. Ellie Highwood (Professor of Climate Physics and Dean for Diversity and Inclusion at University of Reading), Chris Huhne (Co-chair of ET-index and former Secretary of State for Energy and Climate Change), Leo Hickman (editor for Carbon Brief) and Dr Amanda Maycock (NERC Independent Research Fellow and Associate Professor in Climate Dynamics, University of Leeds). Having a diverse range of speakers encouraged thought-provoking discussion and raised issues in science communication from many angles.

Prof. Ellie Highwood opened the session challenging us all to step beyond the typical methods of scientific communication. Try presenting your science without plots. Try presenting your work with no slides at all! You could step beyond the boundaries even more by creating interesting props (for example, the notorious climate change blanket). Next up Chris Huhne and Leo Hickman gave an overview of the political and media interactions with climate change science (respectively). The Brexit referendum, Trump’s withdrawal from the Paris Accord and the rise of the phrase “fake news” are some of the issues in a society “where trust in the experts is falling”. Finally, Dr Amanda Maycock presented a broad overview of influential science communicators from the past few centuries. Is science relying too heavily on celebrities for successful communication? Should the research community put more effort into scientific outreach?

Communication and collaboration became the two overarching themes of the conference, and conferences such as this one are a valuable way to develop these skills. Thank you to the Royal Meteorology Society and UK Met Office for hosting the conference and good luck to all the young scientists that we met over the two days.

#RMetSImpact

DEkAxGgXkAAmaWE.jpg large

Also thank you to NCAS for funding my conference registration and to all those who provided photos for this post.

Mountains and the Atmospheric Circulation within Models

Email: a.vanniekerk@pgr.reading.ac.uk

Mountains come in many shapes and sizes and as a result their dynamic impact on the atmospheric circulation spans a continuous range of physical and temporal scales. For example, large-scale orographic features, such as the Himalayas and the Rockies, deflect the atmospheric flow and, as a result of the Earth’s rotation, generate waves downstream that can remain fixed in space for long periods of time. These are known as stationary waves (see Nigam and DeWeaver (2002) for overview). They have an impact not only on the regional hydro-climate but also on the location and strength of the mid-latitude westerlies. On smaller physical scales, orography can generate gravity waves that act to transport momentum from the surface to the upper parts of the atmosphere (see Teixeira 2014), playing a role in the mixing of chemical species within the stratosphere.

hims
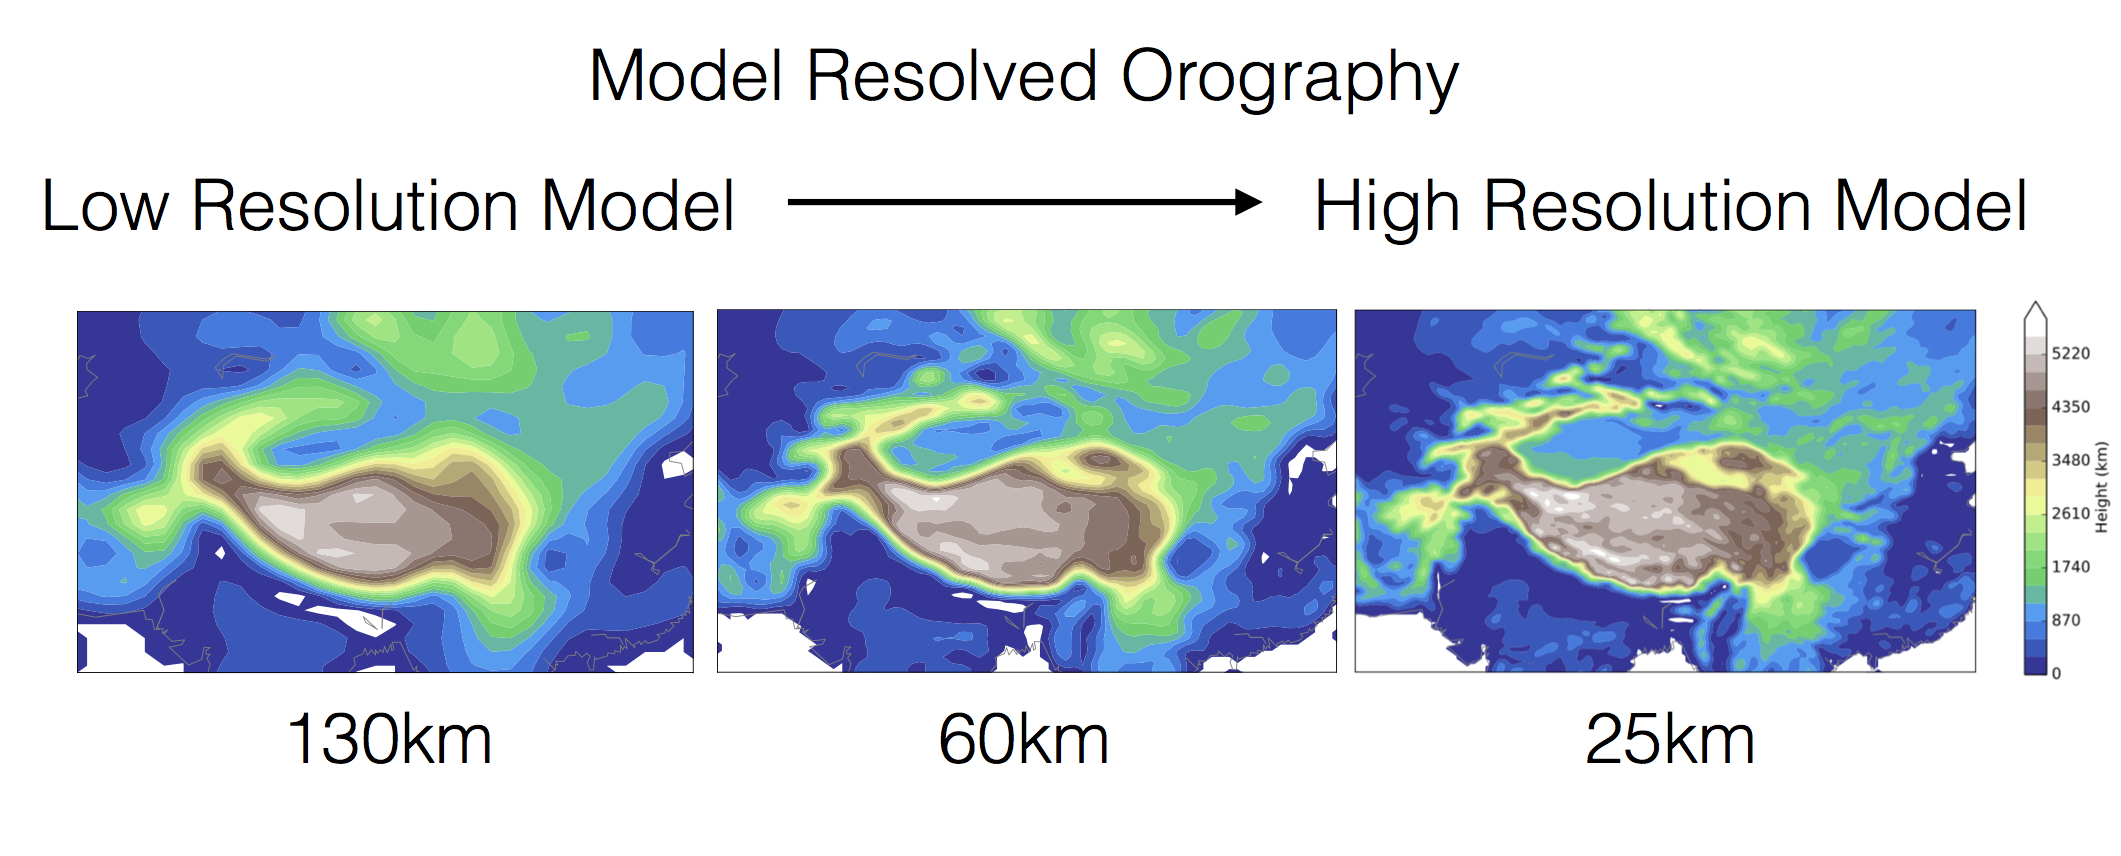
Figure 1: The model resolved orography at different horizontal resolutions. From a low (climate model) resolution to a high (seasonal forecasting) resolution. Note how smooth the orography is at climate model resolution.

Figure 1 shows an example of the resolved orography at different horizontal resolutions over the Himalayas. The representation of orography within models is complicated by the fact that, unlike other parameterized processes, such as clouds and convection, that are typically totally unresolved by the model, its effects are partly resolved by the dynamics of the model and the rest is accounted for by parameterization schemes.However, many parameters within these schemes are not well constrained by observations, if at all. The World Meteorological Organisation (WMO) Working Group on Numerical Experimentation (WGNE) performed an inter-model comparison focusing on the treatment of unresolved drag processes within models (Zadra et al. 2013). They found that while modelling groups generally had the same total amount of drag from various different processes, their partitioning was vastly different, as a result of the uncertainty in their formulation.

Climate models with typically low horizontal resolutions, resolve less of the Earth’s orography and are therefore more dependent on parameterization schemes. They also have large model biases in their climatological circulations when compared with observations, as well as exhibiting a similarly large spread about these biases. What is more, their projected circulation response to climate change is highly uncertain. It is therefore worth investigating the processes that contribute towards the spread in their climatological circulations and circulation response to climate change. The representation of orographic processes seem vital for the accurate simulation of the atmospheric circulation and yet, as discussed above, we find that there is a lot of uncertainty in their treatment within models that may be contributing to model uncertainty. These uncertainties in the orographic treatment come from two main sources:

  1. Model Resolution: Models with different horizontal resolutions will have different resolved orography.
  2. Parameterization Formulation: Orographic drag parameterization formulation varies between models.

The issue of model resolution was investigated in our recent study, van Niekerk et al. (2016). We showed that, in the Met Office Unified Model (MetUM) at climate model resolutions, the decrease in parameterized orographic drag that occurs with increasing horizontal resolution was not balanced by an increase in resolved orographic drag. The inability of the model to maintain an equivalent total (resolved plus parameterized) orographic drag across resolutions resulted in an increase in systematic model biases at lower resolutions identifiable over short timescales. This shows not only that the modelled circulation is non-robust to changes in resolution but also that the parameterization scheme is not performing in the same way as the resolved orography. We have highlighted the impact of parameterized and resolved orographic drag on model fidelity and demonstrated that there is still a lot of uncertainty in the way we treat unresolved orography within models. This further motivates the need to constrain the theory and parameters within orographic drag parameterization schemes.

References

Nigam, S., and E. DeWeaver, 2002: Stationary Waves (Orographic and Thermally Forced). Academic Press, Elsevier Science, London, 2121–2137 pp., doi:10.1016/B978-0-12-382225-3. 00381-9.

Teixeira MAC, 2014: The physics of orographic gravity wave drag. Front. Phys. 2:43. doi:10.3389/fphy.2014.00043 http://journal.frontiersin.org/article/10.3389/fphy.2014.00043/full

Zadra, A., and Coauthors, 2013: WGNE Drag Project. URL:http://collaboration.cmc.ec.gc.ca/science/rpn/drag_project/

van Niekerk, A., T. G. Shepherd, S. B. Vosper, and S. Webster, 2016: Sensitivity of resolved and parametrized surface drag to changes in resolution and parametrization. Q. J. R. Meteorol. Soc., 142 (699), 2300–2313, doi:10.1002/qj.2821. 


The impact of Climate Variability on the GB power system.

Email: h.bloomfield@pgr.reading.ac.uk

Bloomfield et al., 2016. Quantifying the increasing sensitivity of power systems to climate variability. View published paper.

Within the power system of Great Britain (GB), there is a rapidly increasing amount of generation from renewables, such as wind and solar power which are weather-dependent. An increased proportion of weather-dependent generation will require increased understanding of the impact of climate variability on the power system.

blog1

Figure 1: Predicted installed capacity from the National Grid Gone Green Scenario. Source: National Grid Future Energy Scenarios (2015).

Current research on the impact of climate variability on the GB power system is ongoing by climate scientists and power system modellers. The focus of the climate research is on the weather-driven components of the power system, such as the impact of climate variability on wind power generation. These studies tend to include limited knowledge of the whole system impacts of climate variability. The research by power system modellers focuses on the accurate representation of the GB power system. A limited amount of weather data may be used in this type of study (usually 1-10 years) due to the complexity of the power system models.

The aim of this project is to bridge the gap between these two groups of research, by understanding the impact of climate variability on the whole GB power system.In this project, multi-decadal records from the MERRA reanalysis* are combined with a simple representation of the GB power system, of which the weather-dependent components are electricity demand and wind power production. Multiple scenarios are analysed for GB power systems, including 0GW, 15GW, 30GW, and 45GW of installed wind power capacity in the system.

This study characterises the impact of inter-annual climate variability on multiple aspects of the GB power system (including coal, gas and nuclear generation) using a load duration curve framework. A load duration curve can be thought of as a cumulative frequency distribution of power system load. Load can be either power system demand (i.e. the NO-WIND scenario) or demand minus wind power (ie. the LOW, MED and HIGH scenarios).

The introduction of additional wind-power capacity greatly increases the year-year variability in operating opportunity for conventional generators, this is particularly evident for baseload plant (i.e. nuclear power plants). The impact of inter-annual climate variations across the power system due to present-day level of wind-farm installation has approximately doubled the exposure of the GB power sector to inter-annual climate variability. This is shown in Figure 2 as the spread between the red and blue curves (from the LOW scenario) is double that of the black curves (the NO-WIND scenario).

blog2

Figure 2: Load duration curves for the NO-WIND and LOW scenario in black and grey respectively. The two most extreme years from the LOW scenario are 1990 and 2010, plotted in red and blue respectively. Vertical dashed lines show the percentage of time that baseload-plant (91%) and peaking plant (7%) are required to operate

This work has shown that as the amount of installed wind power capacity on the power system is increased, the total amount of energy required from other generators (coal, gas, nuclear) is reduced. Wind therefore contributes to decarbonising the power system, however the reduction is particularly pronounced for plants which are operating as baseload rather than peaking plant (i.e. oil fired generation) where an increase in required production is seen.

This study adds to the literature which suggests that the power system modelling community should begin to take a more robust approach to its treatment of weather and climate data by incorporating a wider range of climate variability.

For more information contact the author for a copy of the paper with details of this work: Quantifying the increasing sensitivity of power system to climate variability (submitted to ERL).

* A reanalysis data set is a scientific method for developing a record of how weather and climate are changing over time. In it, observations are combined with a numerical model to generate a synthesised estimate of the state of the climate system.