Can a 3D radar composite reliably represent ZDR columns?

Brian Lo – brian.lo@pgr.reading.ac.uk 

Differential reflectivity (ZDR) is the difference in measured backscatter from emitted radio waves in the horizontal and vertical polarisations. It is an observable available from dual-polarisation radars. Conventional single-polarisation radars usually offer reflectivity ZH only which is the intensity of backscatter in the horizontal polarization available from conventional radars. The addition of measuring ZDR allows for hydrometeor type classification. In other words, we could tell between large round tumbling hail which gives near zero ZDR from large oblate raindrops that give highly positive ZDR (Kumjian, 2013a). Strong updrafts contribute to severe convective development by lofting large hydrometeors like raindrops into higher parts of the storm, giving ZDR column signatures. A differential reflectivity (ZDR) column is defined as “a region of enhanced ZDR as situated above the 0C level” (Kumjian, 2013b) and are known to be useful in informing forecast warning decisions (e.g. Kuster et al., 2019, 2020).

The UK Met Office has fully upgraded all 15 C-band radars as of January 2018 to have dual-polarisation capabilities. The Met Office also composites data from this radar network to provide three-dimensional gridded products covering the entirety of the UK (Scovell and al-Sakka, 2016). Whereas a single radar would only be able to detect hydrometeors as high as its highest scan elevation, thus leaving the so-called “cone of silence” aloft closest to the radar, the composite permits nearby radars to fill in these regions of missing observations. To harness the greater spatial domain of the 3D radar composite constituting data from multiple overlapping radars, the composite was upgraded to include ZDR to investigate the operational potential of using ZDR columns. But, how do we know ZDR columns can be reliably detected within this 3D radar composite? 

The work described in this post is to verify ZH and ZDR generated by the Met Office compositing process against range-height indicator (RHI) scans from Chilbolton Advanced Meteorological Radar (CAMRa), otherwise known as the world’s largest steerable meteorological research radar (see Figure 1). RHI scans are carried out by varying a radar antenna’s elevation angle but with the azimuth angle held constant. ZDR columns are often narrow features that may challenge the limited resolution (1km in the horizontal) of the radar composite.
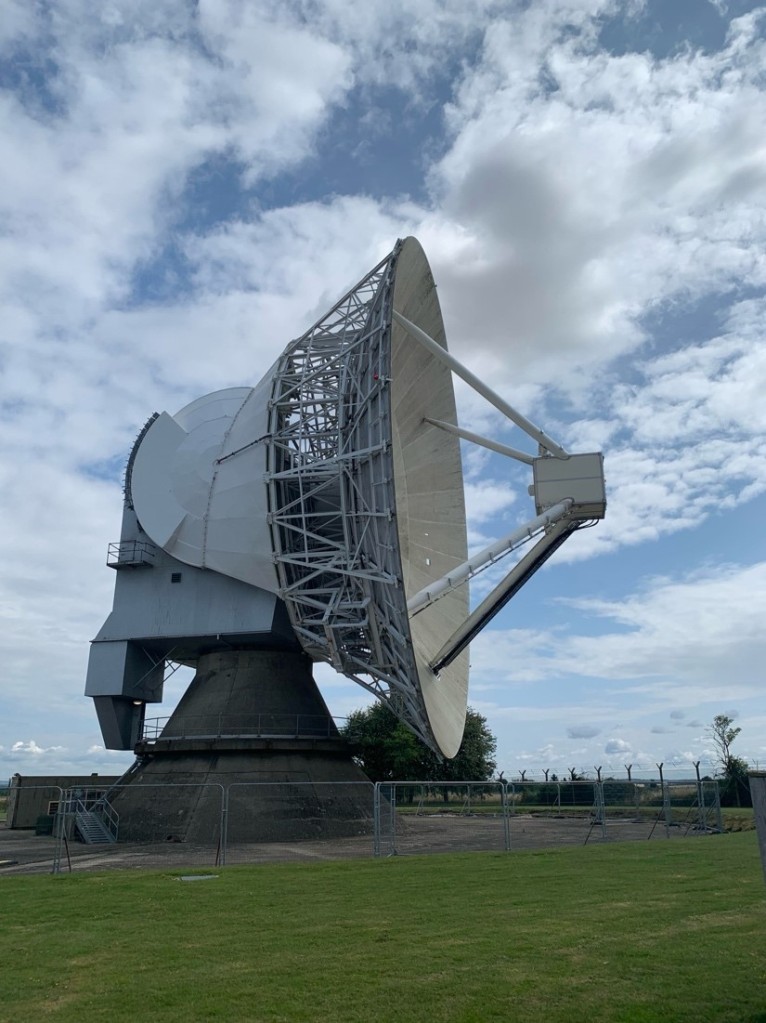
Figure 1: The 25 m antenna of the Chilbolton Advanced Meteorological Radar (CAMRa) located at the Chilbolton Observatory. 

CAMRa is a suitable truth owing to it being well-calibrated to within 0.1dB of ZDR, its extremely narrow beamwidth of 0.28, high range resolution of 75m and high resolution elevations of 0.11deg within RHIs. In contrast, the composite is made of operational radar data of lower resolution and the compositing process could further degrade the accuracy of the data. Thus its ZDR output has to be verified.

Vertical cross sections of the radar composite

Figures 2a and 2d are RHI scans carried out by CAMRa, covering elevations from 0.02 to 10.0. These two figures captured an evolving convective system on 7 June 2016 at 1651Z (Figure 2e) and on 1 October 2019 at 1526Z (Figure 2f). The fine range resolution of 75m captured multiple intense reflectivity cores exceeding 40 dBZ with accompanying overshooting tops.

Figures 2b and 2e are pseudo-RHIs produced from the compositing process of the Chenies and Thurnham operational C-band radars. Both radars were chosen for the compositing process as their overlapping sampling regions offered coverage for the convective system scanned by CAMRa. Instead of generating the usual 3D composite with 1 km and 500 m of horizontal and vertical grid spacing respectively, the compositing software was modified in this verification process to interpolate C-band radar data onto a 2D grid along the CAMRa scan azimuth with the same grid resolutions thus producing the so-called pseudo-RHI plots. 
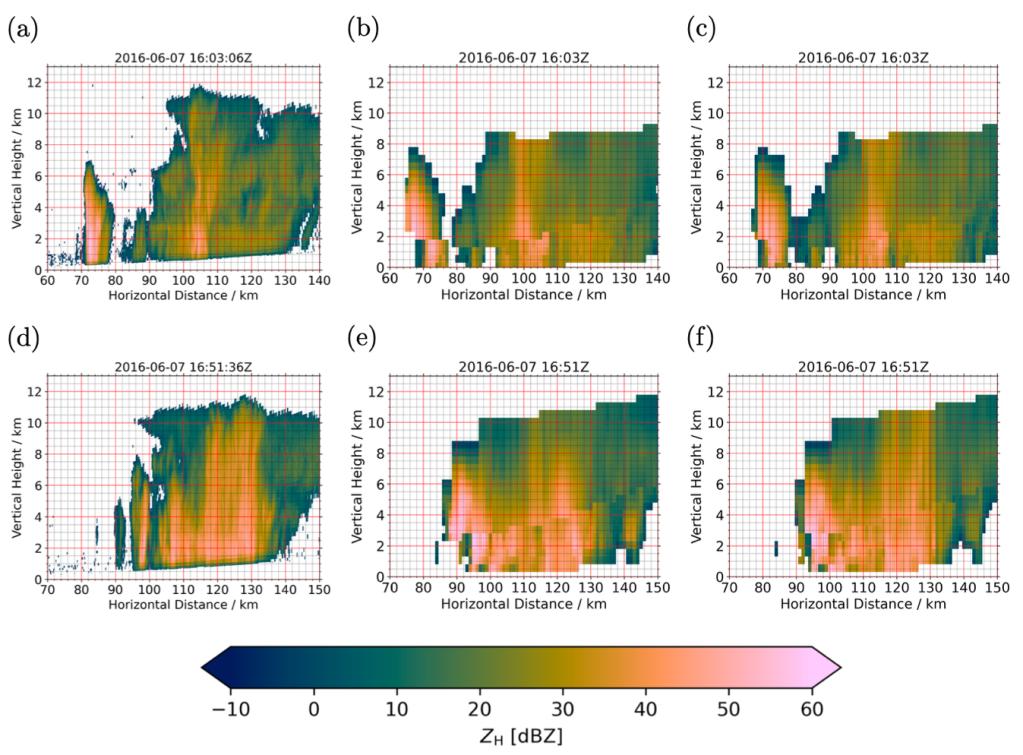
Figure 2: RHI plots of radar reflectivity ZH scanned by CAMRa (a,d) and corresponding pseudo-RHI plots derived from the original Met Office radar compositing process (b,e) and with azimuthal correction applied (c,f). The top and bottom rows each corresponds to observations on 07 June 2016 but at 1603Z and 1651Z respectively. 

However, the preliminary inspection of the pseudo-RHI plots reveals a serious vertical discontinuity of interpolated data. Such an issue would disrupt the automatic detection of vertically extending signatures such as ZDR columns. This problem is seen at around 70 and 100km down range in Figure 1b and 90km down range in Figure 2e. The displacement observed here suggests that the spatial location of storms could be misrepresented on the order of 5 km. What could have caused this problem?

Correction of spatial location of radar beams in compositing software 

Through scrutiny of the Met Office compositing software, I found an error with how radar azimuths were used in the compositing process. In the pre-exisiting compositing software,  radar azimuths would be formulated as azimuthal equidistant projection coordinates relative to the radar site, then directly transformed onto British National Grid coordinates. However, it was overlooked that Met Office radar azimuths are recorded with respect to British National grid north, whereas azimuthal equidistant projection coordinates require azimuths to be relative to true north. The deviations of up to a few degrees between the norths can lead to a horizontal displacement of radar data of at least a few kilometres at a range of 100km from a radar site. Lesson learnt: Attention to small details can have a large impact later on! 

To fix this problem, grid convergence (Ordnance Survey, 2018) is added to all radar azimuths such that radar azimuths are adjusted with respect to true north before undergoing transformation into British National Grid coordinates. The effect of implementing such a correction can be seen in Figures 1c and 1f, where reflectivity values interpolated from two separate C-band radars result in a vertically continuous intense reflectivity core. There could still be mismatches on a smaller scale owing to radar scans happening at different times while the storm was being advected. With the radar composite corrected, is ZDR well represented? 

Visual comparison of ZDR

Both Chenies and Thurnham radars used for generating pseudo-RHIs were upgraded to have dual polarimetric capability since March 2013. This allows the generation of ZDR pseudo-RHI plots as shown in Figures 2c and 2b, which can be qualitatively compared with CAMRa scans in Figures 2a and 2d on 7 June 2016 at 165136Z and on 1 October 2019 at 152641Z respectively.
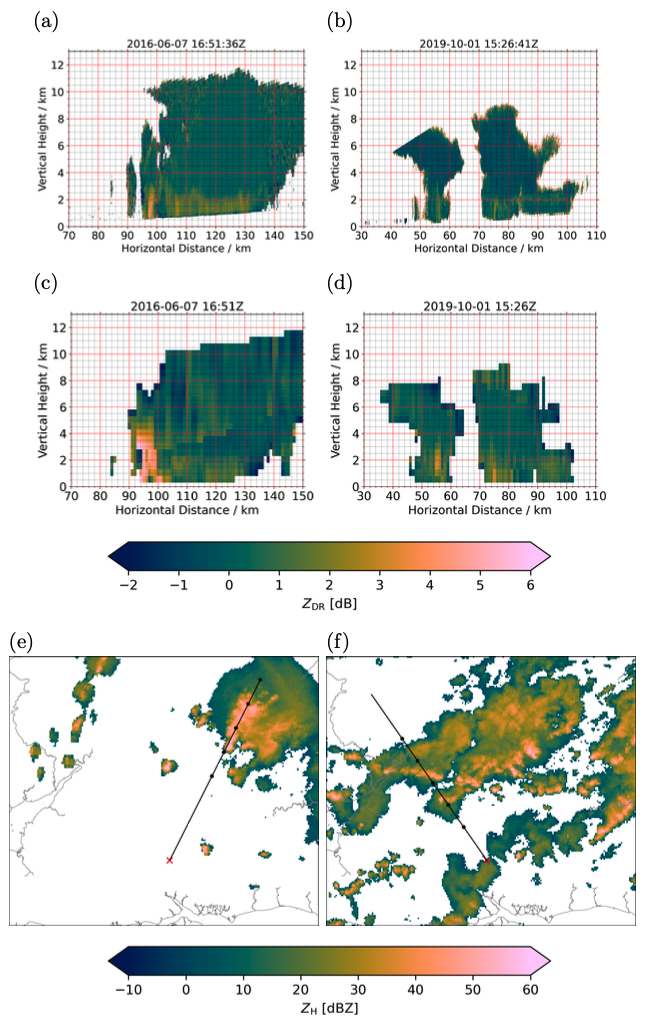
Figure 3: RHI plots of radar differential reflectivity ZDR scanned by CAMRa (a,b), corresponding pseudo-RHI plots derived from the radar composite (c,d) and MAXDBZ plan views in (e,f). In the plan views, the red cross marks the position of CAMRa. The black line is the azimuth of CAMRa for the RHI scan. Black dots are separated by 20km with the first and last black dot corresponding to the plotted range of the RHIs. The top and bottom rows each corresponds to observations on 07 June 2016 at 1651Z and 01 Oct 2019 at 1526Z respectively. The freezing height was 3.0 km in the June case and 2.2 km in the October case. 

Considering the observed ZDR column is approximately 95 km down range from the radar, a displacement of 0.6is 1km of distance in the horizontal. Such a distance corresponds to the sampling resolution of the radar composite. The C-band operational radars also have a wider beamwidth of 1.1and are unable to observe fine details unless the ZDR column is situated close to one of the radars. Thus, the discrepancy in intensity and height in Figure 2 is expected, owing to the differences in sampling resolutions between CAMRa and the radar composite. The operational radar composite, which combines measurements from radars at various ranges, is capable of detecting ZDR column features at a coarser resolution, whereas CAMRa is used to study fine details of the column structures with high precision in individual case studies. 

We have shown that outputs from CAMRa captured sub-kilometre features such as the width of ZDR columns and their horizontal structures within a cell are too fine to be resolved by the composite. Despite the resolution limitations of operational radars and having done other tests not mentioned in this post, we are confident that the radar composite can be exploited to reliably capture the presence of ZDR columns at a horizontal spatial resolution of 1 km alongside an indication of their maximum heights. 

References

Kumjian, M. R. (2013a). “Principles and Applications of Dual-Polarization Weather Radar. Part I: Description of the Polarimetric Radar Variables”. Journal of Operational Meteorology 1.20, pp. 243–264. doi:10.15191/nwajom.2013.0120 

Kumjian, M. R. (2013b). “Principles and applications of dual-polarization weather radar. Part II: Warm- and cold-season applications”. Journal of Operational Meteorology 1.20, pp. 243–264. doi:10.15191/nwajom.2013.0120 

Kuster, C. M. et al. (2019). “Rapid-update radar observations of ZDR column depth and its use in the warning decision process”. Weather and Forecasting 34.4, pp. 1173–1188. doi: 10.1175/WAF-D-19-0024.1 

Kuster, C. M. et al. (2020). “Using ZDR Columns in Forecaster Conceptual Models and Warning Decision Making”. Weather and Forecasting, pp. 1–43. doi: 10.1175/WAF- D-20-0083.1 Ordnance Survey (2018). A Guide to Coordinate Systems in Great Britain. Accessed: 16-1-2024 

Scovell, R. and H. al-Sakka (2016). “A Point Cloud Method for Retrieval of High-Resolution 3D Gridded Reflectivity from Weather Radar Networks for Air Traffic Management”. Journal of Atmospheric and Oceanic Technology 33.3, pp. 461–479. doi: https://doi.org/10.1175/JTECH-D-15-0051.1 

MeteoXchange 

Supporting International Collaboration for Early Career Researchers 

James Fallon – j.fallon@pgr.reading.ac.uk 
 

What is it? 

Due to lockdowns and travel restrictions since 2020, networking opportunities in science have been transformed. We can expect to see a mix of virtual and hybrid elements persist into the future, offering both cost-saving and carbon-saving benefits. 

The MeteoXchange project aims to become a new platform for young atmospheric scientists from all over the world, providing networking opportunities and platforms for collaboration. The project is an initiative of German Federal Ministry of Education and Research, and research society Deutsche Forschungsgesellschaft. Events are conducted in English, and open to young scientists anywhere. 

ECS Conference 

This year marked the first ever MeteoXchange conference, which took place online in March 2022. The ECS (early career scientists) conference took place over two days, on gather.town. An optional pre-conference event gave the opportunity for new presenters to work on presentation skills and receive feedback at the end of the main conference. 

Figure 1: Conference Schedule, including a keynote on Machine Learning and Earth System Modelling, movie night, and presenter sessions. 

Five presenter sessions were split over two days, with young scientists sharing their research to a conference hall on the virtual platform gather.town. Topics ranged from lidar sensing and reanalysis datasets, to cloud micro-physics and UV radiation health impacts. I really enjoyed talks on the attribution of ‘fire weather’ to climate change, and machine learning techniques for thunderstorm forecasting! The first evening concluded with a screening of documentary Picture a Scientist

During the poster session on the second day, I presented my research poster to different scientists walking by my virtual poster board. Posters were designed to mimic the large A2 printouts seen at in-person events. Two posters that really stood out were a quantification of SO2 emissions from Kilauea volcano in Hawaii, and an evaluation of air quality in Cuba’s Mariel Bay using meteorological diagnostic models combined with air dispersion modelling. 

Anticipating that it might be hard to communicate on the day, I added a lot of text to my poster. However, I needn’t have worried as the virtual platform worked flawlessly for conducting poster Q&A – the next time I present on a similar platform I will try to avoid using as much text and instead focus on a more traditional layout! 

Figure 2: During the poster session, I presented my research on Reserve-Power systems – energy-volume requirements and surplus capacity set by weather events. 

By the conference end, I got the impression that everyone had really enjoyed the event! Awards were given for the winners of the best posters and talks. The ECS conference was fantastically well organised by Carola Detring (DWD) and Philipp Joppe (JGU Mainz), and a wonderful opportunity to meet researchers from around the world. 

MeteoMeets 

Since July 2021, MeteoXchange have held monthly meetups, predominantly featuring lecturers and professors who introduce research at their institute for early career scientists in search of opportunities! 

The opportunities shared at MeteoMeets are complemented by joblists and by the MeteoMap: https://www.meteoxchange.de/meteomap. The MeteoMap lists PhD and postdoc positions across Germany, neatly displayed with different markers depending on the type of institute. This resource is currently still under construction. 

Figure 3: The MeteoMap features research opportunities in Germany, available for early career researchers from across the world. 

Travel Grants 

One of the most exciting aspects of the MeteoXchange project is the opportunity for international collaboration with travel grants! 

The travel funds offered by MeteoXchange are for two or more early career scientists in the field of atmospheric sciences. Students must propose a collaborative project, which aims to spark future work and networking between their own institutions. If the application is successful, students have the opportunity to access 2,500€ for travel funds.  

Over the last two weeks of April, I will be collaborating with KIT student Fabian Mockert  on “Dunkelflauten” (periods of low-renewable energy production, or “dark wind lulls”). Dunkelflauten, especially cold ones, result in high electricity load on national transmission networks, leading to high costs and potentially cause a failure of a fully renewable power system doi.org/10.1038/nclimate3338. We are collaborating to use power system modelling to better understand how this stress manifests itself. Fabian will spend two weeks visiting the University of Reading campus, meeting with students and researchers from across the department. 

Get Involved 

The 2022 travel grant deadline has already closed; however, it is hoped that MeteoXchange will receive funding to continue this project into future years, supporting young researchers in collaboration and idea-exchange. 

To get involved with the MeteoMeets, and stay up to date on MeteoXchange related opportunities, signup to the mailing list

Presenting in Ponte Vedra, Florida – 33rd Conference on Hurricanes and Tropical Meteorology

Email: j.f.talib@pgr.reading.ac.uk

You’ve watched many speak before you. You’ve practised your presentation repeatedly. You’ve spent hours, days, months, and sometimes years, understanding your scientific work. Yet, no matter the audience’s size or specialism, the nerves always creep in before a presentation. It’s especially no different at your first international conference!

IMG_20180420_133234

Between the 16th and 20th April 2018, me, Jonathan Beverley and Bethan Harris were fortunate enough to attend and present at the American Meteorological Society 33rd Conference on Hurricanes and Tropical Meteorology in Ponte Vedra, Florida. For each of us, our first international conference!

Being a regular user of Instagram through the conference, especially the Instagram Story function, I was regularly asked by my friends back home, “what actually happens at a scientific conference”? Very simple really – scientists from around the world, from different departments, universities, and countries, come to share their work, in the hope of progressing the scientific field, to learn from one another, and network with future collaborators. For myself, it was an opportunity to present recently submitted work and to discuss with fellow researchers on the important questions that should be asked during the rest of my PhD. One outcome of my talk for example, was a two-hour discussion with a graduate student from Caltech, which not only improved my own work, but also helped me understand other research in global circulation.

Recordings of the presentations given by University of Reading PhD students can be found at:

Alongside presenting my own work, I had the opportunity to listen and learn from other scientific researchers. The conference had oral and poster presentations from a variety of tropical meteorology subject areas including hurricanes, global circulation, sub-seasonal forecasting, monsoons and Madden-Julian Oscillation. One of the things that I most enjoy at conferences is to hear from leading academics give an overview of certain topic or issue. For example, Kerry Emanuel spoke on the inferences that can be made from simple models of tropical convection. Through applying four key principles of tropical meteorology including the weak temperature gradient approximation and conservation of free-tropospheric moist static energy, we can understand tropical meteorology processes including the Intertropical Convergence Zone, Walker circulation and observed temperature and humidity profiles.

Of course, if you’re going to fly to the other side of the pond, you must take advantage of being in the USA. We saw a SPACEX rocket launch, (just at a distance of 150 miles away,) experienced travelling through a squall line, visited the launch sites of NASA’s first space programs, and explored the sunny streets of Miami. It was a great privilege to have the opportunity to present and attend the AMS 33rd Conference on Hurricanes and Tropical Meteorology, and I am hugely thankful to NERC SCENARIO DTP and the Department of Meteorology for funding my work and travel.


VMSG and COMET 2018 (or a Tale of Two Conferences)

The Volcanic and Magmatic Studies Group (VMSG) held a conference from the 3-6th of January in Leeds. The Centre for Observation and Modelling of Earthquakes, Volcanoes and Tectonics (COMET) held a student conference from 8-9th January in Cambridge. It was a conference double-whammy about all things volcanic – heaven!

VMSG is a joint special interest group of the Mineralogical Society of Great Britain and Ireland and the Geological Society of London. The VMSG conference is a fairly small affair, with about 200 in attendance, and it brings together research in geochemistry, seismology, volcanology and related fields. Because of its size, it’s a nice informal space where there is a focus on students presenting their work to the VMSG community, but anyone is free to present their research.

Talks ranged from how tiny fossils, called diatoms, became trapped in a pyroclastic density current, to modelling of lava domes, to how local people interact with the volcano they live on at Masaya, to every aspect of volcanology you can think of. The final talk was definitely a highlight – with everyone in 3D glasses to look at volcanic plumes across Russia, it really brought the satellite images to life (and we got to keep the glasses).

90 posters on a variety of topics were presented, the majority of which were by students (I was one of them). There was of course an obligatory dinner and disco to round off the second day of talks, and a great chance to network with other people from VMSG.

For the best poster title of the conference, you need look no further than this gem.

The conference also provides workshops on different aspects of research, with sessions on writing papers, diffusion modelling and InSAR to name a few. These were hosted on the 6th at the University of Leeds Environment and Earth Sciences Department, and comprised a full day of talks and labs so you could get to grips with the techniques you were being shown. I attended the InSAR workshop, which gave a good introduction to the topic of comparing two satellite images and seeing where the ground had moved. There was also a session on deformation modelling in the afternoon and playing with bits of code.

26771981_1615887968434336_143604950_o
An afternoon of modelling InSAR deformations and code – hill-arity ensued.

Then it was onto the second leg of the conferences, which took the action to Cambridge, where students that are part of COMET met up to discuss work and attend talks from 8-9th January.

26732711_1615887681767698_951066323_o
Gneiss weather in Cambridge!

COMET is a National Environment Research Council Centre of Excellence, it comprises a group of researchers that uses remote and ground sensed data and models to study earthquakes and volcanoes. They also work with the British Geological Survey and the European Space Agency, and fund PhD projects in related fields.

The meet-up of students comprised two days of talks from students, with some keynote speakers who had been past members of COMET that had gone on to careers outside of academia. The talks from second and third years included: remote sensing and InSAR being used to examine tectonic strain in the East African Rift Valley and slip (movement) rates along faults in Tibet, modelling how gas bubbles in magma change the more crystals you add to the magma, and using cosmogenic isotopes to work out slip rates on a fault in Italy.

26695576_1615887065101093_724648553_o
The Department had cabinets and cabinets of samples that rocked.

First years are also given the chance to give a talk lasting 5 minutes, so I filled people in on what I’d been up to in the past four months – lots of data collection! My project will be using satellite data to look at the varied eruption behaviour of Bagana volcano in Papua New Guinea, with a view to modelling this behaviour to better understand what causes it. Bagana has a tendency to send out thick lava flows in long pulses and let out lots of gas, and occasionally then violently erupt and let out lots of ash and hot pyroclastic density currents. But it is very understudied, as it is so remote – so there’s lots still to be learnt about it!

26736005_1616717381684728_2011570642_o
Me with my poster (I’ve run out of geology puns).

The meet-up also included a fancy meal in Pembroke College’s Old Library, with candles and it felt a bit like being at Hogwarts! Then it was back to Reading, thoroughly worn out, but with lots of ideas and many useful contacts – VMSG2019 is in St. Andrews and I can’t wait.

Quo Vadis 2017

“Quo Vadis”, Latin for “where are you going?”, is an annual event held in the Department of Meteorology in which 2nd year PhD students present their work as if they were in an international conference.  In addition to providing the opportunity for students to present their research in a professional yet friendly environment, Quo Vadis has an emphasis on where on-going research is heading (as its name suggests).  Over the years presenters have always walked away with constructive feedback on their presentation style and scientific work, and occasionally, a new collaboration with someone in the audience!

This year’s Quo Vadis was held on 1st February, 2017.  26 excellent talks covering a wide range of meteorology-related topics were delivered by PhD students in their 2nd year in the one-day event.  A full schedule of the event can be found here.  The morning sessions covered topics such as Atmospheric Dynamics, Tropical Meteorology and Space Weather, whereas the afternoon sessions focused on Oceanography, Climate Change, Urban Meteorology and Data Assimilation.

Every year a winning talk is selected based on criteria including knowledge of the subject, methods and innovativeness, results, presentation style and ability to answer questions.  This has always been a tough job for the evaluation committee formed by staff members, as our students tend to be very good at presenting their cutting edge research!

This year’s Quo Vadis winner is Christoph Kent.  He gave an excellent presentation on representing surface roughness in urban areas to determine the vertical wind profile above the surface.  Understanding wind in urban areas is essential to stakeholders in sectors such as renewable energy, construction and many more.  In addition to the winner, 3 honourable mentions were made.  They went to Jonathan Beverley, Thomas Eldridge and Elizabeth Cooper, whose talks were about the influence of Asian summer monsoon on European summer weather, the use of the Temperature Humidity Infrared Radiometer, and the use of data assimilation to improve flood prediction, respectively.

At the end of the event a buffet was served to thank all our speakers and the evaluation committee, congratulate the well-deserved winner and honourable mentions, as well as to celebrate research excellence of the Department of Meteorology.  Quo Vadis 2017 was a huge success, you can find out more about the event on our Twitter account @SocialMetwork, or under the hashtag #QuoVadis2017.

What will make the public and politicians take climate change seriously?

slide1

Email: j.f.talib@pgr.reading.ac.uk

Imagine you’re creating a problem that we don’t understand. A problem where the majority of people just go, “meh, not important, I don’t really get it”.

What would it look like?

It would be complex, uncertain, something in the future and possibly an issue that was geographically distant.

Now those factors should you remind of climate change, and on 5th October 2016 the South-East Royal Meteorological Society local centre hosted a meeting where a panel of experts were presented with the question, “What will make the public and politicians take climate change seriously?”

The panel included professionals from a range of backgrounds including Professor Sir Brian Hoskins, leading expert in meteorology and climate, and first director of the Grantham Institute for Climate Change, Imperial College London. Dr Rachel McCloy a well-respected figure in behavioural science with experience in policy making in the former Department of Energy and Climate Change and the Treasury. Finally, Paul Simons a prominent journalist for the Times known for the depth of scientific understanding in his articles.

Images taken during the RMetS South East local centre meeting (06/10/16). Left image: Panelists (from left to right) including Dr Rachel McCloy, Sir Brian Hoskins and Paul Simons.

Sir Brian Hoskins opened the discussion with the challenge that we have a responsibility to “encourage” rather than “make” the public take climate change seriously, and recognised the progress in politics including targets announced in COP21, Paris and the UK Climate Change Act 2008. However, it was also recognised that climate change may not be prioritised high enough in political agendas, and the question was raised on whether governments take their environmental global responsibility seriously enough?

Discussion then moved onto personal actions each one of us can take to increase the public response. Repeating the “doom and gloom” message over climate change can become boring and repetitive, and we need to bring a positive message to tackling this global issue. We also need to recognise the responsibility of the individual in a global context and introduce small steps that can be taken to reduce our environmental impact.

One key message from Brian’s talk, and the meeting as whole, was that it’s currently hard for a member of the public to understand what climate change actually means to their daily lives. What impact will a 2°C global temperature rise actually cause? Researchers, the media and policymakers need to relate the science of global warming to our everyday lives, whether that’s through health, nutrition, the working environment, or air quality to name a few.

Our second speaker, Dr Rachel McCloy, introduced psychological behavioural frameworks that are introduced by climate change and how they impact the progression towards successful mitigation. For example, emotional reactions towards climate change can include dread and injustice, and this combined with typical adjectives used to describe the environmental changes including “natural” and “uncontrollable”, can lead to an increased likelihood of no effort being taken at all against climate change.

A component of Rachel’s talk I found particularly interesting was the impact of over-congratulating individuals and societies for taking “baby steps”. When we congratulate or applaud an action too much it reduces the likelihood of an even better action taking place. Therefore, as a society, we need to keep looking at the next step to mitigating against climate change. If we think about this in the present day, could we agree that we congratulated the agreements met in COP21 Paris too much, and as a result the likelihood of ratification and progress being made has been dropped. We as a community need to hold each other to account even when those “baby steps” have been made.

And finally, Paul, a leading science journalist for The Times, brought to the discussion how the media can be used to encourage climate change to be taken seriously. Everything in the media is a story and when a phenomena such climate change impacts health, water or even transportation it can gain a public interest. To increase the media’s attention to climate change, greater emphasis is needed on how environmental changes will impact our daily lives. Paul also reminded us that the public have begun to associate extreme weather events to climate change, whether proven to be a result of anthropogenic action or not. A recent example that comes to my mind is the recent European thunderstorms that occurred last summer. The media should be used to successfully “shape opinions” and it is up to us to grasp the opportunities that they have to offer.

After an intriguing set of three short talks to answer the question “What will make the public and politicians take climate change seriously?”, discussion was opened to the audience. Questions included: What is the importance of education to solving climate change? How much advocacy work should a climate scientist get involved in? The meeting as a whole stimulated a continued discussion on how climate change can be communicated effectively to “encourage” the public and politicians to take climate change seriously.

I would like to thank all three panellists for a set of thought-provoking and challenging talks. Thank you to the Royal Meteorological Society for supporting the local centre event, and to find out more about meetings taking place in your region check out https://www.rmets.org/events/forthcoming-meetings.