Email: h.bloomfield@pgr.reading.ac.uk
Bloomfield et al., 2016. Quantifying the increasing sensitivity of power systems to climate variability. View published paper.
Within the power system of Great Britain (GB), there is a rapidly increasing amount of generation from renewables, such as wind and solar power which are weather-dependent. An increased proportion of weather-dependent generation will require increased understanding of the impact of climate variability on the power system.
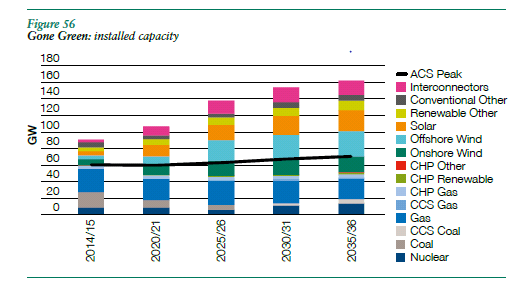
Figure 1: Predicted installed capacity from the National Grid Gone Green Scenario. Source: National Grid Future Energy Scenarios (2015).
Current research on the impact of climate variability on the GB power system is ongoing by climate scientists and power system modellers. The focus of the climate research is on the weather-driven components of the power system, such as the impact of climate variability on wind power generation. These studies tend to include limited knowledge of the whole system impacts of climate variability. The research by power system modellers focuses on the accurate representation of the GB power system. A limited amount of weather data may be used in this type of study (usually 1-10 years) due to the complexity of the power system models.
The aim of this project is to bridge the gap between these two groups of research, by understanding the impact of climate variability on the whole GB power system.In this project, multi-decadal records from the MERRA reanalysis* are combined with a simple representation of the GB power system, of which the weather-dependent components are electricity demand and wind power production. Multiple scenarios are analysed for GB power systems, including 0GW, 15GW, 30GW, and 45GW of installed wind power capacity in the system.
This study characterises the impact of inter-annual climate variability on multiple aspects of the GB power system (including coal, gas and nuclear generation) using a load duration curve framework. A load duration curve can be thought of as a cumulative frequency distribution of power system load. Load can be either power system demand (i.e. the NO-WIND scenario) or demand minus wind power (ie. the LOW, MED and HIGH scenarios).
The introduction of additional wind-power capacity greatly increases the year-year variability in operating opportunity for conventional generators, this is particularly evident for baseload plant (i.e. nuclear power plants). The impact of inter-annual climate variations across the power system due to present-day level of wind-farm installation has approximately doubled the exposure of the GB power sector to inter-annual climate variability. This is shown in Figure 2 as the spread between the red and blue curves (from the LOW scenario) is double that of the black curves (the NO-WIND scenario).
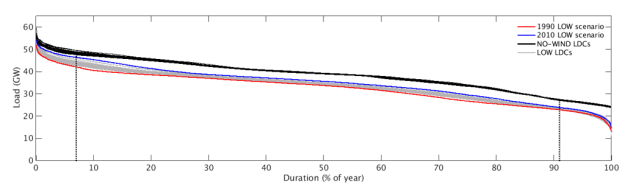
Figure 2: Load duration curves for the NO-WIND and LOW scenario in black and grey respectively. The two most extreme years from the LOW scenario are 1990 and 2010, plotted in red and blue respectively. Vertical dashed lines show the percentage of time that baseload-plant (91%) and peaking plant (7%) are required to operate
This work has shown that as the amount of installed wind power capacity on the power system is increased, the total amount of energy required from other generators (coal, gas, nuclear) is reduced. Wind therefore contributes to decarbonising the power system, however the reduction is particularly pronounced for plants which are operating as baseload rather than peaking plant (i.e. oil fired generation) where an increase in required production is seen.
This study adds to the literature which suggests that the power system modelling community should begin to take a more robust approach to its treatment of weather and climate data by incorporating a wider range of climate variability.
For more information contact the author for a copy of the paper with details of this work: Quantifying the increasing sensitivity of power system to climate variability (submitted to ERL).
* A reanalysis data set is a scientific method for developing a record of how weather and climate are changing over time. In it, observations are combined with a numerical model to generate a synthesised estimate of the state of the climate system.
