Gristey, J. J., J. C. Chiu, R. J. Gurney, S.-C. Han, and C. J. Morcrette (2017), Determination of global Earth outgoing radiation at high temporal resolution using a theoretical constellation of satellites, J. Geophys. Res. Atmos., 122, doi:10.1002/2016JD025514.
Email: J.Gristey@pgr.reading.ac.uk Web: http://www.met.reading.ac.uk/~fn008822/
The surface of our planet has warmed at an unprecedented rate since the mid-19th century and there is no sign that the rate of warming is slowing down. The last three decades have all been successively warmer than any preceding decade since 1850, and 16 of the 17 warmest years on record have all occurred since 2001. The latest science now tells us that it is extremely likely that human influence has been the dominant cause of the observed warming1, mainly due to the release of carbon dioxide and other greenhouse gases into our atmosphere. These greenhouse gases trap heat energy that would otherwise escape to space, which disrupts the balance of energy flows at the top of the atmosphere (Fig. 1). The current value of the resulting energy imbalance is approximately 0.6 W m–2, which is more than 17 times larger than all of the energy consumed by humans2! In fact, observing the changes in these energy flows at the top of the atmosphere can help us to gauge how much the Earth is likely to warm in the future and, perhaps more importantly, observations with sufficient spatial coverage, frequency and accuracy can help us to understand the processes that are causing this warming.

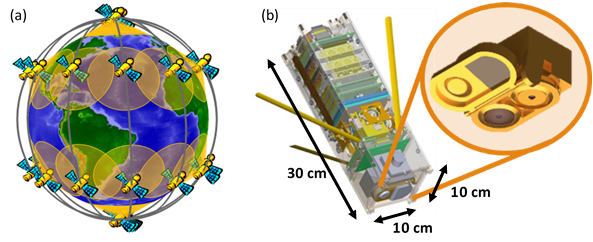
Observations of energy flows at the top of the atmosphere have traditionally been made by large and expensive satellites that may be similar in size to a large car3, making it impractical to launch multiple satellites at once. Although such observations have led to many advancements in climate science, the fundamental sampling restrictions from a limited number of satellites makes it impossible to fully resolve the variability in the energy flows at the top of atmosphere. Only recently, due to advancements in small satellite technology and sensor miniaturisation, has a novel, viable and sustainable sampling strategy from a constellation of satellites become possible. Importantly, a constellation of small satellites (Fig. 2a), each the size of a shoe-box (Fig. 2b), could provide both the spatial coverage and frequency of sampling to properly resolve the top of atmosphere energy flows for the first time. Despite the promise of the constellation approach, its scientific potential for measuring energy flows at the top of the atmosphere has not been fully explored.

Also investigated are potential issues that could restrict similar uncertainties being achieved in reality such as instrument calibration and a reduced number of satellites due to limited resources. Not surprisingly, the success of the approach will rely on calibration that ensures low systematic instrument biases, and on a sufficient number of satellites that ensures dense hourly sampling of the globe. Development and demonstration of miniaturised satellites and sensors is currently underway to ensure these criteria are met. Provided good calibration and sufficient satellites, this study demonstrates that the constellation concept would enable an unprecedented sampling capability and has a clear potential for improving observations of Earth’s energy flows.
This work was supported by the NERC SCENARIO DTP grant NE/L002566/1 and co-sponsored by the Met Office.
Notes:
1 This statement is quoted from the latest Intergovernmental Panel on Climate Change assessment report. Note that these reports are produced approximately every 5 years and the statements concerning human influence on the climate have increased in confidence in every report.
2 Total energy consumed by humans in 2014 was 13805 Mtoe = 160552.15 TWh. This is an average power consumption of 160552.15 TWh / 8760 hours in a year = 18.33 TW
Rate of energy imbalance per square metre at top of atmosphere is = 0.6 W m–2. Surface area of “top of atmosphere” at 80 km is 4 * pi * ((6371+80)*103 m)2 = 5.23*1014 m2. Rate of energy imbalance for entire Earth = 0.6 W m–2 * 5.23*1014 m2 = 3.14*1014 W = 314 TW
Multiples of energy consumed by humans = 314 TW / 18.33 TW = 17
3 The satellites currently carrying instruments that observe the top of atmosphere energy flows (eg. MeteoSat 8, Aqua) will typically also be hosting a suite of other instruments, which adds to the size of the satellite. However, even the individual instruments are still much larger that the satellite shown in Fig. 2b.
4 Currently, the single most accurate way to determine the top-of-atmosphere energy imbalance is to infer it from changes in ocean heat uptake. The reasoning is that the oceans contain over 90% of the heat capacity of the climate system, so it is assumed on multi-year time scales that excess energy accumulating at the top of the atmosphere goes into heating the oceans. The stated value of 0.6 W m–2 is calculated from a combination of ocean heat uptake and satellite observations.
References:
Allan et al. (2014), Changes in global net radiative imbalance 1985–2012, Geophys. Res. Lett., 41, 5588–5597, doi:10.1002/2014GL060962.
Barnhart et al. (2009), Satellite miniaturization techniques for space sensor networks, Journal of Spacecraft and Rockets, 46(2), 469–472, doi:10.2514/1.41639.
IPCC (2013), Climate Change 2013: The Physical Science Basis, available online at https://www.ipcc.ch/report/ar5/wg1/.
NASA (2016), NASA, NOAA Data Show 2016 Warmest Year on Record Globally, available online at https://www.nasa.gov/press-release/nasa-noaa-data-show-2016-warmest-year-on-record-globally.
Sandau et al. (2010), Small satellites for global coverage: Potential and limits, ISPRS J. Photogramm., 65, 492–504, doi:10.1016/j.isprsjprs.2010.09.003.
Swartz et al. (2013), Measuring Earth’s Radiation Imbalance with RAVAN: A CubeSat Mission to Measure the Driver of Global Climate Change, available online at https://earthzine.org/2013/12/02/measuring-earths-radiation-imbalance-with-ravan-a-cubesat-mission-to-measure-the-driver-of-global-climate-change/.
Swartz et al. (2016), The Radiometer Assessment using Vertically Aligned Nanotubes (RAVAN) CubeSat Mission: A Pathfinder for a New Measurement of Earth’s Radiation Budget. Proceedings of the AIAA/USU Conference on Small Satellites, SSC16-XII-03
