Weather and climate processes are fundamentally driven by energy flows within the Earth-atmosphere system. Incoming solar radiation is absorbed and scattered by gases and aerosols within the atmosphere and absorbed and re-emitted by the Earth’s surface. We therefore need to know how much energy is absorbed by the atmosphere and the height at which this radiation is absorbed.
Currently, we know to reasonable accuracy and precision where most of this energy is accounted for (what we call the global energy budget).

Some of the values on the above figure (Figure 1) are highlighted in purple – this indicates that the relative uncertainty (i.e. the range in which this value might plausibly be) on these values is rather high. Reducing the uncertainty on these values is important: this will improve the accuracy of models we use to determine weather and climate. This is achieved by advances in modelling techniques, or in the case of my PhD improvements in available measurements of processes in the atmosphere.
My PhD work focuses on the components circled above, the short-wave atmospheric absorption (i.e. solar energy which is absorbed by the atmosphere as it travels from the Sun toward the surface), and on the incoming solar radiation. The latter of these has a small uncertainty, but this does not quite tell the whole story. The spectral distribution (i.e. at what wavelengths this radiation is emitted) of this energy is also extremely important, since the atmosphere is more transparent at some wavelengths than others.

My work focuses on the “near-infrared” spectral region, between about 1-5 μm (or 2000-10000 cm-1) . This region, as can be seen in the above figure, has a “band-window” structure, where parts of the spectrum are completely opaque to radiation, but other parts are almost entirely transparent. Solar radiation with the same wavelength as these band regions where the absorption is strongest will therefore be deposited in the upper atmosphere, while radiation within the windows will be absorbed throughout the atmosphere and by the surface. This structure is almost entirely due to absorption by water vapour.
It is therefore extremely important to characterise the absorption in these windows as much as possible, since any additional absorption will affect where in the atmosphere solar energy is absorbed (unlike additional absorption in the band regions which will barely affect where in the atmosphere this absorption takes place).
Figure 2 also shows the water vapour continuum; a component of absorption which is not currently fully understood. This absorption is a phenomenon not fully accounted for by the theory of water vapour absorption; currently we model it using the MT_CKD model (named such after its creators). The strength of this absorption may be significantly stronger than this model however; laboratory measurements show differences of up to a factor of 100 in the strength at about 1.6 μm!
It is believed (e.g. Radel et al. (2013)) that an increased continuum could contribute about 3 W m-2 to the overall shortwave atmospheric absorption; a significant portion of the 10 W m-2 uncertainty in Figure 1.
My work attempts to resolve this using direct measurements of solar radiation in this 2000-10000 cm-1 region using a Fourier Transform spectrometer, made by the National Physical Laboratory at a site at Camborne, Cornwall, UK. There are a number of challenges making such measurements in the atmosphere; the instrument needs to be properly calibrated, and the conditions in the atmosphere (specifically temperature, pressure, humidity and aerosols) need to be well characterised. This is done using contemporaneous measurements using a radiosonde (to measure the atmospheric profile) and a sunphotometer (to measure aerosol optical depth). These radiosonde measurements are then put into a line-by-line radiation code to calculate the atmospheric optical depth, and these two contributions are subtracted from the total optical depth to get the continuum optical depth.
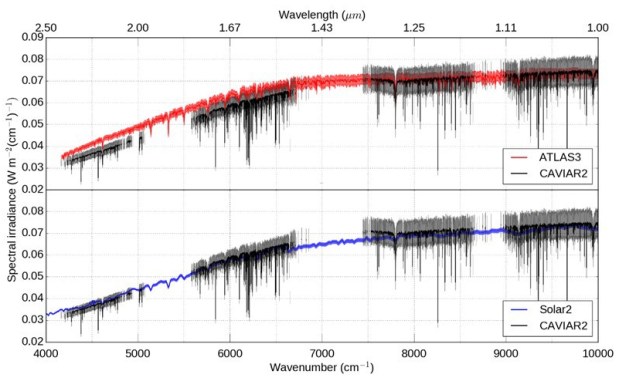
To derive the continuum it is necessary to know what the incoming solar radiation is. It turns out this is also a significant uncertainty in the literature in the 2000-10000 cm-1 region. While the total incoming solar irradiance is well-known, the distribution of that energy with the electromagnetic spectrum is not so well known. In the spectral region I’m looking at, that uncertainty is about ~10% between different sets of observations.
Since we have direct measurements of the Sun with absolute calibration, we can determine this from our own measurements, and found that the irradiance in this region may be significantly lower (16 W m-2 integrated over the whole spectral region) than expected, which must be made up by contributions elsewhere in the spectrum to account for the small uncertainty in the incoming solar radiation from Figure 1.

In the last part of my PhD, I hope to look at what effect these two results might have on the Earth’s energy budget, and look at how much of this 10 W m-2 uncertainty might be accounted for by them. This ties in well with a new project (ASPIC, Advanced Spectroscopy for improved characterisation of the near-Infrared water vapour Continuum) starting up at Reading and the Rutherford Appleton Laboratory in June, which hopes to look at new laboratory measurements of the continuum and assess the effect a strengthened continuum may have on radiation models.
