Email: j.beverley@pgr.reading.ac.uk
Recent extreme weather events such as the central European heatwave in 2003, flooding in the UK in 2007, and even the recent dry summer in the UK in 2018, have highlighted the need for more accurate long-range forecasts for the European summer. Recent research has led to improvements in European winter seasonal forecasts, however summer forecast skill remains relatively low. One potential source of predictability for Europe is the Indian summer monsoon, which can affect European weather via a global wave train known as the “Circumglobal Teleconnection” (CGT).

The CGT was first identified by Ding and Wang (2005) as having a major role in modulating observed weather patterns in the Northern Hemisphere summer. Using a 200 hPa geopotential height index centred in west-central Asia (35°-40°N, 60°-70°E), they constructed a one-point correlation map of geopotential height with reference to this index (reproduced in Figure 1). From this, they identified a wavenumber-5 structure where the pressure variations over the Northeast Atlantic, East Asia, North Pacific and North America are all nearly in phase with the variations over west-central Asia (these are known as the “centres of action”). They also showed that the CGT is associated with significant temperature and precipitation anomalies in Europe, so accurate representation this mechanism in seasonal forecast models could provide an important source of subseasonal to seasonal forecast skill.
The model used here is a version of the European Centre for Medium-Range Weather Forecasts (ECMWF)’s coupled seasonal forecast model. Reforecasts are initialised on 1st May and are run for four months, so cover May-August, with start dates from 1981-2014. The skill of the model 200 hPa geopotential height is shown in Figure 2, defined as the correlation between the model ensemble mean and ERA-Interim. The model has good skill in May (to be expected given that the reforecasts are initialised in May) but in June, July and August areas of zero or negative correlation develop across much of the northern hemisphere extratropics. The areas of reduced skill align closely with the location of the centres of action of the CGT shown in Figure 1, suggesting that there is a link between the model skill and the model representation of the CGT.

To determine how well the model represents the CGT, Figure 3 shows the correlation between the D&W region and the other centres of action of the CGT, as defined in Figure 1. Focussing on August (as August has the strongest CGT pattern) it can be seen that the model correlations, indicated by the box and whisker plots, are weaker than in observations (red diamond) for the D&W vs. North Pacific (NPAC), North America (NAM) and Northwest Europe (NWEUR) regions. This indicates that the model has a weak representation of the wavetrain associated with the CGT.

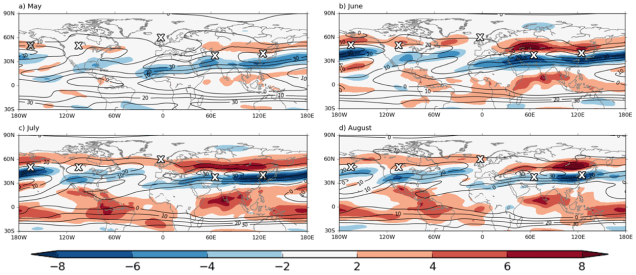
There are likely to be several reasons for the weak representation of the CGT in the model. One important factor is the presence of a northerly jet bias in the model across much of the Northern Hemisphere. This can be seen in Figure 4, which shows the model jet biases relative to ERA-Interim in the coloured contours, and the observed zonal wind in the black contours. The dipole structure of the biases which exists across much of the hemisphere, particularly in June, July and August, indicates that the model jet stream is located too far to the north. This means that Rossby waves forced in this region will have different wave propagation characteristics to reality – they may propagate at the incorrect speed, in the wrong direction or may not propagate at all, and this is likely to be an important factor in the weak representation of the CGT in the model.
Other potential factors involved are a poor representation of the link between monsoon precipitation and the geopotential height in west-central Asia (which was shown by Ding and Wang (2007) to be important in the maintenance of the CGT) and errors in the forcing of Rossby waves associated with the monsoon. For a more detailed explanation of these, see my paper in Climate Dynamics (Beverley et al. 2018). It seems likely that the pattern of reduced skill in Figure 2, with negative correlations located at the centres of action of the CGT, including over Europe, is related to the poor representation of the CGT in the model. This raises the question of whether an improvement in the model’s representation of the CGT would lead to an improvement in forecast skill for the European summer. To address this question, sensitivity experiments have been carried out, in which the observed circulation is imposed in several centres of action along the CGT pathway to explore the impact on forecast skill for European summer weather.
References
Beverley, J. D., S. J. Woolnough, L. H. Baker, S. J. Johnson and A. Weisheimer, 2018: The northern hemisphere circumglobal teleconnection in a seasonal forecast model and its relationship to European summer forecast skill. Clim. Dyn. https://doi.org/10.1007/s00382-018-4371-4
Ding, Q., and B. Wang, 2005: Circumglobal teleconnection in the northern hemisphere summer. J. Clim. 18, 3483–3505. https://doi.org/10.1175/JCLI3473.1
Ding, Q., and B. Wang, 2007: Intraseasonal teleconnection between the summer Eurasian wave train and the Indian monsoon. J. Clim. 20, 3751-3767. https://doi.org/10.1175/JCLI4221.1

One thought on “The Circumglobal Teleconnection and its Links to Seasonal Forecast Skill for the European Summer”