The use of weather regimes offers the ability to categorise the large-scale atmospheric circulation pattern over a region on any given day. One way of doing this is through k-means clustering of the 500 hPa geopotential height anomaly field. Cassou (2008) determined the lagged influence of the Madden-Julian Oscillation (MJO) on four wintertime regimes over the North Atlantic; these regimes have subsequently become commonly used (e.g. they are in use operationally at ECMWF). Charlton-Perez et al. (2018) used the same four regimes to describe the influence of the stratospheric polar vortex on Atlantic circulation patterns.
Stratosphere-troposphere coupling is often described in terms of either the annular modes (the leading principal component (PC) of hemisphere-wide variability, often known as the Arctic and Antarctic Oscillations (AO/AAO) when discussing the lower-troposphere) or regional leading principal components (such as the North Atlantic Oscillation (NAO)). However, by their definition, this doesn’t tell the full story – only some percentage of it (around 1/3 for the NAO). The downward coupling of stratospheric circulation anomalies onto tropospheric weather patterns is an area of active research. For example, not every sudden stratospheric warming (SSW) event exhibits the “canonical” response in the troposphere of a strongly negative NAO-type pattern (Karpechko et al. 2017, Domeisen et al. 2020).
Could regimes tell us something more? Specifically – could they shed light onto the impact of the stratosphere on North America, which has been under-explored compared with Europe? In a recent paper (Lee et al. 2019), we look at just that.
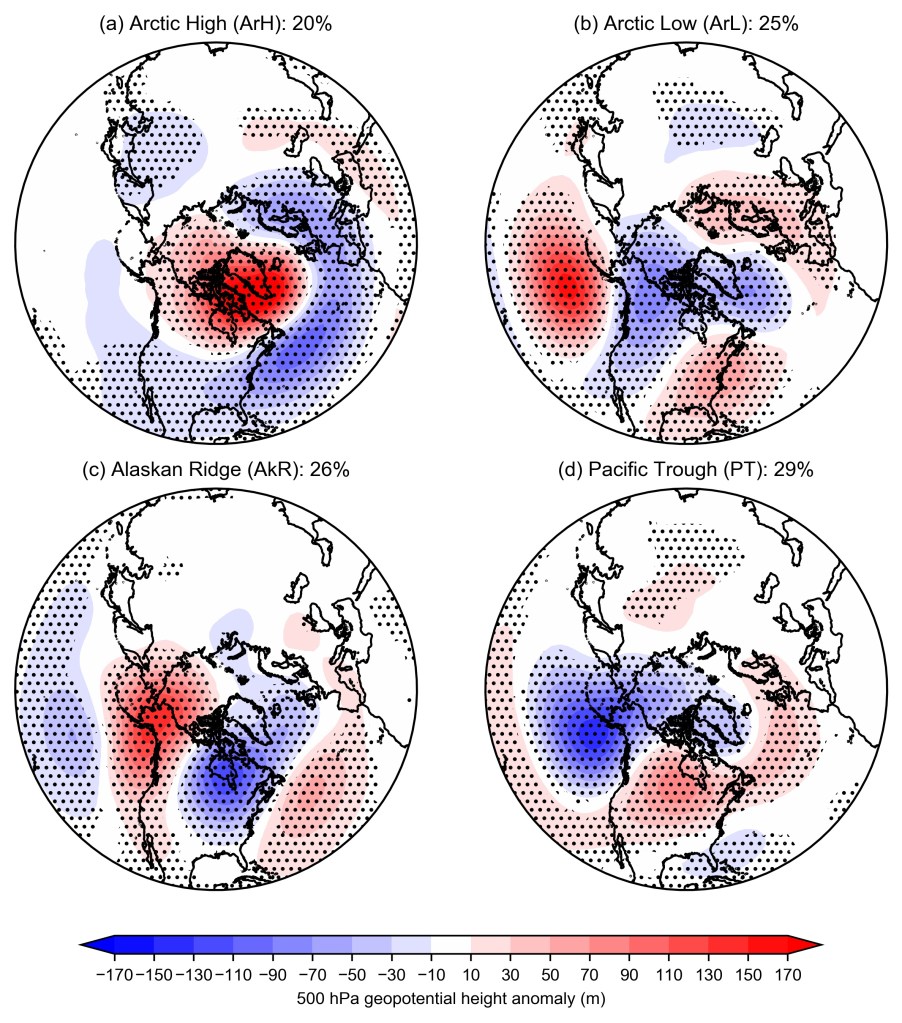
We use 500 hPa geopotential height anomalies in the sector 20-80°N 180-30°W from ERA-Interim reanalysis for December—March 1979—2017. In order to describe only the large-scale variability, we first reduced the dimensionality of the problem by performing the clustering on a filtered dataset – achieved by retaining only the first 12 PCs which explain 80% of the variance in the dataset. We set k a priori to be 4 in the k-means clustering, following Vigaud et al. (2018). The number of clusters is somewhat arbitrary, but 4 has been shown to be significant when comparing with a reference noise model (i.e., testing if the clusters are just the result of forcefully clustering noise, or something meaningful). Once the clusters have been determined from analysis of the dataset – the “centroids” – each day in the dataset is assigned to one of the clusters. The patterns produced (Figure 1) are like a similar analysis in Straus et al. (2007) so we adopt their names.
To diagnose how these regimes vary with the state of the stratospheric vortex, we compute some statistics (Figure 2) based on the tercile category of the 100 hPa 60°N zonal-mean zonal wind on the preceding day (“strong”, “neutral”, and “weak”). 100 hPa is used as a lower-stratospheric measure (compared with 10 hPa used for diagnosing major sudden stratospheric warmings) to assess only those anomalies in the stratosphere which have the potential to influence tropospheric weather.
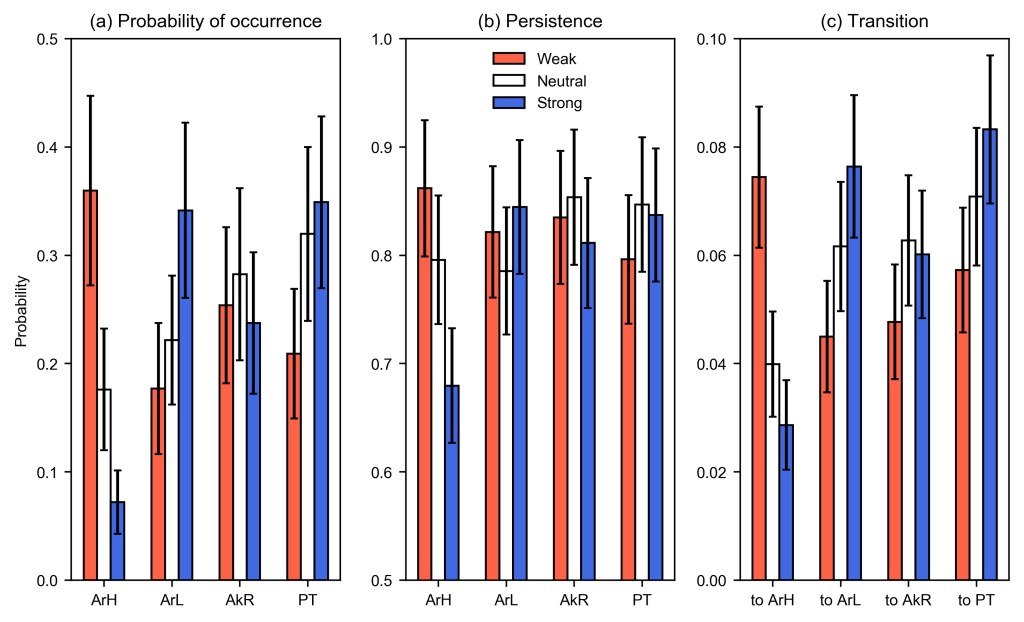
Evidently, the Arctic High regime is strongly sensitive to the strength of the stratospheric winds, being 7 times more likely following a weak vortex versus a strong vortex. The Arctic Low regime displays the opposite sensitivity, being more likely following a strong vortex. A similar but weaker relationship is found for the Pacific Trough. The Alaskan Ridge regime, however, does not display a sensitivity to the vortex strength. This result was somewhat surprising as the Alaskan Ridge regime resembles a pattern which became known as a “polar vortex outbreak”, but we suggest that (a) the similarity of the pattern to the Tropical-Northern Hemisphere pattern may indicate tropospheric forcing exhibits greater control on this regime, and (b) a possible influence through a barotropic anomaly exists from a distortion of the stratospheric vortex (which is not manifest in the zonal-mean zonal wind).
We relate these regimes to impactful real-world weather by computing the probability of an extreme cold temperature (defined as 1.5 standard deviations below normal) in each regime (Figure 3). We find that the greatest likelihood of widespread extreme cold in North America is during the Alaskan Ridge regime, with secondary likelihood of extreme cold for the west coast during the Arctic Low (recall that this pattern is more likely following a strong vortex), and only a low probability during the Arctic High regime (which is strongly associated with extreme cold in Europe).

Our results therefore suggest that the strength of the stratospheric polar vortex does not change the likelihood of the circulation pattern with the greatest potential for driving extreme cold weather in North America (in stark contrast to Europe), and that prediction of this pattern should look elsewhere – either to the tropics, or to changes in the shape of the stratospheric vortex – including wave reflection events (Kodera et al. 2008, Kretschmer et al. 2018).
Further work will investigate how well these regimes and their response to changes in the stratosphere are captured by the extended-range forecasting models which comprise the S2S database.
This work was funded by the NERC SCENARIO doctoral training partnership.
