Email: alexander.vessey@pgr.reading.ac.uk
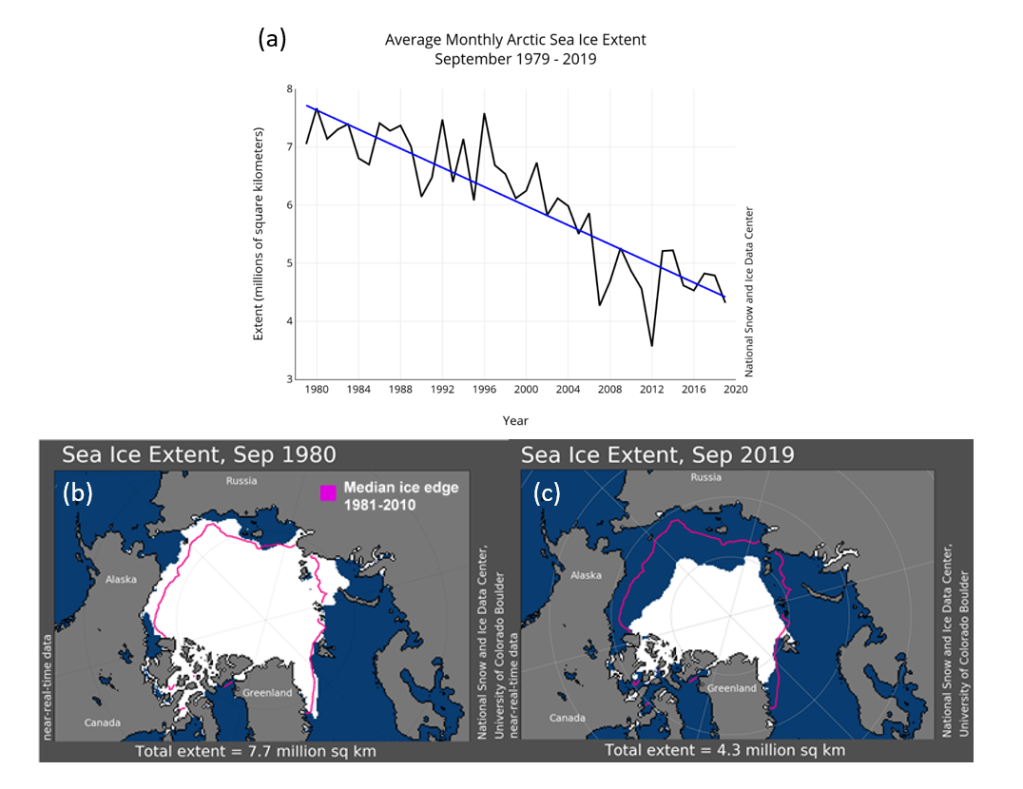
The Arctic has changed a lot over the last four decades. Arctic September sea ice extent has decreased rapidly from 1980-present by approximately 3.4 million square-kilometres (see Figure 1). This has made the Arctic more accessible for human activities such as shipping, oil exploration and tourism. As Arctic sea ice is expected to continue to decline in the future, human activity in the Arctic is expected to continue to increase. This will increase the exposure to hazardous weather conditions, such as high winds and high waves, which are associated with Arctic storms. However, the characteristics of Arctic storms are currently not well understood.
One way to investigate current Arctic storm characteristics is to analyse storms in global reanalysis datasets. Reanalysis datasets combine past observations with current weather models to produce spatially and temporally homogeneous datasets, that contain atmospheric data at grid-points around the world at constant time intervals (typically every 6-hours) per day from 1979-present (for the modern, satellite-era reanalyses). Typically, a storm tracking algorithm is used to efficiently process all of the 6-hour data in the reanalysis datasets from 1979 (60,088 time steps!) to identify all of the storms that may have occurred in the past. Storms can be identified in the mean sea level pressure (MSLP) field (as low pressure systems), or in the relative vorticity field (as large rotating systems). The relative vorticity field at 850 hPa (higher in the atmosphere than the atmospheric boundary layer) is typically used so that the field is less influenced by boundary layer processes that may produce areas of high relative vorticity.
At the moment, atmospheric scientists are spoilt for choice when it comes to choosing a reanalysis dataset to analyse. There are reanalysis datasets from multiple institutions; the European Centre for Medium Range Weather Forecasts (ECMWF), the Japanese Meteorological Agency (JMA), the National Aeronautics and Space Administration (NASA), and the National Centers for Environmental Prediction (NCEP). Each institution has created their reanalysis dataset in a slightly different way, by using their own numerical weather prediction model and data assimilation systems. Atmospheric scientists also have to choose whether to use the MSLP field or 850 hPa relative vorticity field when applying their storm tracking algorithm to the reanalysis datasets.
In my recent paper, I aimed to assess Arctic storm characteristics in the multiple reanalysis datasets currently available (ERA-Interim, JRA-55, MERRA-2 and NCEP-CFSR), using a storm tracking algorithm based on 850 hPa relative vorticity and MSLP fields. Below is a short summary of some of the results from the paper.
Despite the Arctic environment changing dramatically over the last four decades, we find that there has been no change in the frequency and intensity of Arctic storms in all the reanalysis datasets compared in this study. It was found in preceding, older versions of atmospheric reanalysis datasets that Arctic storm frequency had increased from 1949-2002 (Walsh. 2008 and Sepp & Jaagus. 2011). This is in contrast with results from the modern reanalysis datasets (from this study, and Simmonds et al. 2008, Serreze and Barrett. 2008 and Zahn et al. 2018) which show no increase in Arctic storm frequency.
Across all the reanalysis datasets, some robust characteristics of Arctic storms were found. For example, the spatial distribution of Arctic storms is found to be seasonally dependent. In winter (DJF), Arctic storm track density is highest over the Greenland, Norwegian and Barents Seas, whereas in summer (JJA), Arctic storm track density is highest over and north of the Eurasia coastline (a region known as the Arctic Frontal Zone (Reed & Kunkel. 1960)) (see Figure 2). The number of trans-Arctic ships in summer is much higher than in winter, and these ships typically use the Northern Sea Route to travel between Europe and Asia (along the coastline of Eurasia). Figure 2b shows that this in fact is where most of the summer Arctic storms occur. In addition, the reanalysis datasets show that ~50% of Arctic storms have genesis in mid-latitude regions (south of 65°N) and travel northwards into the Arctic (north of 65°N). This shows that storms are a significant mechanism for transporting air from low to high latitudes.
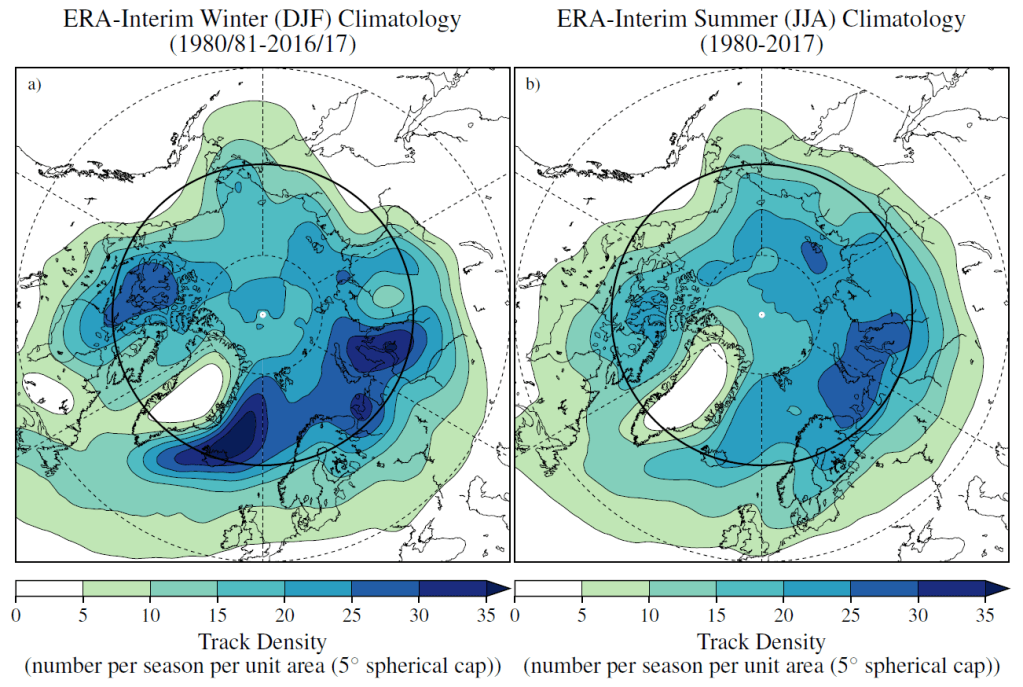
 ). Longitudes are shown every 60°E, and latitudes are shown at 80°N, 65°N (bold) and 50°N. Figure from Vessey at al. (2020).
In general, there is less consistency in Arctic storm characteristics in winter than in summer. This may be because in winter, the occurrence of meteorological conditions such as low level cloud, stable boundary layers and polar night that are more frequent, which are more challenging to represent in numerical weather prediction models, and for the creation of reanalysis datasets. In addition, there is a low density of conventional observations in winter, and difficulties in identifying cloud and estimating emissivity over snow and ice limit the current use of infrared and microwave satellite data in the troposphere (Jung et al. 2016).
The differences between the reanalysis datasets in Arctic storm frequency per season in winter (DJF) and summer (JJA) (1980-2017) were found to be less than 6 storms per season. On the other hand, the differences in Arctic storm frequency per season between storms identified by a storm tracking algorithm based on 850 hPa relative vorticity and MSLP were found to be 55 storms per season in winter, and 33 storms per season in summer. This shows that the decision to use 850 hPa relative vorticity or MSLP for storm tracking can be more important that the choice of reanalysis dataset.
Read more at: https://link.springer.com/article/10.1007/s00382-020-05142-4
References:
National Snow & Ice Data Centre (2019) Sea ice index. https://nsidc.org. Accessed 4 Mar 2019.
Reed RJ, Kunkel BA (1960) The Arctic circulation in summer. J. Meteorol. 17(5):489–506.
Sepp M, Jaagus J (2011) Changes in the activity and tracks of Arctic cyclones. Clim. Change 105(3–4):577–595.
Simmonds I, Burke C, Keay K (2008) Arctic climate change as manifest in cyclone behavior. J. Clim. 21(22):5777–5796.
Serreze MC, Barrett AP (2008) The summer cyclone maximum over the central Arctic Ocean. J. Clim. 21(5):1048–1065.
Vessey, A.F., Hodges, K.I., Shaffrey, L.C., Day, J.J., (2020) An inter‑comparison of Arctic synoptic scale storms between four global reanalysis datasets. Clim. Dyn., https://doi.org/10.1007/s00382-020-05142-4
Walsh, J.E., Bromwich, D.H., Overland, J.E., Serreze, M.C. and Wood, K.R., 2018. 100 years of progress in polar meteorology. Meteorological Monographs, 59, pp.21-1.
Zahn M, Akperov M, Rinke A, Feser F, Mokhov I I (2018) Trends of cyclone characteristics in the Arctic and their patterns from different reanalysis data. J. Geophys. Res. Atmos., 123(5):2737–2751.
