Shannon Jones – s.jones2@pgr.reading.ac.uk
Coronal Mass Ejections (CMEs), or solar storms, are huge eruptions of particles and magnetic field from the Sun. With the help of 4,028 citizen scientists, my supervisors and I have just published a paper, showing that the appearance of CMEs changes over the solar cycle, with CMEs appearing more visually complex towards solar maximum.
We created a Zooniverse citizen science project in collaboration with the UK Science Museum called ‘Protect our planet from solar storms’, where we showed pairs of images of CMEs from the Heliospheric (wide-angle white-light) Imagers on board the twin STEREO spacecraft, and asked participants to decide whether the left or right CME looked most complicated, or complex (Jones et al. 2020) We used these data to rank 1,110 CMEs in order of their relative visual complexity, by fitting a Bradley-Terry model. This is a statistical model widely used by psychologists to rank items by human preference. Figure 1 shows three example storms from across the ranking (see figshare for an animation with all CMEs). When we asked the citizen scientists how they chose the most complex CME, they described complex CMEs as “big”, “messy” and “bright” with complicated “waves”, “patterns” and “shading”.
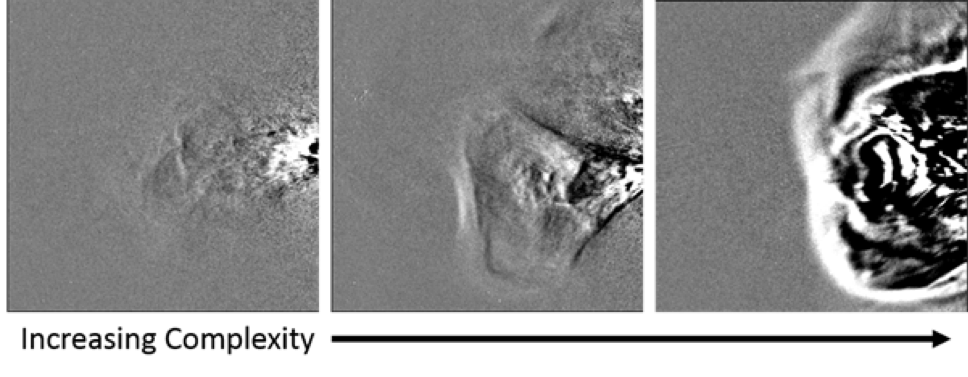
Figure 1. Example images showing three example CMEs in ranked order of subjective complexity increasing from low (left-hand image) through to high (right-hand image).
Figure 2 shows the relative complexity of all 1,110 CMEs, with CMEs observed by STEREO-A shown by pink dots, and CMEs observed by STEREO-B shown by blue dots. The lower panel shows the daily sunspot number over the same time period, using data from SILSO World Data Center. This shows that the annual average complexity values follow the solar cycle, and that the average complexity of CMEs observed by STEREO-B is consistently lower that the complexity of CMEs observed by STEREO-A. This might be due to slight differences between the imagers: STEREO-B is affected by pointing errors, which might blur smaller-scale features within the images.
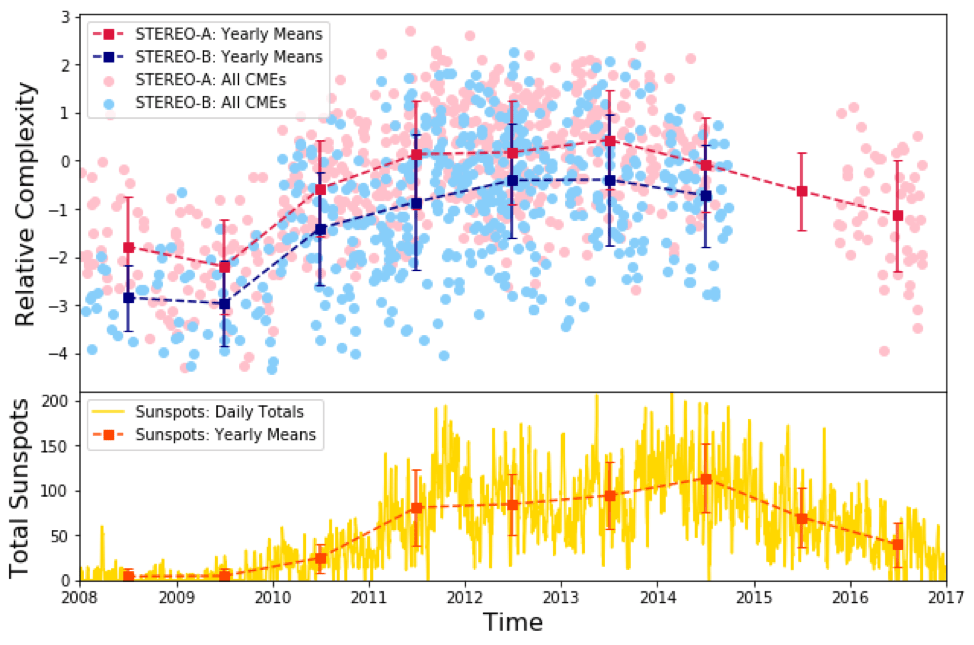
Figure 2. Top panel: relative complexity of every CME in the ranking plotted against time. Pink points represent STEREO-A images, while blue points represent STEREO-B images. Annual means and standard deviations are over plotted for STEREO-A (red dashed line) and STEREO-B (blue dashed line) CMEs. Bottom panel: Daily total sunspot number from SILSO shown in yellow, with annual means over plotted (orange dashed line).
If a huge CME were to hit Earth, there could be serious consequences such as long-term power cuts and satellite damage. Many of these impacts could be reduced if we had adequate warning that a CME was going to hit. Our results suggest that there is some predictability in the structure of CMEs, which may help to improve future space weather forecasts.
We plan to continue our research and quantitatively determine which CME characteristics are associated with visual complexity. We also intend to investigate what is causing the CMEs to appear differently. Possible causes include: the complexity of the magnetic field at the CME source region on the Sun; the structure of the solar wind the CME passes through; or multiple CMEs merging, causing a CME to look more complex.
Please see the paper for more details, or email me at s.jones2@pgr.reading.ac.uk if you have any questions!
Jones, S. R., C. J. Scott, L. A. Barnard, R. Highfield, C. J. Lintott and E. Baeten (2020): The visual complexity of coronal mass ejections follows the solar cycle. Space Weather, https://doi.org/10.1029/2020SW002556.
