I finished my PhD last year, and since the start of this year I’ve been doing something rather different. Courtesy of SCENARIO DTP funding, I am doing a 3-month post-doc placement with JBA Consulting in Skipton, North Yorkshire. After spending 3.5 years researching in an academic setting, it is great to be able to apply my knowledge to real-world problems.
Working in industry has a very different feel to working in academia. The science being done has an immediate purpose for the company, rather than being done purely to extend knowledge. In the case of my placement, the work that I am doing is ultimately to benefit the end users of the product.
The field that I am now working in is rather far removed from my PhD project: I have gone from gravity waves to surface water flooding. Whilst it has been quite a steep learning curve to bring myself up to speed with the current science in this area, it is great to branch out. I would urge anyone interested in doing an industrial placement not to be put off by going outside of your subject area. You might find something else that suits you better. It might even be the best step you ever make.
The choosing and setting up of the placement has all been fairly easy for me. SCENARIO had a range of placements available and I chose the one that most interested me. I had to send an application to the company, who then called me for an interview. Once they decided to offer me the placement, SCENARIO did the setting up with both JBA and the university. All I needed to worry about was finding accommodation for the 3 months.
To anyone considering doing an industrial placement: do it! I am currently 3 weeks in and have really enjoyed it so far. Everybody has been welcoming and helpful. I felt like part of the team by the end of my first day.
Orographic gravity waves occur when air flows over mountains in stably stratified conditions. The flow of air creates a pressure imbalance across the mountain, so a force is exerted on the mountain in the same direction as the flow. An equal and opposite force is exerted back on the atmosphere, and this is gravity wave drag (GWD).
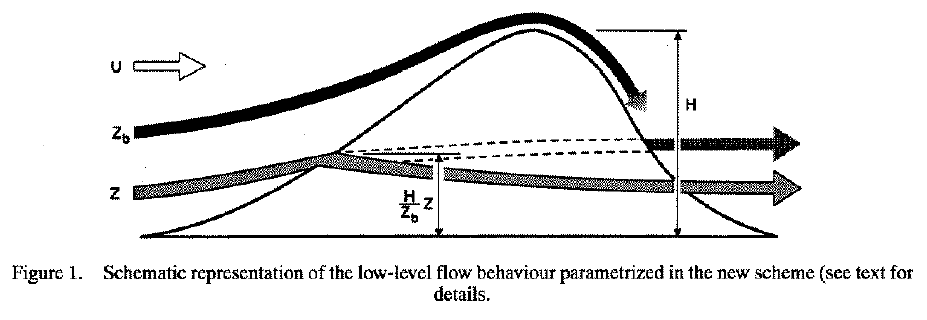
GWD must be parametrized in Global Circulation Models (GCMs), as it is important for large-scale flow. The first parametrization was formulated by Palmer et al. (1986) to reduce a systematic westerly bias. The current parametrization was formulated by Lott and Miller (1997) and partitions the calculation into 2 parts (see figure 1):
The mountain waves. This is calculated by averaging the wind, Brunt-Väisälä frequency and fluid density in a layer between 1 and 2 standard deviations of the subgrid-scale orography above the mean orography.
The blocked flow. This is based on an interpretation of the non-dimensional mountain height.
Figure from Lott and Miller (1997).
The parametrization does not include the effects of wind shear. Wind shear is a change in the wind with height and it alters the vertical wave length of gravity waves and so alters the drag. It has been shown (Teixeira et al., 2004; Teixeira and Miranda, 2006) that a uniform shear profile (i.e. a change in the magnitude of the wind with height) decreases the drag whereas a profile in which the wind turns with height increases the drag. This effect was seen by Miranda et al. (2009) to have the greatest impact over Antarctica, where drag enhancement was seen to occur all year with a peak of ~50% during JJA. Figure 2 shows this.
Figure 2: Annual mean linear GWD stress (1992-2001). Vectors show the surface stress with shear. Shading indicates the anomaly of the modulus of the surface stress due to shear. Computed from ERA-40 data. Taken from Miranda et al. (2009).
The aim of this work is to test the impact of the inclusion of shear effects on the parametrization. The first stage of this is to test the sensitivity of the shear correction to the height in the atmosphere at which the necessary derivatives are approximated. We carry out calculations using 2 different reference heights:
The top of the boundary layer (BLH). This allows us to avoid the effects of boundary layer turbulence, which are not important in this case as they are unrelated to the dynamics of mountain waves.
The middle of the layer between 1 and 2 standard deviations of the sub-grid scale orography (SDH). This is the nominal height used in previous studies and in the parametrization.
All figures shown below focus on Antarctica and are averaged over all JJAs for the decade 2006-2015. We are interested in Antarctica and the JJA season for the reasons highlighted above. All calculations are carried out using ERA-Interim reanalysis data.
We first consider the enhancement assuming axisymmetric orography. The advantage of this is that it considerably simplifies the correction due to terms related to the anisotropy becoming constant (see Teixeira et al, 2004). Figure 3 shows this correction calculated using both reference heights. We can see that the enhancement is greater when the SDH is used.
Figure 3: Drag enhancement over Antarctica with shear corrections computed at the BLH (left) and SDH (right), during JJAs for the decade 2006-2015, using axisymmetric orography.
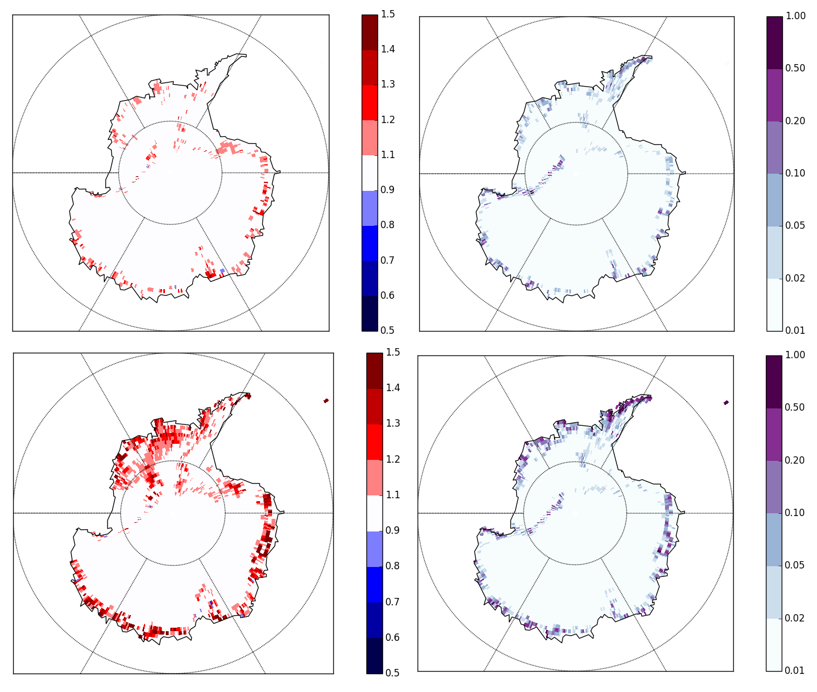
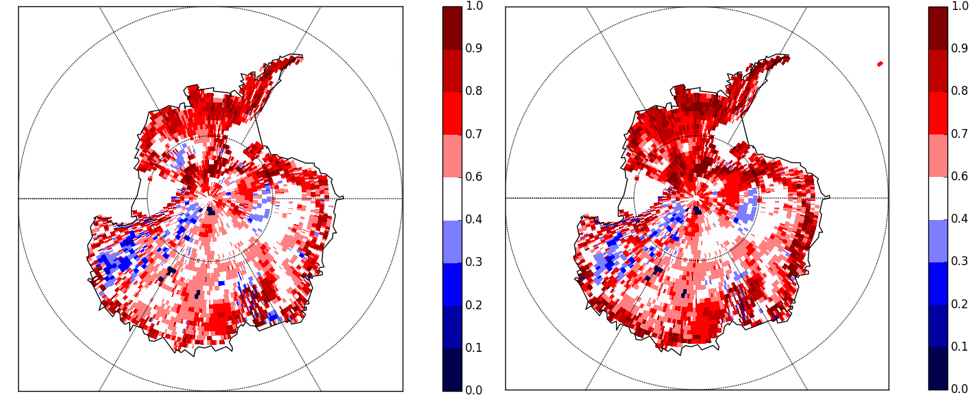
We now consider the enhancement using mountains with an elliptical horizontal cross-section. This is how the real orography is represented in the parametrization. Again, we see that the enhancement is greater when the SDH is used (figure 4).
Figure 4: Drag enhancement (left) and enhancement of drag stress (in Pa) (right) over Antarctica with shear corrections calculated at the BLH (top) and SDH (bottom), during JJAs for the decade 2006-2015, using orography with an elliptical horizontal cross-section.
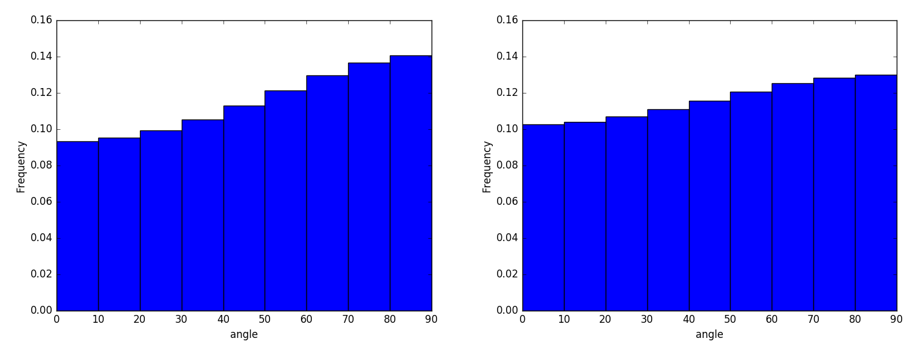
It is interesting to note that at both heights the enhancement is greater when axisymmetric orography is used. This occurs because, in the case of elliptical mountains, the shear vector is predominantly aligned along the orography, resulting is weaker enhancement (see figure 5).
Figure 5: Histograms of the orientation of the shear vector relative to the short axis of the orography over Antarctica for JJAs during the decade 2006-2015, using the BLH (left) and SDH (right).
We also investigate the fraction of times at which the terms related to wind profile curvature (i.e. those containing second derivatives) dominate the drag correction. This tells us the fraction of time for which curvature matters for the drag. We see that second derivatives dominate over much of Antarctica for a high proportion of the time (see figure 6).
Figure 6: Fraction of the time at which terms with second derivatives dominate the drag correction relative to terms with first derivatives over orography with an elliptical horizontal cross-section, for JJAs during the decade 2006-2015, calculated using the BLH (left) and SDH (right).
In summary, the main findings are as follows:
The drag is quantitatively robust to changes in calculation height, with the geographical distribution, seasonality and sign essentially the same.
The drag is considerably enhanced when the SDH is used rather than the BLH.
Investigation of the relative magnitudes of terms containing first and second derivatives in the drag correction indicates that second derivatives (i.e. curvature terms) dominate in a large proportion of Antarctica for a large fraction of time. This leads to an average enhancement of the drag which is larger over shorter time intervals.
Use of an axisymmetric orography profile causes considerable overestimation of the shear effects. This is due to the shear vector being predominantly aligned along the mountains in the case of the orography with an elliptical horizontal cross-section.
These results highlight the need to ‘tune’ the calculation by identifying the optimum height in the atmosphere at which to approximate the derivatives. This work is ongoing. We expect the optimum height to be that at which the shear has the greatest impact on the surface drag.
References:
Lott F. and Miller M., 1997, A new subgrid-scale orographic drag parametrization: Its formulation and testing, Quart. J. Roy. Meteor. Soc.,123: 101–127.
Miranda P., Martins J. and Teixeira M., 2009, Assessing wind profile effects on the global atmospheric torque, Quart. J. Roy. Meteor. Soc.,135: 807–814.
Teixeira M. and Miranda P., 2006, A linear model of gravity wave drag for hydrostatic sheared flow over elliptical mountains, Quart. J. Roy. Meteor. Soc.,132: 2439–2458.
Teixeira M., Miranda P. and Valente M., 2004, An analytical model of mountain wave drag for wind profiles with shear and curvature, J. Atmos. Sci.,61: 1040–1054.
Thanks to Hannah Bloomfield, Ambrogio Volonte, and Matthew Lang for photos.
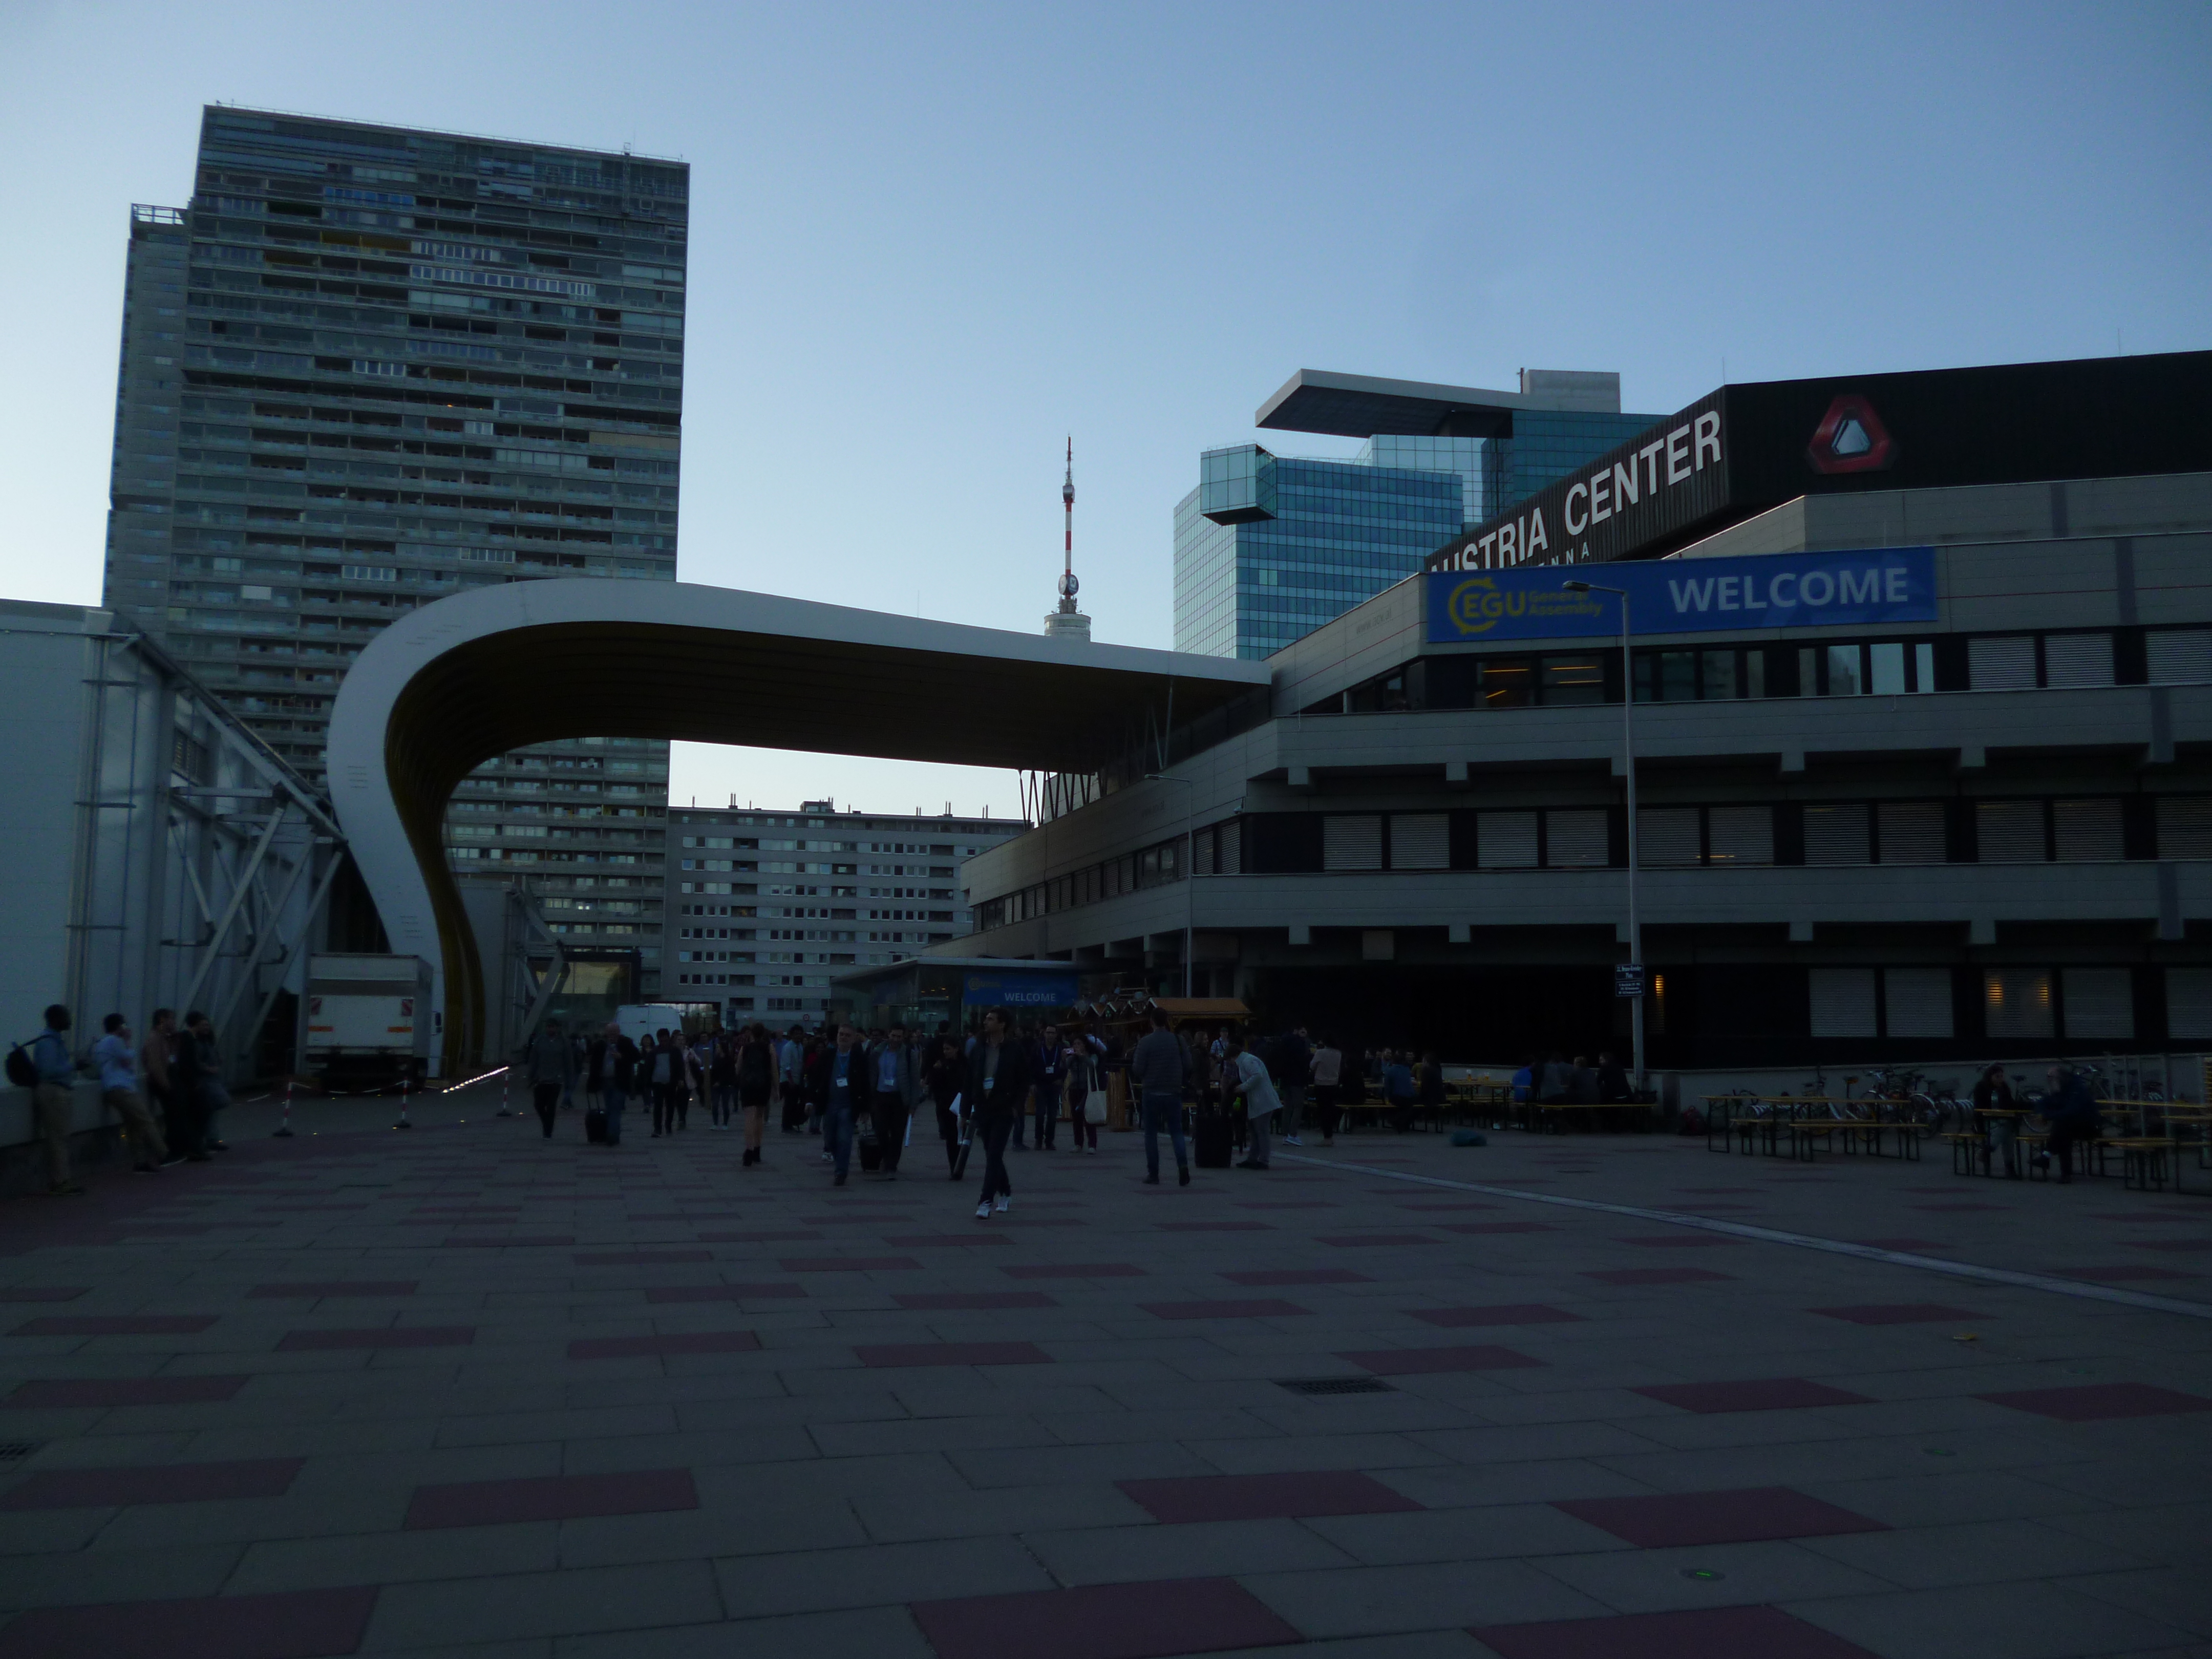
The EGU General Assembly took place from 8th to 13th April 2018 in Vienna and a large group of PhD students and staff from Reading attended. EGU is a large conference covering most areas within geoscience and over 10,000 people attended in all, making it rather overwhelming for a first timer!
The venue: Austria Center Vienna
Each day consisted of five 1.5 hour sessions, interspersed with coffee breaks and lunch. The final session every day was devoted to posters, providing a great opportunity to discuss work and network.
dav
dav
dig
There were many sessions on offer, it was sometimes hard to choose between them. There were oral presentations, posters, and PICOs. I found the PICO sessions an interesting concept. They started with ‘2 Minute Madness’ when all the presenters introduced their topics before the audience were invited to visit the interactive screens to discuss with the presenters. Particularly interesting sessions for me were those on internal gravity waves and forecasting the weather.
Several of the PhD students who made the trip from Reading had talks during the week and the rest had posters. My poster was included in the final session on Friday when everyone was winding down. I was part of the mountain meteorology session and my poster covered the effects of vertical wind shear on gravity wave drag in the Antarctic region. I found it to be a valuable experience as I was able to discuss my work with experts in my field.
Of course it would be a shame to travel all the way to Vienna and not see the sights! As well as having some shorter breaks during the week, I was lucky enough to have the Saturday to explore in the glorious weather before flying back in the evening.
On 22nd and 23rd February, a group of students from the University of Reading visited the UK Met Office in Exeter to share our work and listen to talks from academics and Met Office employees. It was a great opportunity to discuss our work with other scientists from outside the university.
We arrived at the Met Office at 12 on the Wednesday. Once we had hung up our posters and had lunch, we listened to our first talk from Dale Barker, who is Deputy Director of Weather Science at the UK Met Office. He gave us an overview of the Met Office Academic Partnership (MOAP) and the variety of work that takes place within the partnership. The MOAP brings together the UK Met Office with the universities of Exeter, Reading, Leeds, and Oxford to collaborate on projects and share science. It aims to pull together world-class expertise in weather and climate science to tackle key problems in these areas, and to provide an environment to develop the science leaders of tomorrow. The next talk was from Prof. Nadine Unger from the University of Exeter who spoke about aerosol pollution and work she has been involved in with African nations to reduce health problems caused by pollution. Our very own Dr Clare Watt then spoke about space weather, focusing on the magnetosphere and the impact of ‘killer’ electrons. The final talk of the day was from Dr Steven Böing from the University of Leeds. He spoke about semi-Lagrangian cloud modelling and how it can be used to increase forecast accuracy.
The poster session then took place in the Street. A lot of useful discussions were had during this session (and over the whole two days) as we were able to share our work with each other and also with passing members of Met Office staff. I certainly realized some new things about my results and had ideas about future directions for my work.
On the second day we had a presentation on career opportunities within the scientific areas of the Met Office from Mo Mylne, who is Science Project and Planning Manager at the UK Met Office. This really highlighted the breadth of roles that are available at the national meteorological service. This was followed by a talk from Prof. Coralia Cartis from the University of Oxford who spoke about parameter estimation for climate modelling using optimization techniques. After this, we were taken on tours of the Met Office to see some of areas that scientists are involved in. We then had lunch and a final opportunity to discuss our posters before the event finished.
Overall, then, it was a very enjoyable event with a great variety of subjects covered by the talks. I found the use of optimization techniques for parameter estimation particularly interesting and I hope to incorporate some of the ideas into my own research. I feel I have personally learned a lot, both about my own results and new ideas to consider. Thank you to all at the Met Office who organized the event.