Email: Rachael.Byrom@pgr.reading.ac.uk
In 2016 the United Nations (UN) Sustainable Development Goals (SDGs) officially came into force to tackle key global challenges under a sustainable framework.
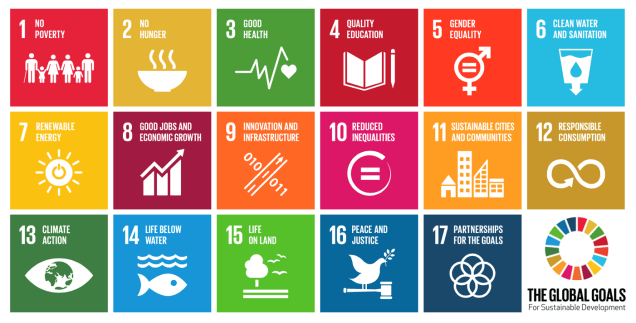
The SDGs comprise 17 global goals and 169 targets to be achieved across the next 15 years. As part of the ‘2030 Agenda’ for sustainable development, these goals aim to address a range of important global environmental, social and economic issues such as climate change, poverty, hunger and inequality. Adopted by leaders across the world, these goals are a ‘call for action’ to ensure that no one is left behind. However, the SDGs are not legally binding. The success of goals will rely solely on the efforts of individual countries to establish and implement a national framework for achieving sustainable development.
As part of the NERC funded ‘Innovating for Sustainable Development’ programme, students here in the Department of Meteorology were given the opportunity to explore and find solutions to key environmental challenges as outlined in the UN’s SDGs.
Run by the SCENARIO and SSCP doctoral training partnerships, the programme challenged students from a variety of disciplines and institutions to re-frame the SDGs from a multi-disciplinary perspective and to develop tangible, innovative solutions for sustainable development.
The programme began with an ‘Interdisciplinary Challenges Workshop’ where students participated in activities and exercises to review the importance of the SDGs and to consider their multi-disciplinary nature. Students were encouraged to think creatively and discuss issues related to each of the goals, such as: ‘Is this SDG achievable?’, ‘Are the goals contradictory?’ and ‘How could I apply my research to help achieve the SDGs?’
Following this, three ‘Case Study’ days explored a handful of the SDGs in greater detail, with representatives from industry, start-ups and NGOs explaining how they are working to achieve a particular SDG, their current challenges and possible opportunities for further innovation.
The first Case Study day focused on both SDG 7 – Affordable and Clean Energy and SDG 12 – Responsible Consumption and Production. For SDG 7, insightful talks were given by the Moving Energy Initiative on the issue of delivering energy solutions to millions of displaced people, and BBOXX, on their work to produce and distribute off-grid solar power systems to rural communities in places such as Kenya and Rwanda. In the afternoon, presentations given by Climate-KIC start up NER and Waitrose showcased the efforts currently being taken to reduce wasteful food production and packaging, while Forum for the Future emphasised the importance of addressing sustainable nutrition.
The second Case Study day focused on SDG 6 – Clean Water and Sanitation. Experts from WaterAid, De-Solenator, Bear Valley Ventures, UKWIR and the International Institute for Environmental Development outlined the importance of confronting global sanitation and water challenges in both developing and developed nations. Alarmingly, it was highlighted that an estimated 40% of the global population are affected by water scarcity and 2.4 billion people still lack access to basic sanitation services, with more than 80% of human activity wastewater discharged into rivers without going through any stage of pollution removal (UN, 2016).

The last Case Study day explored SDG 9 – Industry, Innovation and Infrastructure and SDG 11 – Sustainable Cities and Communities. A range of talks on building technologies, carbon neutral buildings and sustainable solar technologies were given, along with a presentation by OPDC on the UK’s largest regeneration project. The day finished off with an overview from the Greater London Authority about the London Infrastructure Map and their new approach to sustainable planning and development across the city.
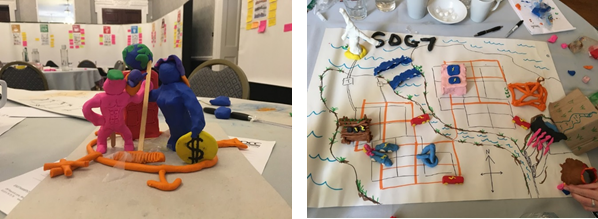
The programme finished off with a second workshop. Here students teamed up to develop innovative business ideas aimed at solving the SDG challenges presented throughout the Case Study events. Business coaches and experts were on hand to offer advice to help the teams develop ideas that could become commercially viable.
On the 16th March the teams presented their business ideas at the ‘Meet the Cleantech Pioneers’ networking event at Imperial’s new Translation and Innovation Hub (I-HUB). An overview of the projects can be found here. This event, partnered with the Climate-KIC accelerator programme, provided an excellent platform for participants to showcase and discuss their ideas with a mix of investors, entrepreneurs, NGOs and academics all interested in achieving sustainable development.

Overall the programme provided a great opportunity to examine the importance of the SDGs and to work closely with PhD students from a range of backgrounds. Fundamentally the process emphasised the point that, in order for the world to meet the 2030 Agenda, many sustainable development challenges still need to be better understood and many solutions still need to be provided – and here scientific research can play a key role. Furthermore, it was made clear that a high level of interdisciplinary thinking, research and innovation is needed to achieve sustainable development.

References:
UN, 2016: Clean Water and Sanitation – Why it matters, United Nations, Accessed 05 March 2017. [Available online at http://www.un.org/sustainabledevelopment/wp-content/uploads/2016/08/6_Why-it-Matters_Sanitation_2p.pdf]


