The importance of anticyclonic synoptic eddies for atmospheric block persistence and forecasts

Charlie Suitters – c.c.suitters@pgr.reading.ac.uk

The Beast from the East, the record-breaking winter warmth of February 2020, the Canadian heat dome of 2022…what do these three events have in common? Well, many things I’m sure, but most relevantly for this blog post is that they all coincided with the same phenomenon – atmospheric blocking.

So what exactly is a block? An atmospheric block is a persistent, large-scale, quasi-stationary high-pressure system sometimes found in the mid-latitudes. The prolonged subsidence associated with the high pressure suppresses cloud formation, therefore blocks are often associated with clear, sunny skies, calm winds, and temperature extremes. Their impacts can be diverse, including both extreme heat and extreme cold, drought, poor air quality, and increased energy demand (Kautz et al., 2022). 

Despite the range of hazards that blocking can bring, we still do not fully understand the dynamics that cause a block to start, maintain itself, and decay (Woollings et al., 2018). In reality, many different mechanisms are at play, but the importance of each process can vary between location, season, and individual block events (Miller and Wang, 2022). One process that is known to be important is the interaction between blocks and smaller synoptic-scale transient eddies (Shutts, 1983; Yamazaki and Itoh, 2013). By studying a 43-year climatology of atmospheric blocks and their anticyclonic eddies (both defined by regions of anomalously high 500 hPa geopotential height), I have found that on average, longer blocks absorb more synoptic anticyclones, which “tops up their anticyclonicness” and allows them to persist longer (Fig. 1).

Figure 1: average number of anticyclonic eddies per block for the Euro-Atlantic (left) and North Pacific (right). Block persistence is defined as the quartiles (Q1, Q2, Q3) of all blocks in winter (blue) and summer (red). From Suitters et al. (2023).

It’s great that we now know this relationship, however it would be beneficial to know if these interactions are forecasted well. If they are not, it might explain our shortcomings in predicting the longevity of a block event (Ferranti et al., 2015).  I explore this with a case study from March 2021 using ensemble forecasts from MOGREPS-G. Fortunately, this block in March 2021 was not associated with any severe weather, but it was still not forecasted well. In Figure 2, I show normalised errors in the strength, size, and location of the block, at the time of block onset, for each ensemble member from a range of different initialisation times. In these plots, a negative (positive) value means that the block was forecast to be too weak (strong) or too small (large), and the larger the error in the location, the further away the forecast block was from reality. In general, the onset of this block was forecast to be to be too weak and too small, though there was considerable spread within the ensemble (Fig. 2). Certainty in the forecast was only achieved at relatively small lead times.

Figure 2: Normalised errors in the intensity (left), area (centre), and location of the block’s centre of mass (right), at a validity time of 2021-03-14 12 UTC (the time of onset). Each ensemble member’s error from a particular initialisation time is shown by the grey dots, and the ensemble mean is shown in black. When Z, A, or L are zero, the forecast has a “perfect” replication for this metric of the block (when compared to ERA5 reanalysis).

Now for the interesting bit – what causes the uncertainty in forecasting of the onset this European blocking event? To examine this, I grouped forecast members from an initialisation time of 8 March 2021 according to their ability to replicate the real block: the entire MOGREPS-G mean, members that either have no block or a very small block (Group G), members that perform best (Group H), and members that predict area well, but have the block in the wrong location (Group I). Then, I take the mean geopotential height anomalies () at each time step in each group, and compare these fields between groups to see if I can find a source of forecast error.

This is shown as an animation in Fig. 3. The animation starts at the time of block onset, and goes back in time to selected validity times, as shown at the top of the figure. The domain of the plot also changes in each frame, gradually moving westwards across the Atlantic. By looking at the ERA5 (the “real”) evolution of the block, we see that the onset of the European block was the result of an anticyclonic transient eddy breaking off from an upstream blocking event over North America. However, none of the aforementioned groups of members accurately simulate this vortex shedding from the North American block. In most cases, the eddy leaving the North American block is either too weak or non-existent (as shown by the blue shading, representing that the forecast is much weaker than in ERA5), which resulted in a lack of Eastern Atlantic blocking altogether. Only the group that modelled the block well (Group H) had a sizeable eddy breaking off from the upstream block, but even in this case it was too weak (paler blue shading). Therefore, the uncertain block onset in this case is directly related to the way in which an anticyclonic eddy was forecast to travel (or not) across the Atlantic, from a pre-existing block upstream. This is interesting because the North American block itself was modelled well, yet the eddy that broke off it was not, which was vital for the onset of the Euro-Atlantic block.

To conclude, this is an important finding because it shows the need to accurately model synoptic-scale features in the medium range in order to accurately predict blocking. If these eddies are absent in a forecast, a block might not even form (as I have shown), and therefore potentially hazardous weather conditions would not be forecast until much shorter lead times. My work shows the role of anticyclonic eddies towards the persistence and forecasting of blocks, which until now had not be considered in detail.

References

Kautz, L., Martius, O., Pfahl, S., Pinto, J.G., Ramos, A.M., Sousa, P.M., and Woollings, T., 2022. “Atmospheric blocking and weather extremes over the Euro-Atlantic sector–a review.” Weather and climate dynamics, 3(1), pp305-336.

Miller, D.E. and Wang, Z., 2022. Northern Hemisphere winter blocking: differing onset mechanisms across regions. Journal of the Atmospheric Sciences, 79(5), pp.1291-1309.

Shutts, G.J., 1983. The propagation of eddies in diffluent jetstreams: Eddy vorticity forcing of ‘blocking’ flow fields. Quarterly Journal of the Royal Meteorological Society, 109(462), pp.737-761.

Suitters, C.C., Martínez-Alvarado, O., Hodges, K.I., Schiemann, R.K. and Ackerley, D., 2023. Transient anticyclonic eddies and their relationship to atmospheric block persistence. Weather and Climate Dynamics, 4(3), pp.683-700.

Woollings, T., Barriopedro, D., Methven, J., Son, S.W., Martius, O., Harvey, B., Sillmann, J., Lupo, A.R. and Seneviratne, S., 2018. Blocking and its response to climate change. Current climate change reports, 4, pp.287-300.

Yamazaki, A. and Itoh, H., 2013. Vortex–vortex interactions for the maintenance of blocking. Part I: The selective absorption mechanism and a case study. Journal of the Atmospheric Sciences, 70(3), pp.725-742.
WesCon 2023: From Unexpected Radiosondes to Experimental Forecasts

Adam Gainford – a.gainford@pgr.reading.ac.uk

Summer might seem like a distant memory at this stage, with the “exact date of snow” drawing ever closer and Mariah Carey’s Christmas desires broadcasting to unsuspecting shoppers across the country. But cast your minds back four-to-six months and you may remember a warmer and generally sunnier time, filled with barbeques, bucket hats, and even the occasional Met Ball. You might also remember that, weather-wise, summer 2023 was one of the more anomalous summers we have experienced in the UK. This summer saw 11% more rainfall recorded than the 1991-2020 average, despite June being dominated by hot, dry weather. In fact, June 2023 was also the warmest June on record and yet temperatures across the summer turned out to be largely average. 

Despite being a bit of an unsettled summer, these mixed conditions provided the perfect opportunity to study a notoriously unpredictable type of weather: convection. Convection is often much more difficult to accurately forecast compared to larger-scale features, even using models which can now explicitly resolve these events. As a crude analogy, consider a pot of bubbling water which has brought to the boil on a kitchen hob. As the amount of heat being delivered to the water increases, we can probably make some reasonable estimates of the number of bubbles we should expect to see on the surface of the water (none initially, but slowly increasing in number as the temperature of the water approaches the boiling point). But we would likely struggle if we tried to predict exactly where those bubbles might appear. 

This is where the WesCon (Wessex Convection) field campaign comes in. WesCon participants spent the entire summer operating radars, launching radiosondes, monitoring weather stations, analysing forecasts, piloting drones, and even taking to the skies — all in an effort to better understand convection and its representation within forecast models. It was a huge undertaking, and I was fortunate enough to be a small part of it. 

In this blog I discuss two of the ways in which I was involved: launching radiosondes from the University of Reading Atmospheric Observatory and evaluating the performance of models at the Met Office Summer Testbed.

Radiosonde Launches and Wiggly Profiles

A core part of WesCon was frequent radiosonde launches from sites across the south and south-west of the UK. Over 300 individual sondes were launched in total, with each one requiring a team of two to three people to calibrate the sonde, record station measurements and fill balloons with helium. Those are the easy parts – the hard part is making sure your radiosonde gets off the ground in one piece.

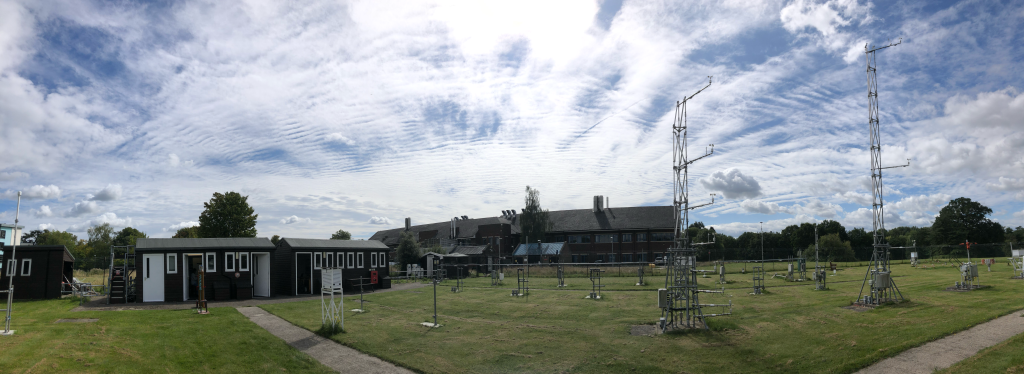
You can see in the picture below that the observatory is surrounded by sharp fences and monitoring equipment which can be tricky to avoid, especially during gusty conditions. In the rare occurrences when the balloon experienced “rapid unplanned disassembly”, we had to scramble to prepare a new one so as not to delay the recordings by too long.

The University of Reading Atmospheric Observatory, overlooked by some mid-level cloud streets. 

After a few launches, however, the procedure becomes routine. Then you can start taking a cursory look at the data being sent back to the receiving station.

During the two weeks I was involved with launching radiosondes, there were numerous instances of elevated convection, which were a particular priority for the campaign given the headaches these cause for modellers. Elevated convection is where the ascending airmass originates from somewhere above the boundary layer, such as on a frontal boundary. We may therefore expect profiles of elevated convection to include a temperature inversion of some kind, which would prevent surface airmasses from ascending above the boundary layer. 

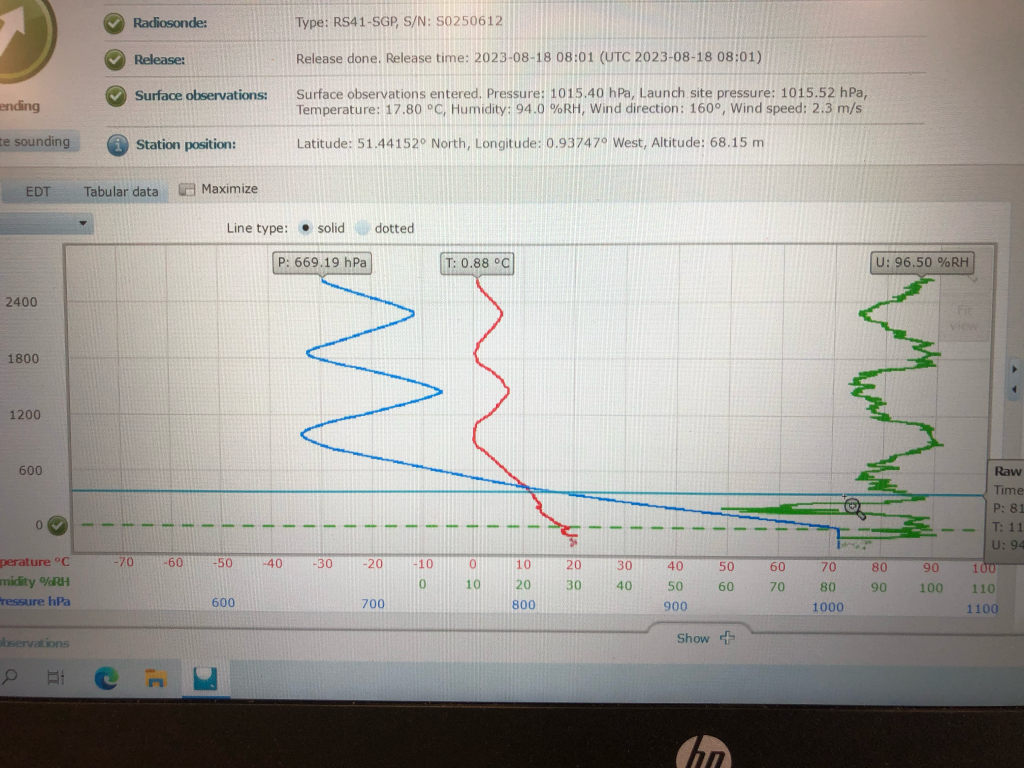
However, what we certainly did not expect to see were radiosondes appearing to oscillate with height (see my crude screenshot below). 

“The wiggler”! Oscillating radiosondes observed during elevated convection events.

Cue the excited discussions trying to explain what we were seeing. Sensor malfunction? Strong downdraughts? Not quite. 

Notice that the peak of each oscillation occurs almost exactly at 0°C. Surely that can’t be coincidental! Turns out these “wiggly” radiosondes have been observed before, albeit infrequently, and is attributed to snow building up on the surface of the balloon, weighing it down. As the balloon sinks and returns to above-freezing temperatures, the accumulated snow gradually melts and departs the balloon, allowing it to rise back up to the freezing level and accumulate more snow, and so on. 

That sounds reasonable enough. So why, then, do we see this oscillating behaviour so infrequently? One of the reasons discovered was purely technical. 

If you would like to read more about these events, a paper is currently being prepared by Stephen Burt, Caleb Miller and Brian Lo. Check back on the blog for further updates!

Humphrey Lean, Eme Dean-Lewis (left) and myself (right) ready to launch a sonde.

Met Office Summer Testbed

While not strictly a part of WesCon, this summer’s Met Office testbed was closely connected to the themes of the field campaign, and features plenty of collaboration. 

Testbeds are an opportunity for operational meteorologists, researchers, academics, and even students to evaluate forecast outputs and provide feedback on particular model issues. This year’s testbed was focussed on two main themes: convection and ensembles. These are both high priority areas for development in the Met Office, and the testbed provides a chance to get a broader, more subjective evaluation of these issues.

Group photo of the week 2 testbed participants.

Each day was structured into six sets of activities. Firstly, we were divided into three groups to perform a “Forecast Denial Experiment”, whereby each group is given access to a limited set of data and asked to issue a forecast for later in the day. One group only had access to the deterministic UKV model outputs, another group only had access to the MOGREPS-UK high-resolution ensemble output, and the third group has access to both datasets. The idea was to test whether ensemble outputs provide added value and accuracy to forecasts of impactful weather compared to just deterministic outputs. Each group was led by one or two operational meteorologists who navigated the data and, generally, provided most of the guidance. Personally, I found it immensely useful to shadow the op-mets as they made their forecasts, and came away with a much better understanding of the processes which goes into issuing a forecast.

After lunch, we would begin the ensemble evaluation activity which focussed on subjectively evaluating the spread of solutions in the high-resolution MOGREPS-UK ensemble. Improving ensemble spread is one of the major priorities for model development; currently, the members of high-resolution ensembles tend to diverge from the control member too slowly, leading to overconfident forecasts. It was particularly interesting to compare the spread results from MOGREPS-UK with the global MOGREPS-G ensemble and to try to understand the situations when the UK ensemble seemed to resemble a downscaled version of the global model. Next, we would evaluate three surface water flooding products, all combining ensemble data with other surface and impact libraries to produce flooding risk maps. Despite being driven by the same underlying model outputs, it was surprising how much each model differed in the case studies we looked at. 

Finally, we would end the day by evaluating the WMV (Wessex Model Variable) 300 m test ensemble, run over the greater Bristol area over this summer for research purposes. Also driven by MOGREPS-UK, this ensemble would often pick out convective structure which MOGREPS-UK was too coarse to resolve, but also tended to overdo the intensities. It was also very interesting to see the objective metrics suggested that WMV had much worse spread than MOGREPS-UK over the same area, a surprising result which didn’t align with my own interpretation of model performance.

Overall, the testbed was a great opportunity to learn more about how forecasts are issued and to get a deeper intuition for how to interpret model outputs. As researchers, it’s easy to look at model outputs as just abstract data, which is there to be verified and scrutinised, forgetting the impacts that it can have on the people experiencing it. While it was an admittedly exhausting couple of weeks, I would highly recommend more students take part in future testbeds!

Air-sea heat fluxes at the oceanic mesoscale: the impact of the ratio of ocean-to-atmosphere grid resolution

Sophia Moreton – s.moreton@pgr.reading.ac.uk

Sea surface temperature (SST) anomalies are vital for regulating the earth’s weather and climate.  The generation and reduction of these SST anomalies are largely determined by air-sea heat fluxes, particularly turbulent heat fluxes (latent and sensible).

The turbulent heat flux feedback (THFF) is a critical parameter, which measures the change in the net air-sea turbulent heat flux in response to a 1 K change in SST. So far in current research, this feedback is well known at large scales, i.e. over the whole ocean basin. However, a quantification of this feedback at much smaller spatial scales (10-100km) over individual mesoscale ocean eddies remains absent.

Why do we care about air-sea feedbacks at the oceanic mesoscale?

Both heat and momentum air-sea exchanges at the mesoscale impact the local and large-scale atmosphere (e.g. shifting storm tracks) and alter the strength of western boundary currents and the large-scale ocean gyre circulation. However, research into this field to date is hindered by the lack of high spatial resolution in observational data at the air-sea interface.

Therefore our study uses three high-resolution configurations from the UK Met Office coupled climate model (HadGEM3-GC3). We provide the first global estimate of turbulent heat flux feedback (α) over individually tracked and composite-averaged coherent mesoscale eddies, which ranges between 35 to 45 Wm-2K-1 depending on eddy amplitude.

Estimates of the turbulent heat flux feedback (THFF) are split, depending if the feedback is calculated using SST on the ocean grid (α0) or after regridding SST to the atmosphere (αA). An example of αA using regridded SST anomalies (SSTA) is given in Fig.1 for large-amplitude eddies in the highest ocean-atmosphere resolution available (a 25km atmosphere coupled to a 1/12° ocean, labelled ‘N512-12’).

Figure 1: A scatter plot of the relationship (THFF, αA) between regridded SST (SSTA) and THF anomalies. αA is the gradient of the linear regression line (black) +/- the 95% confidence interval (shown by the text). The data is from eddy snapshots averaged over 1 year, denoted by ‘< >’. Only large-amplitude eddies in the N512-12 configuration (25km atmosphere – 1/12° ocean) are plotted.

Why is the feedback so sensitive to the ratio of grid resolution?

In high-resolution coupled climate models, the atmospheric resolution is typically coarser than in its ocean component although, to date, a quantification of what the ocean-atmosphere ratio of grid resolution should be remains absent.

We prove increasing the ratio of atmosphere-to-ocean grid resolution in coupled climate models can lead to a large underestimation of turbulent heat flux feedback over mesoscale eddies, by as much as 75% for a 6:1 resolution ratio, as circled in Fig. 2 from a 60km atmosphere coupled to a 1/12° ocean. An underestimation of the feedback is consistent across all eddy amplitudes (A) and all three model configurations shown (Fig. 2); it suggests SST anomalies within these eddies are likely to be not reduced enough by air-sea fluxes of heat, and consequently will remain too large.

The underestimation stems from the calculation of the air-sea heat fluxes in the HadGEM3-GC3.1 model on the coarser atmospheric grid, instead of the finer ocean grid. Many other climate models do the same. At present, for the long spin-ups needed for climate simulations, it is unrealistic to expect the atmospheric resolution to match the very fine (10km) ocean resolution in coupled climate models, i.e. to create a one-to-one grid ratio. Therefore, to minimise this underestimation in the feedback at mesoscales, we advise air-sea heat fluxes should be computed on the finer oceanic grid.

Figure 2: Estimates of the turbulent heat flux feedback (THFF) across different eddy amplitudes (A) for α0 (lighter colours) and αA (darker colours, using regridded SST) for three model configurations: N512-12, N216-12 and N216-025. The ocean and atmosphere resolutions are added in red for each. Increasing the ratio of grid resolution, underestimates the THFF (as α0 differs from αA). The horizontal bars indicate the width of the eddy amplitude bins, and the vertical error bars indicate 95% confidence intervals.

Correctly simulating the air-sea heat flux feedback over mesoscale eddies is fundamental to realistically represent their interaction with the local and large-scale atmosphere and feedback on the ocean, to improve our predictions of the earth’s climate.

For a full analysis of the results, including a decomposition of the turbulent heat flux feedback, the reader is referred to Moreton et al., 2021, Air-Sea Turbulent Heat Flux Feedback over Mesoscale Eddies, GRL (in review).

Manuscript available: https://doi.org/10.1002/essoar.10505981.1

This work lays the foundation for my current work, evaluating how mesoscale air-sea heat fluxes feedback and alter the strength of large-scale ocean gyre circulation, using the MIT general circulation model (MITgcm).

This work is funded by a NERC CASE studentship with the Met Office, UK.

Quantifying the skill of convection-permitting ensemble forecasts for the sea-breeze occurrence

Email: carlo.cafaro@pgr.reading.ac.uk

On the afternoon of 16th August 2004, the village of Boscastle on the north coast of Cornwall was severely damaged by flooding (Golding et al., 2005). This is one example of high impact hazardous weather associated with small meso- and convective-scale weather phenomena, the prediction of which can be uncertain even a few hours ahead (Lorenz, 1969; Hohenegger and Schar, 2007). Taking advantage of the increased computer power (e.g. https://www.metoffice.gov.uk/research/technology/supercomputer) this has motivated many operational and research forecasting centres to introduce convection-permitting ensemble prediction systems (CP-EPSs), in order to give timely weather warnings of severe weather.

However, despite being an exciting new forecasting technology, CP-EPSs place a heavy burden on the computational resources of forecasting centres. They are usually run on limited areas with initial and boundary conditions provided by global lower resolution ensembles (LR-EPS). They also produce large amounts of data which needs to be rapidly digested and utilized by operational forecasters. Assessing whether the convective-scale ensemble is likely to provide useful additional information is key to successful real-time utilisation of this data. Similarly, knowing where equivalent information can be gained (even if partially) from LR-EPS using statistical/dynamical post-processing both extends lead time (due to faster production time) and also potentially provides information in regions where no convective-scale ensemble is available.

There have been many studies on the verification of CP-EPSs (Klasa et al., 2018, Hagelin et al., 2017, Barret et al., 2016, Beck et al., 2016 amongst the others), but none of them has dealt with the quantification of the skill gained by CP-EPSs in comparison with LR-EPSs, when fully exploited, for specific weather phenomena and for a long enough evaluation period.

In my PhD, I have focused on the sea-breeze phenomenon for different reasons:

  1. Sea breezes have an impact on air quality by advecting pollutants, on heat stress by providing a relief on hot days and also on convection by providing a trigger, especially when interacting with other mesoscale flows (see for examples figure 1 or figures 6, 7 in Golding et al., 2005).
  2. Sea breezes occur on small spatio-temporal scales which are properly resolved at convection-permitting resolutions, but their occurrence is still influenced by synoptic-scale conditions, which are resolved by the global LR-EPS.

Blog_Figure1
Figure 1: MODIS visible of the southeast of Italy on 6th June 2018, 1020 UTC. This shows thunderstorms occurring in the middle of the peninsula, probably triggered by sea-breezes.
Source: worldview.earthdata.nasa.gov

Therefore this study aims to investigate whether the sea breeze is predictable by only knowing a few predictors or whether the better representation of fine-scale structures (e.g. orography, topography) by the CP-EPS implies a better sea-breeze prediction.

In order to estimate probabilistic forecasts from both the models, two different methods have been applied. A novel tracking algorithm for the identification of sea-breeze front, in the domain represented in figure 2, was applied to CP-EPSs data. A Bayesian model was used instead to estimate the probability of sea-breeze conditioned on two LR-EPSs predictors and trained on CP-EPSs data. More details can be found in Cafaro et al. (2018).

Cafaro_Fig2
Figure 2: A map showing the orography over the south UK domain. Orography data are from MOGREPS-UK. The solid box encloses the sub-domain used in this study with red dots indicating the location of synoptic weather stations. Source: Cafaro et al. (2018)

The results of the probabilistic verification are shown in figure 3. Reliability (REL) and resolution (RES) terms have been computed decomposing the Brier score (BS) and Information gain (IGN) score. Finally, scores differences (BSD and IG) have been computed to quantify any gain in the skill by the CP-EPS. Figure 3 shows that CP-EPS forecast is significantly more skilful than the Bayesian forecast. Nevertheless, the Bayesian forecast has more resolution than a climatological forecast (figure 3e,f), which has no resolution by construction.

Cafaro_Fig11
Figure 3: (a)-(d) Reliability and resolution terms calculated for both the forecasts (green for the CP-EPS forecast and blue for LR-EPSs). (e) and (f) represent the Brier score difference (BSD) and Information gain (IG) respectively. Error bars represent the 95th confidence interval. Positive values of BSD and IG indicate that CP-EPS forecast is more skilful. Source: Cafaro et al. (2018)

This study shows the additional skill provided by the Met Office convection-permitting ensemble forecast for the sea-breeze prediction. The ability of CP-EPSs to resolve meso-scale dynamical features is thus proven to be important and only two large-scale predictors, relevant for the sea-breeze, are not sufficient for skilful prediction.

It is believed that both the methodologies can, in principle, be applied to other locations of the world and it is thus hoped they could be used operationally.

References:

Barrett, A. I., Gray, S. L., Kirshbaum, D. J., Roberts, N. M., Schultz, D. M., and Fairman J. G. (2016). The utility of convection-permitting ensembles for the prediction of stationary convective bands. Monthly Weather Review, 144(3):1093–1114, doi: 10.1175/MWR-D-15-0148.1

Beck,  J., Bouttier, F., Wiegand, L., Gebhardt, C., Eagle, C., and Roberts, N. (2016). Development and verification of two convection-allowing multi-model ensembles over Western europe. Quarterly Journal of the Royal Meteorological Society, 142(700):2808–2826, doi: 10.1002/qj.2870

Cafaro C., Frame T. H. A., Methven J., Roberts N. and Broecker J. (2018), The added value of convection-permitting ensemble forecasts of sea breeze compared to a Bayesian forecast driven by the global ensemble, Quarterly Journal of the Royal Meteorological Society., under review.

Golding, B. , Clark, P. and May, B. (2005), The Boscastle flood: Meteorological analysis of the conditions leading to flooding on 16 August 2004. Weather, 60: 230-235, doi: 10.1256/wea.71.05

Hagelin, S., Son, J., Swinbank, R., McCabe, A., Roberts, N., and Tennant, W. (2017). The Met Office convective-scale ensemble, MOGREPS-UK. Quarterly Journal of the Royal Meteorological Society, 143(708):2846–2861, doi: 10.1002/qj.3135

Hohenegger, C. and Schar, C. (2007). Atmospheric predictability at synoptic versus cloud-resolving scales. Bulletin of the American Meteorological Society, 88(11):1783–1794, doi: 10.1175/BAMS-88-11-1783

Klasa, C., Arpagaus, M., Walser, A., and Wernli, H. (2018). An evaluation of the convection-permitting ensemble cosmo-e for three contrasting precipitation events in Switzerland. Quarterly Journal of the Royal Meteorological Society, 144(712):744–764, doi: 10.1002/qj.3245

Lorenz, E. N. (1969). Predictability of a flow which possesses many scales of motion.Tellus, 21:289 – 307, doi: 10.1111/j.2153-3490.1969.tb00444.x

Modelling windstorm losses in a climate model

Extratropical cyclones cause vast amounts of damage across Europe throughout the winter seasons. The damage from these cyclones mainly comes from the associated severe winds. The most intense cyclones have gusts of over 200 kilometres per hour, resulting in substantial damage to property and forestry, for example, the Great Storm of 1987 uprooted approximately 15 million trees in one night. The average loss from these storms is over $2 billion per year (Schwierz et al. 2010) and is second only to Atlantic Hurricanes globally in terms of insured losses from natural hazards. However, the most severe cyclones such as Lothar (26/12/1999) and Kyrill (18/1/2007) can cause losses in excess of $10 billion (Munich Re, 2016). One property of extratropical cyclones is that they have a tendency to cluster (to arrive in groups – see example in Figure 1), and in such cases these impacts can be greatly increased. For example Windstorm Lothar was followed just one day later by Windstorm Martin and the two storms combined caused losses of over $15 billion. The large-scale atmospheric dynamics associated with clustering events have been discussed in a previous blog post and also in the scientific literature (Pinto et al., 2014; Priestley et al. 2017).

Picture1
Figure 1. Composite visible satellite image from 11 February 2014 of 4 extratropical cyclones over the North Atlantic (circled) (NASA).

A large part of my PhD has involved investigating exactly how important the clustering of cyclones is on losses across Europe during the winter. In order to do this, I have used 918 years of high resolution coupled climate model data from HiGEM (Shaffrey et al., 2017) which provides a huge amount of winter seasons and cyclone events for analysis.

In order to understand how clustering affects losses, I first of all need to know how much loss/damage is associated with each individual cyclone. This is done using a measure called the Storm Severity Index (SSI – Leckebusch et al., 2008), which is a proxy for losses that is based on the 10-metre wind field of the cyclone events. The SSI is a good proxy for windstorm loss. Firstly, it scales the wind speed in any particular location by the 98th percentile of the wind speed climatology in that location. This scaling ensures that only the most severe winds at any one point are considered, as different locations have different perspectives on what would be classed as ‘damaging’. This exceedance above the 98th percentile is then raised to the power of 3 due to damage from wind being a highly non-linear function. Finally, we apply a population density weighting to our calculations. This weighting is required because a hypothetical gust of 40 m/s across London will cause considerably more damage than the same gust across far northern Scandinavia, and the population density is a good approximation for the density of insured property. An example of the SSI that has been calculated for Windstorm Lothar is shown in Figure 2.


figure_2_blog_2018_new
Figure 2. (a) Wind footprint of Windstorm Lothar (25-27/12/1999) – 10 metre wind speed in coloured contours (m/s). Black line is the track of Lothar with points every 6 hours (black dots). (b) The SSI field of Windstorm Lothar. All data from ERA-Interim.


From Figure 2b you can see how most of the damage from Windstorm Lothar was concentrated across central/northern France and also across southern Germany. This is because the winds here were most extreme relative to what is the climatology. Even though the winds are highest across the North Atlantic Ocean, the lack of insured property, and a much high climatological winter mean wind speed, means that we do not observe losses/damage from Windstorm Lothar in these locations.

figure_3_blog_2018_new
Figure 3. The average SSI for 918 years of HiGEM data.


I can apply the SSI to all of the individual cyclone events in HiGEM and therefore can construct a climatology of where windstorm losses occur. Figure 3 shows the average loss across all 918 years of HiGEM. You can see that the losses are concentrated in a band from southern UK towards Poland in an easterly direction. This mainly covers the countries of Great Britain, Belgium, The Netherlands, France, Germany, and Denmark.

This blog post introduces my methodology of calculating and investigating the losses associated with the winter season extratropical cyclones. Work in Priestley et al. (2018) uses this methodology to investigate the role of clustering on winter windstorm losses.

This work has been funded by the SCENARIO NERC DTP and also co-sponsored by Aon Benfield.


Email: m.d.k.priestley@pgr.reading.ac.uk


References

Leckebusch, G. C., Renggli, D., and Ulbrich, U. 2008. Development and application of an objective storm severity measure for the Northeast Atlantic region. Meteorologische Zeitschrift. https://doi.org/10.1127/0941-2948/2008/0323.

Munich Re. 2016. Loss events in Europe 1980 – 2015. 10 costliest winter storms ordered by overall losses. https://www.munichre.com/touch/naturalhazards/en/natcatservice/significant-natural-catastrophes/index.html

Pinto, J. G., Gómara, I., Masato, G., Dacre, H. F., Woollings, T., and Caballero, R. 2014. Large-scale dynamics associated with clustering of extratropical cyclones affecting Western Europe. Journal of Geophysical Research: Atmospheres. https://doi.org/10.1002/2014JD022305.

Priestley, M. D. K., Dacre, H. F., Shaffrey, L. C., Hodges, K. I., and Pinto, J. G. 2018. The role of European windstorm clustering for extreme seasonal losses as determined from a high resolution climate model, Nat. Hazards Earth Syst. Sci. Discuss., https://doi.org/10.5194/nhess-2018-165, in review.

Priestley, M. D. K., Pinto, J. G., Dacre, H. F., and Shaffrey, L. C. 2017. Rossby wave breaking, the upper level jet, and serial clustering of extratropical cyclones in western Europe. Geophysical Research Letters. https://doi.org/10.1002/2016GL071277.

Schwierz, C., Köllner-Heck, P., Zenklusen Mutter, E. et al. 2010. Modelling European winter wind storm losses in current and future climate. Climatic Change. https://doi.org/10.1007/s10584-009-9712-1.

Shaffrey, L. C., Hodson, D., Robson, J., Stevens, D., Hawkins, E., Polo, I., Stevens, I., Sutton, R. T., Lister, G., Iwi, A., et al. 2017. Decadal predictions with the HiGEM high resolution global coupled climate model: description and basic evaluation, Climate Dynamics, https://doi.org/10.1007/s00382-016-3075-x.

Future of Cumulus Parametrization conference, Delft, July 10-14, 2017

Email: m.muetzelfeldt@pgr.reading.ac.uk

For a small city, Delft punches above its weight. It is famous for many things, including its celebrated Delftware (Figure 1). It was also the birthplace of one of the Dutch masters, Johannes Vermeer, who coincidentally painted some fine cityscapes with cumulus clouds in them (Figure 2). There is a university of technology with some impressive architecture (Figure 3). It holds the dubious honour of being the location of the first assassination using a pistol (or so we were told by our tour guide), when William of Orange was shot in 1584. To this list, it can now add hosting a one-week conference on the future of cumulus parametrization, and hopefully bringing about more of these conferences in the future.

Delftware_display

Figure 1: Delftware.

Vermeer-view-of-delft

Figure 2: Delft with canopy of cumulus clouds. By Johannes Vermeer, 1661.

Delft_AULA

Figure 3: AULA conference centre at Delft University of Technology – where we were based for the duration of the conference.

So what is a cumulus parametrization scheme? The key idea is as follows. Numerical weather and climate models work by splitting the atmosphere into a grid, with a corresponding grid length representing the length of each of the grid cells. By solving equations that govern how the wind, pressure and heating interact, models can then be used to predict what the weather will be like days in advance in the case of weather modelling. Or a model can predict how the climate will react to any forcings over longer timescales. However, any phenomena that are substantially smaller than this grid scale will not be “seen” by the models. For example, a large cumulonimbus cloud may have a horizontal extent of around 2km, whereas individual grid cells could be 50km in the case of a climate model. A cumulonimbus cloud will therefore not be explicitly modelled, but it will still have an effect on the grid cell in which it is located – in terms of how much heating and moistening it produces at different levels. To capture this effect, the clouds are parametrized, that is, the vertical profile of the heating and moistening due to the clouds are calculated based on the conditions in the grid cell, and this then affects the grid-scale values of these variables. A similar idea applies for shallow cumulus clouds, such as the cumulus humilis in Vermeer’s painting (Figure 2), or present-day Delft (Figure 3).

These cumulus parametrization schemes are a large source of uncertainty in current weather and climate models. The conference was aimed at bringing together the community of modellers working on these schemes, and working out which might be the best directions to go in to improve these schemes, and consequently weather and climate models.

Each day was a mixture of listening to presentations, looking at posters and breakout discussion groups in the afternoon, as well as plenty of time for coffee and meeting new people. The presentations covered a lot of ground: from presenting work on state-of-the-art parametrization schemes, to looking at how the schemes perform in operational models, to focusing on one small aspect of a scheme and modelling how that behaves in a high resolution model (50m resolution) that can explicitly model individual clouds. The posters were a great chance to see the in-depth work that had been done, and to talk to and exchange ideas with other scientists.

Certain ideas for improving the parametrization schemes resurfaced repeatedly. The need for scale-awareness, where the response of the parametrization scheme takes into account the model resolution, was discussed. One idea for doing this was the use of stochastic schemes to represent the uncertainty of the number of clouds in a given grid cell. The concept of memory also cropped up – where the scheme remembers if it had been active at a given grid cell in a previous point in time. This also ties into the idea of transitions between cloud regimes, e.g. when a stratocumulus layer splits up into individual cumulus clouds. Many other, sometimes esoteric, concepts were discussed, such as the role of cold pools, how much tuning of climate models is desirable and acceptable, how we should test our schemes, and what the process of developing the schemes should look like.

In the breakout groups, everyone was encouraged to contribute, which made for an inclusive atmosphere in which all points of view were taken on board. Some of the key points of agreement from these were that it was a good idea to have these conferences, and we should do it more often! Hopefully, in two years’ time, another PhD student will write a post on how the next meeting has gone. We also agreed that it would be beneficial to be able to share data from our different high resolution runs, as well as to be able to compare code for the different schemes.

The conference provided a picture of what the current thinking on cumulus parametrization is, as well as which directions people think are promising for the future. It also provided a means for the community to come together and discuss ideas for how to improve these schemes, and how to collaborate more closely with future projects such as ParaCon and HD(CP)2.

Sting Jet: the poisonous (and windy) tail of some of the most intense UK storms

Email: a.volonte@pgr.reading.ac.uk

IDL TIFF file
Figure 1: Windstorm Tini (12 Feb 2014) passes over the British Isles bringing extreme winds. A Sting Jet has been identified in the storm. Image courtesy of NASA Earth Observatory

It was the morning of 16th October when South East England got battered by the Great Storm of 1987. Extreme winds occurred, with gusts of 70 knots or more recorded continually for three or four consecutive hours and maximum gusts up to 100 knots. The damage was huge across the country with 15 million trees blown down and 18 fatalities.

case_study_great_storm_fig011
Figure 2: Surface wind gusts in the Great Storm of 1987. Image courtesy of UK Met Office.

The forecast issued on the evening of 15th October failed to identify the incoming hazard but forecasters were not to blame as the strongest winds were actually due to a phenomenon that had yet to be discovered at the time: the Sting Jet. A new topic of weather-related research had started: what was the cause of the exceptionally strong winds in the Great Storm?

It was in Reading at the beginning of 21st century that scientists came up with the first formal description of those winds, using observations and model simulations. Following the intuitions of Norwegian forecasters they used the term Sting Jet, the ‘sting at the end of the tail’. Using some imagination we can see the resemblance of the bent-back cloud head with a scorpion’s tail: strong winds coming out from its tip and descending towards the surface can then be seen as the poisonous sting at the end of the tail.

Conceptual+model+of+storm+development
Figure 3: Conceptual model of a sting-jet extratropical cyclone, from Clark et al, 2005. As the cloud head bends back and the cold front moves ahead we can see the Sting Jet exiting from the cloud tip and descending into the opening frontal fracture.  WJ: Warm conveyor belt. CJ: Cold conveyor belt. SJ: Sting jet.

In the last decade sting-jet research progressed steadily with observational, modelling and climatological studies confirming that the strong winds can occur relatively often, that they form in intense extratropical cyclones with a particular shape and are caused by an additional airstream that is neither related to the Cold nor to the Warm Conveyor Belt. The key questions are currently focused on the dynamics of Sting Jets: how do they form and accelerate?

Works recently published (and others about to come out, stay tuned!) claim that although the Sting Jet occurs in an area in which fairly strong winds would already be expected given the morphology of the storm, a further mechanism of acceleration is needed to take into account its full strength. In fact, it is the onset of mesoscale instabilities and the occurrence of evaporative cooling on the airstream that enhances its descent and acceleration, generating a focused intense jet (see references for more details). It is thus necessary a synergy between the general dynamics of the storm and the local processes in the cloud head in order to produce what we call the Sting Jet .

plot_3D_sj ccb_short
Figure 4: Sting Jet (green) and Cold Conveyor Belt (blue) in the simulations of Windstorm Tini. The animation shows how the onset of the strongest winds is related to the descent of the Sting Jet. For further details on this animation and on the analysis of Windstorm Tini see here.

References:

http://www.metoffice.gov.uk/learning/learn-about-the-weather/weather-phenomena/case-studies/great-storm

Browning, K. A. (2004), The sting at the end of the tail: Damaging winds associated with extratropical cyclones. Q.J.R. Meteorol. Soc., 130: 375–399. doi:10.1256/qj.02.143

Clark, P. A., K. A. Browning, and C. Wang (2005), The sting at the end of the tail: Model diagnostics of fine-scale three-dimensional structure of the cloud head. Q.J.R. Meteorol. Soc., 131: 2263–2292. doi:10.1256/qj.04.36

Martínez-Alvarado, O., L.H. Baker, S.L. Gray, J. Methven, and R.S. Plant (2014), Distinguishing the Cold Conveyor Belt and Sting Jet Airstreams in an Intense Extratropical Cyclone. Mon. Wea. Rev., 142, 2571–2595, doi: 10.1175/MWR-D-13-00348.1.

Hart, N.G., S.L. Gray, and P.A. Clark, 0: Sting-jet windstorms over the North Atlantic: Climatology and contribution to extreme wind risk. J. Climate, 0, doi: 10.1175/JCLI-D-16-0791.1.

Volonté, A., P.A. Clark, S.L. Gray. The role of Mesoscale Instabilities in the Sting-Jet dynamics in Windstorm Tini. Poster presented at European Geosciences Union – General Assembly 2017, Dynamical Meteorology (General session)

Understanding the dynamics of cyclone clustering

Priestley, M. D. K., J. G. Pinto, H. F. Dacre, and L. C. Shaffrey (2016), Rossby wave breaking, the upper level jet, and serial clustering of extratropical cyclones in western Europe, Geophys. Res. Lett., 43, doi:10.1002/2016GL071277.

Email: m.d.k.priestley@pgr.reading.ac.uk

Extratropical cyclones are the number one natural hazard that affects western Europe (Della-Marta, 2010). These cyclones can cause widespread socio-economic damage through extreme wind gusts that can damage property, and also through intense precipitation, which may result in prolonged flood events. For example the intensely stormy winter of 2013/2014 saw 456mm of rain fall in under 90 days across the UK; this broke records nationwide as 175% of the seasonal average fell (Kendon & McCarthy, 2015). One particular storm in this season was cyclone Tini (figure 1), this was a very deep cyclone (minimum pressure – 952 hPa) which brought peak gusts of over 100 mph to the UK. These gusts caused widespread structural damage that resulted in 20,000 homes losing power. These extremes can be considerably worse when multiple extratropical cyclones affect one specific geographical region in a very short space of time. This is known as cyclone clustering. Some of the most damaging clustering events can result in huge insured losses, for example the storms in the winter of 1999/2000 resulted in €16 billion of losses (Swiss Re, 2016); this being more than 10 times the annual average.

figure-1
Figure 1. A Meteosat visible satellite image at 12 UTC on February 12th 2014 showing cyclone Tini over the UK. Image credit to NEODAAS/University of Dundee.

Up until recently cyclone clustering had been given little attention in terms of scientific research, despite it being a widely accepted phenomenon in the scientific community. With these events being such high risk events it is important to understand the atmospheric dynamics that are associated with these events; and this is exactly what we have been doing recently. In our new study we attempt to characterise cyclone clustering in several different locations and associate each different set of clusters with a different dynamical setup in the upper troposphere. The different locations we focus on are defined by three areas, one encompassing the UK and centred at 55°N. Our other two areas are 10° to the north and south of this (centred at 65°N and 45°N.) The previous study of Pinto et al. (2014) examined several winter seasons and found links between the upper-level jet, Rossby wave breaking (RWB) and the occurrence of clustering. RWB is the meridional overturning of air in the upper troposphere. It is identified using the potential temperature (θ) field on the dynamical tropopause, with a reversal of the normal equator-pole θ gradient representing RWB. This identification method is explained in full in Masato et al. (2013) and also illustrated in figure 2. We have greatly expanded on this analysis to look at all winter clustering events from 1979/1980 to 2014/2015 and their connection with these dynamical features.

schematic_box1
Figure 2. Evolution of Rossby waves on the tropopause. RWB occurs when these waves overturn by a significant amount. H: High potential temperature; L: Low potential temperature (Priestley et al., 2017).

We find that when we get clustering it is accompanied with a much stronger jet at 250 hPa than in the climatology, with average speeds peaking at over 50 ms-1 (figures 3a-c). In all cases there is also a much greater presence of RWB in regions not seen from the climatology (Figure 3d). In figure 3a there is more RWB to the south of the jet, in figure 3b there is an increased presence on both the northern and southern flanks, and finally in figure 3c there is much more RWB to the north. The presence of this anomalous RWB transfers momentum into the jet, which acts to strengthen and extend it toward western Europe.

figure-2
Figure 3. The dynamical setup for clustering occurring at (a) 65°N; (b) 55°N; and (c) 45°N. The climatology is shown in (d). Coloured shading is the average potential temperature on the tropopause, black contours are the average 250 hPa wind speeds and black crosses are where RWB is occurring.

The location of the RWB controls the jet tilt; more RWB to the south of the jet acts to angle it more northwards (figure 3a), there is a southward deflection when there is more RWB to the north of the jet (figure 3c). The presence of RWB on both sides extends it along a more central axis (figure 3b). Therefore the occurrence of RWB in a particular location and the resultant angle of the jet acts to direct cyclones to various parts of western Europe in quick succession.

In our recently published study we go into much more detail regarding the variability associated with these dynamics and also how the jet and RWB interact in time. This can be found at http://dx.doi.org/10.1002/2016GL071277.

This work is funded by NERC via the SCENARIO DTP and is also co-sponsored by Aon Benfield.

References

Della-Marta, P. M., Liniger, M. A., Appenzeller, C., Bresch, D. N., Köllner-Heck, P., & Muccione, V. (2010). Improved estimates of the European winter windstorm climate and the risk of reinsurance loss using climate model data. Journal of Applied Meteorolo

Kendon, M., & McCarthy, M. (2015). The UK’s wet and stormy winter of 2013/2014. Weather, 70(2), 40-47.

Masato, G., Hoskins, B. J., & Woollings, T. (2013). Wave-breaking characteristics of Northern Hemisphere winter blocking: A two-dimensional approach. Journal of Climate, 26(13), 4535-4549.

Pinto, J. G., Gómara, I., Masato, G., Dacre, H. F., Woollings, T., & Caballero, R. (2014). Large‐scale dynamics associated with clustering of extratropical cyclones affecting Western Europe. Journal of Geophysical Research: Atmospheres, 119(24).

Priestley, M. D. K., J. G. Pinto, H. F. Dacre, and L. C. Shaffrey (2017). The role of cyclone clustering during the stormy winter of 2013/2014. Manuscript in preparation.

Swiss Re. (2016). Winter storm clusters in Europe, Swiss Re publishing, Zurich, 16 pp., http://www.swissre.com/library/winter_storm_clusters_in_europe.html. Accessed 24/11/16.