New Forecast Model Provides First Global Scale Seasonal River Flow Forecasts

new_web_figure2_rivernetwork

Over the past ~decade, extended-range forecasts of river flow have begun to emerge around the globe, combining meteorological forecasts with hydrological models to provide seasonal hydro-meteorological outlooks. Seasonal forecasts of river flow could be useful in providing early indications of potential floods and droughts; information that could be of benefit for disaster risk reduction, resilience and humanitarian aid, alongside applications in agriculture and water resource management.

While seasonal river flow forecasting systems exist for some regions around the world, such as the U.S., Australia, Africa and Europe, the forecasts are not always accessible, and forecasts in other regions and at the global scale are few and far between.  In order to gain a global overview of the upcoming hydrological situation, other information tends to be used – for example historical probabilities based on past conditions, or seasonal forecasts of precipitation. However, precipitation forecasts may not be the best indicator of floodiness, as the link between precipitation and floodiness is non-linear. A recent paper by Coughlan-de-Perez et al (2017), “should seasonal rainfall forecasts be used for flood preparedness?”, states:

“Ultimately, the most informative forecasts of flood hazard at the seasonal scale are streamflow forecasts using hydrological models calibrated for individual river basins. While this is more computationally and resource intensive, better forecasts of seasonal flood risk could be of immense use to the disaster preparedness community.”

twitter_screenshotOver the past months, researchers in the Water@Reading* research group have been working with the European Centre for Medium-Range Weather Forecasts (ECMWF), to set up a new global scale hydro-meteorological seasonal forecasting system. Last week, on 10th November 2017, the new forecasting system was officially launched as an addition to the Global Flood Awareness System (GloFAS). GloFAS is co-developed by ECMWF and the European Commission’s Joint Research Centre (JRC), as part of the Copernicus Emergency Management Services, and provides flood forecasts for the entire globe up to 30 days in advance. Now, GloFAS also provides seasonal river flow outlooks for the global river network, out to 4 months ahead – meaning that for the first time, operational seasonal river flow forecasts exist at the global scale – providing globally consistent forecasts, and forecasts for countries and regions where no other forecasts are available.

The new seasonal outlook is produced by forcing the Lisflood hydrological river routing model with surface and sub-surface runoff from SEAS5, the latest version of ECMWF’s seasonal forecasting system, (also launched last week), which consists of 51 ensemble members at ~35km horizontal resolution. Lisflood simulates the groundwater and routing processes, producing a probabilistic forecast of river flow at 0.1o horizontal resolution (~10km, the resolution of Lisflood) out to four months, initialised using the latest ERA-5 model reanalysis.

The seasonal outlook is displayed as three new layers in the GloFAS web interface, which is publicly (and freely) available at www.globalfloods.eu. The first of these gives a global overview of the maximum probability of unusually high or low river flow (defined as flow exceeding the 80th or falling below the 20th percentile of the model climatology), during the 4-month forecast horizon, in each of the 306 major world river basins used in GloFAS-Seasonal.

new_web_figure1_basins
The new GloFAS Seasonal Outlook Basin Overview and River Network Layers.

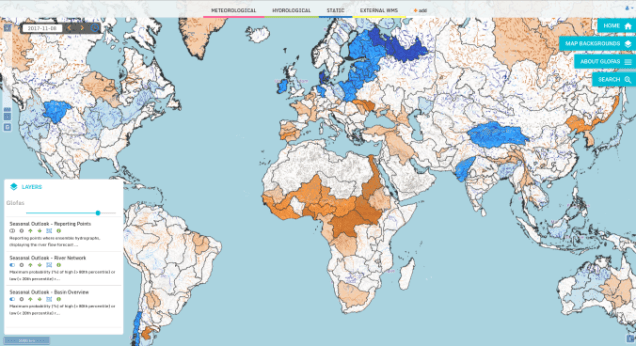
The second layer provides further sub-basin-scale detail, by displaying the global river network (all pixels with an upstream area >1500km2), again coloured according to the maximum probability of unusually high or low river flow during the 4-month forecast horizon. In the third layer, reporting points with global coverage are displayed, where more forecast information is available. At these points, an ensemble hydrograph is provided showing the 4-month forecast of river flow, with thresholds for comparison of the forecast to typical or extreme conditions based on the model climatology. Also displayed is a persistence diagram showing the weekly probability of exceedance for the current and previous three forecasts.

blog_screenshot
The new GloFAS Seasonal Outlook showing the river network and reporting points providing hydrographs and persistence diagrams.

Over the coming months, an evaluation of the system will be completed – for now, users are advised to evaluate the forecasts for their particular application. We welcome any feedback on the forecast visualisations and skill – feel free to contact me at the email address below!

To find out more, you can see the University’s press release here, further information on SEAS5 here, and the user information on the seasonal outlook GloFAS layers here.

*Water@Reading is “a vibrant cross-faculty centre of research excellence at the University of Reading, delivering world class knowledge in water science, policy and societal impacts for the UK and internationally.”

Full list of collaborators: 

Rebecca Emerton1,2, Ervin Zsoter1,2, Louise Arnal1,2, Prof. Hannah Cloke1, Dr. Liz Stephens1, Dr. Florian Pappenberger2, Prof. Christel Prudhomme2, Dr Peter Salamon3, Davide Muraro3, Gabriele Mantovani3

1 University of Reading
2 ECMWF
3 European Commission JRC

Contact: r.e.emerton@pgr.reading.ac.uk

Can we really use El Niño to predict flooding?

R. Emerton, H. Cloke, E. Stephens, E. Zsoter, S. Woolnough, F. Pappenberger (2017). Complex picture for likelihood of ENSO-driven flood hazard. Nature Communications. doi: 10.1038/NCOMMS14796

Email: r.e.emerton@pgr.reading.ac.uk

When an El Niño is declared, or even forecast, we think back to memorable past El Niños (such as 1997/98), and begin to ask whether we will see the same impacts. Will California receive a lot of rainfall? Will we see droughts in tropical Asia and Australia? Will Peru experience the same devastating floods as in 1997/98, and 1982/83?

news_headlines_elnino

El Niño and La Niña, which see changes in the ocean temperatures in the tropical Pacific, are well known to affect weather, and indeed river flow and flooding, around the globe. But how well can we estimate the potential impacts of El Niño and La Niña, and how likely flooding is to occur?

This question is what some of us in the Water@Reading research group at the University of Reading have been looking to answer in our recent publication in Nature Communications. As part of our multi- and inter-disciplinary research, we work closely with the Red Cross / Red Crescent Climate Centre (RCCC), who are working on an initiative called Forecast-based Financing (FbF, Coughlan de Perez et al.). FbF aims to distribute aid (for example providing water purification tablets to prevent spread of disease, or digging trenches to divert flood water) ahead of a flood, based on forecasts. This approach helps to reduce the impact of the flood in the first place, rather than working to undo the damage once the flood has already occurred.

Photo credit: Red Cross / Red Crescent Climate Centre

In Peru, previous strong El Niños in 1982/83 and 1997/98 had resulted in devastating floods in several regions. As such, when forecasts in early 2015 began to indicate a very strong El Niño was developing, the RCCC and forecasters at the Peruvian national hydrological and meteorology agency (SENAMHI) began to look into the likelihood of flooding, and what FbF actions might need to be taken.

Typically, statistical products indicating the historical probability (likelihood [%] based on what happened during past El Niños) of extreme precipitation are used as a proxy for whether a region will experience flooding during an El Niño (or La Niña), such as these maps produced by the IRI (International Research Institute for Climate and Society). You may also have seen maps which circle regions of the globe that will be drier / warmer / wetter / cooler – we’ll come back to these shortly.

These rainfall maps show that Peru, alongside several other regions of the world, is likely to see more rainfall than usual during an El Niño. But does this necessarily mean there will be floods? And what products are out there indicating the effect of El Niño on rivers across the globe?

For organisations working at the global scale, such as the RCCC and other humanitarian aid agencies, global overviews of potential impacts are key in taking decisions on where to focus resources during an El Niño or La Niña. While these maps are useful for looking at the likely changes in precipitation, it has been shown that the link between precipitation and flood magnitude is nonlinear (Stephens et al.),  – more rain does not necessarily equal floods – so how does this transfer to the potential for flooding?

The motivation behind this work was to provide similar information, but taking into account the hydrology as well as the meteorology. We wanted to answer the question “what is the probability of flooding during El Niño?” not only for Peru, but for the global river network.

To do this, we have taken the new ECMWF ERA-20CM ensemble model reconstruction of the atmosphere, and run this through a hydrological model to produce the first 20th century global hydrological reconstruction of river flow. Using this new dataset, we have for the first time estimated the historical probability of increased or decreased flood hazard (defined as abnormally high or low river flow) during an El Niño (or La Niña), for the global river network.

elnino_flood_hazard_gif_beccalize
Figure 1: The probability of increased (blue) or decreased (red) flood hazard during each month of an El Nino. Based on the ensemble mean of the ERA-20CM-R 20th century river flow reconstruction.

The question – “what is the probability of flooding during El Niño?”, however, remains difficult to answer. We now have maps of the probability of abnormally high or low river flow (see Figure 1), and we see clear differences between the hydrological analysis and precipitation. It is also evident that the probabilities themselves are often lower, and much more uncertain, than might be useful – how do you make a decision on whether to provide aid to an area worried about flooding, when the probability of that flooding is 50%?

blob_floodhazard_comparison_map
Figure 2: Historical probability of increased / decreased flood hazard map for February, with overlay showing the typical impact map for winter during an El Nino. This highlights the complexity of the link between El Nino and flooding compared to the information usually available.

The likely impacts are much more complex than is often perceived and reported – going back to the afore-mentioned maps that circle regions of the globe and what their impact will be (warmer, drier, wetter?) – these maps portray these impacts as a certainty, not a probability, with the same impacts occurring across huge areas. For example, in Figure 2, we take one of the maps from our results, which indicates the probability of increased or decreased flood hazard in one month during an El Niño, and draw over this these oft-seen circles of potential impacts. In doing this, we remove all information on how likely (or unlikely) the impacts are, smaller scale changes within these circles (in some cases our flood hazard map even indicates a different impact), and a lot of the potential impacts outside of these circles – not to mention the likely impacts can change dramatically from one month to the next. For those organisations that take actions based on such information, it is important to be aware of the uncertainties surrounding the likely impacts of El Niño and La Niña.

“We conclude that while it may seem possible to use historical probabilities to evaluate regions across the globe that are more likely to be at risk of flooding during an El Niño / La Niña, and indeed circle large areas of the globe under one banner of wetter or drier, the reality is much more complex.”

PS. During the winter of 2015/16, our results estimated an ~80% likelihood of increased flood hazard in northern coastal Peru, with only ~10% uncertainty surrounding this. The RCCC took FbF actions to protect thousands of families from potentially devastating floods driven by one of the strongest El Niños on records. While flooding did occur, this was not as severe as expected based on the strength of the El Niño. More recently, during the past few months (January – March 2017), anomalously high sea surface temperatures (SSTs) in the far eastern Pacific (known as a “coastal El Niño” in Peru but not widely acknowledged as an El Niño because central Pacific SSTs are not anomalously warm) have led to devastating flooding in several regions and significant loss of life. And Peru wasn’t the only place that didn’t see the impacts it expected in 2015/16; other regions of the world, such as the US, also saw more rainfall than normal in places that were expected to be drier, and California didn’t receive the deluge they were perhaps hoping for. It’s important to remember that no two El Niños are the same, and El Niño will not be the only influence on the weather around the globe. While El Niño and La Niña can provide some added predictability to the atmosphere, the impacts are far from certain.

Presidente Kuczynski recorre zonas afectadas por lluvias e inund
Flooded areas of Trujillo, Peru, March 2017. Photo credit: Presidencia Peru, via Floodlist

Full reference:

R. Emerton, H. Cloke, E. Stephens, E. Zsoter, S. Woolnough, F. Pappenberger (2017). Complex picture for likelihood of ENSO-driven flood hazard. Nature Communications. doi: 10.1038/NCOMMS14796

Press Release: