Email: m.muetzelfeldt@pgr.reading.ac.uk
Current generation climate models are typically run with horizontal resolutions of 25–50 km. This means that the models cannot explicitly represent atmospheric phenomena that are smaller than these resolutions. An analogy for this is with the resolution of a camera: in a low-resolution, blocky image you cannot make out all the finer details. In the case of climate models, the unresolved phenomena might still be important for what happens at the larger, resolved scales. This is true for convective clouds – clouds such as cumulus and cumulonimbus that are formed from differences in density, caused by latent heat release, between the clouds and the environmental air. Convective clouds are typically around hundreds to thousands of metres in their horizontal size, and so are much smaller than the size of individual grid-columns of a climate model.
Convective clouds are produced by instability in the atmosphere. Air that rises ends up being warmer, and so less dense, than the air that surrounds it, due to the release of latent heat as water is formed by the condensation of water vapour. The heating they produce acts to reduce this instability, leading to a more stable atmosphere. To ensure that this stabilizing effect is included in climate model simulations, convective clouds are represented through what is called a convection parametrization scheme – the stabilization is boiled down to a small number of parameters that model how the clouds act to reduce the instability in a given grid-column. The parametrization scheme then models the action of the clouds in a grid-column by heating the atmosphere higher up, which reduces the instability.
Convection parametrization schemes work by making a series of assumptions about the convective clouds in each grid-column. These include the assumption that there will be many individual convective clouds in grid-columns where convection is active (Fig. 1), and that these clouds will only interact through stabilizing a shared environment. However, in nature, many forms of convective organization are observed, which are not currently represented by convection parametrization schemes.

Figure 1: From Arakawa and Schubert, 1974. Cloud field with many clouds in it – each interacting with each other only by modifying a shared environment.
In my PhD, I am interested in how vertical wind shear can cause the organization of convective cloud fields. Wind shear occurs when the wind is stronger at one height than another. When there is wind shear in the lower part of the atmosphere – the boundary layer – it can organize individual clouds into much larger cloud groups. An example of this is squall lines, which are often seen over the tropics and in mid-latitudes over the USA and China. Squall lines are a type of Mesoscale Convective System (MCS), which account for a large part of the total precipitation over the tropics – between 50 – 80 %. Including their effects in a climate model can therefore have an impact of the distribution of precipitation over the tropics, which is one area where there are substantial discrepancies between climate models and observations.
The goal of my PhD is to work out how to represent shear-induced organization of cloud fields in a climate model’s convection parametrization scheme. The approach I am taking is as follows. First, I need to know where in the climate model the organization of convection is likely to be active. To do this, I have developed a method for examining all of the wind profiles that are produced by the climate model over the tropics, and grouping these into a set of 10 wind profiles that are probably associated with the organization of convection. The link between organization and each grid-column is made by checking that the atmospheric conditions have enough instability to produce convective clouds, and that there is enough low-level shear to make organization likely to happen. With these wind profiles in hand, where they occur can be worked out (Fig. 2 shows the distribution for one of these profiles). The distributions can be compared with distributions of MCSs from satellite observations, and the similarities between the distributions builds confidence that the method is finding wind profiles that are associated with the organization of convection.
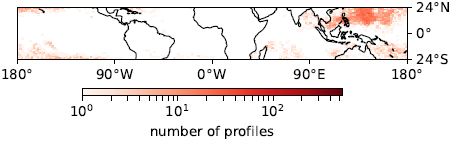
Figure 2: Geographical distribution of one of the 10 wind profiles that represents where organization is likely to occur over the tropics. The profile shows a high degree of activity in the north-west tropical Pacific, an area where organization of convection also occurs. This region can be matched to an area of high MCS activity from a satellite derived climatology produced by Mohr and Zipser, 1996.
Second, with these profiles, I can run a set of high-resolution idealized models. The purpose of these is to check that the wind profiles do indeed cause the organization of convection, then to work out a set of relationships that can be used to parametrize the organization that occurs. Given the link between low-level shear and organization, it seems like a good place to start is to check that this link appears in my experiments. Fig. 3 shows the correlation between the low-level shear, and a measure of organization. A clear relationship is seen to hold between these two variables, providing a simple means of parametrizing the degree of organization from the low-level shear in a grid-column.

Figure 3: Correlation of low-level shear (LLS) against a measure of organization (cluster_index). A high degree of correlation is seen, and r-squared values close to 1 indicate that a lot of the variance of cluster_index is explained by the LLS. A p-value of less than 0.001 indicates this is unlikely to have occurred by chance.
Finally, I will need to modify a convection parametrization scheme in light of the relationships that have been uncovered and quantified. To do this, the way that the parametrization scheme models the convective cloud field must be changed to reflect the degree of organization of the clouds. One way this could be done would be by changing the rate at which environmental air mixes into the clouds (the entrainment rate), based on the amount of organization predicted by the new parametrization. From the high-resolution experiments, the strength of the clouds was also seen to be related to the degree of organization, and this implies that a lower value for the entrainment rate should be used when the clouds are organized.
The proof of the pudding is, as they say, in the eating. To check that this change to a parametrization scheme produces sensible changes to the climate model, it will be necessary to make the changes and to run the model. Then the differences in, for example, the distribution of precipitation between the control and the changed climate model can be tested. The hope is then that the precipitation distributions in the changed model will agree more closely with observations of precipitation, and that this will lead to increased confidence that the model is representing more of the aspects of convection that are important for its behaviour.
- Arakawa, A., & Schubert, W. H. (1974). Interaction of a cumulus cloud ensemble with the large-scale environment, Part I. Journal of the Atmospheric Sciences, 31(3), 674-701.
- Mohr, K. I., & Zipser, E. J. (1996). Mesoscale convective systems defined by their 85-GHz ice scattering signature: Size and intensity comparison over tropical oceans and continents. Monthly Weather Review, 124(11), 2417-2437.

One thought on “Representing the organization of convection in climate models”