How to write a PhD thesis during a global pandemic

Kaja Milczewska – k.m.milczewska@pgr.reading.ac.uk

Completing a PhD is a momentous task at the best of times, let alone in combination with a year-long global pandemic. Every PhD researcher is different, and as such, everyone has had different circumstantial struggles throughout Covid-19. The lack of human interaction that comes with working in a vibrant academic environment such as the Meteorology Department can make working from home a real struggle. Sometimes it is difficult to find the motivation to get anything useful done; whereas at other times you could squeeze five hours’ worth of work into one. Trying to stay organised is key to getting it done, therefore the following are some of the things that helped me get to the end of my PhD thesis – and it has not been easy. If you are still out there writing and finishing up experiments: read on! Maybe the result is that you might feel a little less alone. The PhD experience can be truly isolating at the best of times, so literally being instructed to isolate from the world is not ideal. The points are numbered for convenience of structuring this post, rather than any order of importance. 

  1. Communicate with your supervisor(s) 

It is tempting to “disappear off the radar” when things are not going well. You could wake up in the morning of the day of your regular weekly meeting, filled with dread that you have not prepared anything for it. Your brain recoils into the depths of your skull as your body recoils back under the safety of the duvet. What are your options? Some of them might be: take a deep gulp and force yourself out of bed with the prospect of coffee before the meeting (where you steer the conversation onto the things you did manage to do); or to postpone the meeting because you need to finish XYZ and thus a later meeting may be more productive; or ignore the meeting altogether. The first one is probably the best option, but it requires mental strength where there might be none. The second one is OK, but you still need to do the work. The last one is a big no. Don’t do it. 

Anxiety will make you believe that ignoring the world and all responsibilities is the most comfortable option in the moment, but the consequences of acting on it could be worse. Supervisors value honesty, and they know well that it is not always possible to complete all the scheduled tasks. Of course, if this happens every week then you might need to introspectively address the reasons for this, and – again, talking with your supervisor is usually a useful thing to do. You might not want them to know your entire life story, but it is helpful for everybody involved if they are aware that you struggle with anxiety / depression / ADHD / *insert any condition here*, which could affect your capacity to complete even the simplest, daily tasks. Being on the same page and having matching expectations is key to any student – supervisor partnership. 

  1.  Reward yourself for the things you have already accomplished. 

Whether that’s mid-week, mid-to-do-list, weekend — whenever. List all the things you have done regularly (either work- or life-related) and recognise that you are trying to survive a pandemic. And trying to complete the monstrous task of writing a PhD thesis. Those are big asks, and the only way to get through them is to break them down into smaller chunks. Putting down “Write thesis” on your to-do list is more likely to intimidate than motivate you. How about breaking it down further: “Re-create plot 4.21”, or “Consolidate supervisor comments on pages 21 – 25” — these are achievable things in a specified length of time. It also means you could tick them off more easily, hopefully resulting in feeling accomplished. Each time this happens, reward yourself in whatever way makes you feel nice. Even just giving yourself a literal pat on the shoulder could feel great – try it! 

  1. Compile supervisor feedback / comments into a spreadsheet  

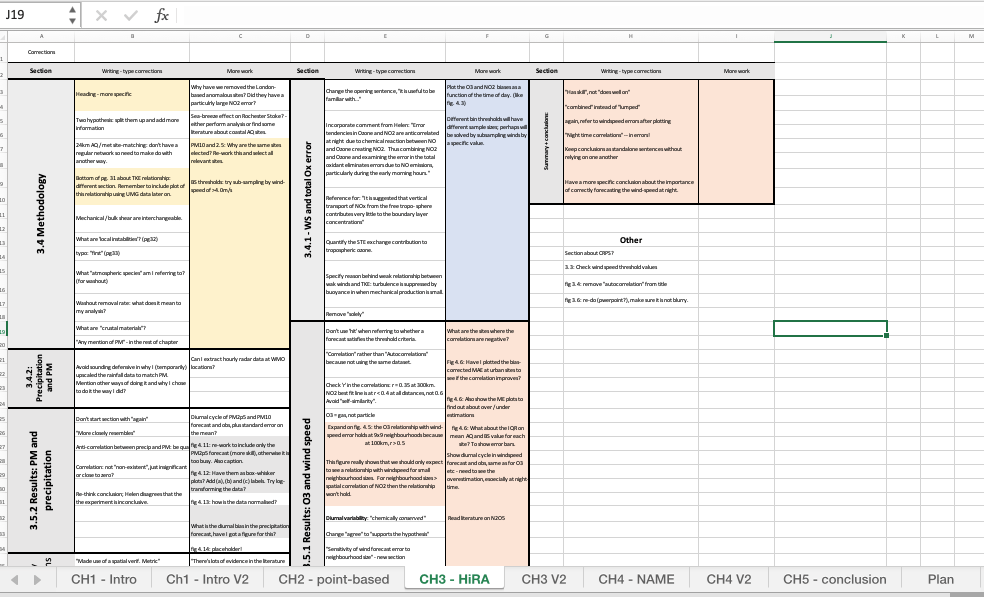
An Excel spreadsheet – or any other suitable system – will enable you to keep track of what still needs addressing and what has been completed. The beauty of using a colour-coded spreadsheet for feedback comments is that once the required corrections are completed, you have concrete evidence of how much you have already achieved – something to consult if you start feeling inadequate at any point (see previous section!). I found this a much easier system than writing it down in my workbook, although of course this does work for some people, too. Anytime you receive feedback on your work – written or otherwise – note them down. I used brief reminders, such as “See supervisor’s comment on page X” but it was useful to have them all compiled together. Also, I found it useful to classify the comments into ‘writing-type’ corrections and ‘more work required’ corrections. The first one is self-explanatory: these were typos, wrong terminologies, mistakes in equations and minor structural changes. The ‘more work required’ was anything that required me to find citations / literature, major structural changes, issues with my scientific arguments or anything else that required more thought. This meant that if my motivation was lacking, I could turn to the “writing-type” comments and work on them without needing too much brain power. It also meant that I could prioritise the major comments first, which made working to a deadline a little bit easier. 

  1. Break down how long specific things will take 

This is most useful when you are a few weeks away from submission date. With only 5 weeks left, my colour-coded charts were full of outstanding comments; neither my ‘Conclusions’ chapter nor my Abstract had been written; plots needed re-plotting and I still did not know the title of my thesis. Naturally, I was panicking. I knew that the only way I could get through this was to set a schedule — and stick to it. At the time, there were 5 major things to do: complete a final version of each of my 5 thesis chapters. A natural split was to allow each chapter only one week for completion. If I was near to running over my self-prescribed deadline, I would prioritise only the major corrections. If still not done by the end of the allowed week: that’s it! Move on. This can be difficult for any perfectionists out there, but by this point the PhD has definitely taught me that “done” is better than perfect. I also found that some chapters took less time to finish than others, so I had time to return to the things I left not quite finished. Trust yourself, and give it your best. By all means, push through the hardest bit to the end, but remember that there (probably) does not exist a single PhD thesis without any mistakes. 

5. Follow useful Twitter threads 

There exist two groups of people: those who turn off or deactivate all social media when they need to focus on a deadline, and those who get even more absorbed by its ability to divert your attention away from the discomfort of the dreaded task at hand. Some might call it “productive procrastination”. I actually found that social media helped me a little – but only when my state of mind was such that I could resist the urge to fall down a scrolling rabbit hole. If you are on Twitter, you might find hashtags like #phdchat and accounts such as @AcademicChatter , @phdforum @phdvoice useful. 

6. Join a virtual “writing room” 

On the back of the last tip, I have found a virtual writing room helpful for focus. The idea is that you join an organised Zoom meeting full of other PhDs, all of whom are writing at the same time. All microphones are muted, but the chat is active so it is nice to say ‘hello!’ to someone else writing at the same time, anywhere else in the world. The meetings have scheduled breaks, with the organiser announcing when they occur. I found that because I actively chose to be up and start writing at the very early hour of 6am by attending the virtual writing room, I was not going to allow myself to procrastinate. The commitment to being up so early and being in a room full of people also doing the same thing (but virtually, obviously) meant that those were the times that I was probably the most focused. These kinds of rooms are often hosted by @PhDForum on Twitter; there could also be others. An alternative idea could be to set up a “writing meeting” with your group of peers and agree to keep chatter to a minimum (although this is not something I tried myself). 

7. Don’t look at the news 

Or at least, minimise your exposure to them. It is generally a good thing to stay on top of current events, but the final stages of writing a PhD thesis are probably unlike any other time in your life. You need the space and energy to think deeply about your own work right now. Unfortunately, I learnt this the hard way and found that there were days where I could do very little work because my brain was preoccupied with awful events happening around the world. It made me feel pathetic, routinely resulting in staying up late to try and finish whatever I failed to finish during the day. This only deteriorated my wellbeing further with shortened sleep and a constant sense of playing “catch-up”. If this sounds like you, then try switching off your news notifications on your phone or computer, or limit yourself to only checking the news homepage once a day at a designated time.  

8. Be honest when asked about how you are feeling 

Many of us tend to downplay or dismiss our emotions. It can be appealing to keep your feelings to yourself, saving yourself the energy involved in explaining the situation to whomever asked. You might also think that you are saving someone else the hassle of worrying about you. The trouble is that if we continuously paper over the cracks in our mental wellbeing within the handful of conversations we are having (which are especially limited during the pandemic), we could stop acknowledging how we truly feel. This does not necessarily mean spilling all the beans to whomever asked the innocent question, “How are you?”. But the catharsis from opening up to someone and acknowledging that things are not quite right could really offload some weight off your shoulders. If the person on the other end is your PhD supervisor, it can also be helpful for them to know that you are having a terrible time and are therefore unable to complete tasks to your best ability. Submission anxiety can be crippling for some people in the final few weeks, and your supervisor just won’t be able to (and shouldn’t) blindly assume how your mental health is being affected by it, because everyone experiences things differently. This goes back to bullet no.1. 

Hopefully it goes without saying that the above are simply some things that helped me through to the end of the thesis, but everybody is different. I am no counsellor or wellbeing guru; just a recently-finished PhD! Hopefully the above points might offer a little bit of light for anyone else struggling through the storm of that final write-up. Keep your chin up and, as Dory says: just keep swimming. Good luck! 

Visiting Scientist Week Preview: Laure Zanna

Kaja Milczewska – k.m.milczewska@pgr.reading.ac.uk

As per annual tradition in the Meteorology Department, PhD students have chosen a distinguished scientist to visit the department for one week. Previous years’ visitors include Prof. Tapio Schneider (Caltech), Prof. Olivia Romppainmen-Martius (University of Bern), and Prof. Cecilia Bitz (University of Washington). This year’s winning vote was New York University’s Prof. Laure Zanna, who will be visiting the department virtually1 between 2 – 6th November. 

Laure is an oceanographer and climate scientist whose career so far has spanned three continents, won her an American Meteorological Society (AMS) Early Careers’ award for “exceptionally creative” science this year, and netted her 600 citations in the last two years.  Her research interests encompass ocean turbulence, climate dynamics, predictability, machine learning and more. Some of the many topics of her published papers include the uncertainty in projections of ocean heat uptake; ocean turbulence parametrisations; predictions of seasonal to decadal sea surface temperatures in the Atlantic using simple statistical models and machine learning to inform prediction of extreme events. Besides being an exceptional scientist, speaker and educator, Laure is a down-to-Earth and friendly person, described by the Climate Scientists podcast’s Dan Jones as ‘a really great person who helps to tie the whole community together’.

As someone who had received their PhD only just over a decade ago, we thought Laure would be the perfect candidate to inspire us and our science through sharing some of her academic experiences with us. Before her visit next week, Laure kindly answered some interview-style questions for this week’s Social Metwork blog post.

Q: What inspired you to research oceanography and climate in the first place?

A: I always enjoyed math and physics. The possibility of using these disciplines to study scientific problems that I could “see” was very appealing.

Q: Why were you drawn to machine learning?

A: The power of machine learning (ML) to advance fields such as natural processing language or computer science is indisputable. I was excited by the premise of ML for climate science. In particular, can ML help deepen our understanding of certain aspects of the climate systems (e.g. interactions between scales or interactions between the ocean and atmosphere)? Can ML improve the representation of small-scale processes in climate models? ML, by itself, is not enough but combined with our physical understanding of the climate system could push the field forward.

Q: Can you give us an idea of what’s the most exciting research you are working on right now?

A: This is impossible. I work on 2 main areas of research right now: understanding and parameterizing ocean mesoscale eddies and understanding the role of the oceans in climate. I am passionate and excited about both topics. Hopefully, you will hear about both of them during the week.

Q: When did you realise/decide you were going to remain in academia?

A: I decided that I wanted to try and stay in academia in the last year of my PhD.  I was lucky enough to be able to.

Q: What is your favourite part of your job?

A: Working with my group!  The students and postdocs in the group have different expertise but all are passionate about their research. They make the work and the research more fun, more challenging, and more inspiring.

We are honoured to have our invitation accepted by Laure and are eagerly anticipating answers to more of these kind of questions throughout next week’s conversations.  Laure will be presenting a seminar titled, “Machine learning for physics-discovery and climate modelling” during the Monday Departmental Seminar series, as well as another seminar in the Climate and Ocean Dynamics research group, titled “Understanding past and future ocean warming”. She will also give a career-focused session at PhD group and, of course, engage with both the PhD students and staff on an individual basis during one-to-one meetings. We are grateful and delighted to be able to welcome Laure to the Meteorology department despite the various difficulties the year 2020 has posed on everyone, so come along to next week’s events!


1In true 2020 curve-ball style, of course.

Air pollution and COVID-19: is ozone an undercover criminal?

Email: k.m.milczewska@pgr.reading.ac.uk

The global COVID-19 lockdown is undoubtedly resulting in curiously low levels of air pollution. Although it might seem inappropriate to seek a silver lining during a global pandemic, the fact that the air really does seem cleaner gives my PhD topic a little more everyday credibility, which – at least for me – is quite nice.

You may have already seen satellite pictures of the effects of the lockdown in northern Italy (and other major cities) on surface nitrogen dioxide (NO2) concentrations. You may have been able to breathe some cleaner air where you live these past few weeks. It feels like we are in the middle of some sort of major air quality experiment, some kind of simulation conducted by a clueless PhD student…

What you might not notice, however, is the rise in near-surface ozone (O3) during a string of warm, sunny days. While it isn’t a primary pollutant like NO2 or particulate matter, O3 is closely associated with the amount of NOx (NO + NO2) in the air. It is also invisible to the naked eye – unless it forms photochemical smog. O3 can be harmful in short bursts of elevated concentrations to people who already suffer with asthma and other respiratory problems, which could prove to be problematic since COVID-19 is itself a respiratory disease.

Weather conditions in Reading throughout the majority of April were favourable for O3 production: lots of solar radiation and weak winds. In fact, Reading experienced its sunniest April on record, along with some of the warmest April days on record. It is therefore not surprising that peak daytime concentrations of O3 creep up over a week of warm, calm weather. For example, a measuring site located between two busy roads in Reading gives a clear indication of what the mixture of favourable conditions alongside low NOx emissions can do: Figure 1 shows that peak daytime concentrations rose everyday between 02/04 – 12/04, when the air was stagnant and thus O3 tended to accumulate within the atmospheric boundary layer. The peak concentrations between 08/04 and 12/04 are typical of “moderate” levels on DEFRA’s Daily Air Quality Index (DAQI), and are close to the WHO safe concentration exceedance guidelines.

Figure 1: From “Air Quality in Reading during COVID-19”, by Helen Dacre [4]. Hourly measured Ozone concentrations at Reading New Town from 1 March 2020 to 15 April 2020. Date of social distancing implementation on 16 March 2020 (magenta dashed) and non-essential travel restrictions on 23 March 2020 (black dashed). Data from http://www.uk-air.defra.gov.uk.

The DAQI is dictated by the highest concentration of any one of the five pollutants deemed harmful to human health: ozone, nitrogen dioxide (NO2), sulphur dioxide (SO2), and PM2.5 / PM10 (particulate matter). Figure 2 shows a moderate DAQI in parts of south and north-east England (and in fact, the map looked a lot more yellow and orange on Friday 04/04).

Figure 2: Daily Air Quality Index (DAQI) in the UK, for Saturday 11/04/2020. Captured from https://uk-air.defra.gov.uk

So although there is a clear trend in unseasonably low NOx concentrations in major cities in many parts of the world (including the UK), why can O3 concentrations rise?

The answer is probably that ozone has a “love-hate” relationship with NOx, Volatile Organic Compunds (VOCs) and the weather. It skyrockets when it’s sunny and skies are blue. High pressure systems and calm weather trap much of the existing ozone within the boundary layer, near to the ground. In particular, if easterly / southerly winds prevail, they can transport both ozone and its precursors from the continent – this often happens when there is an anticyclone over the UK. Therefore, high ozone episodes tend to occur in the spring / summer, due to the frequency of such ozone-favourable conditions.

Fossil fuel combustion releases NOx, some of which is in the form of NO and goes on to oxidise to create more NO2, or it can react with VOCs, or it can directly react with ozone. The usually abundant NO and other VOCs from vehicle emissions and industry are now significantly lower than usual, so the process of ozone scavenging by NO is minimised.

On top of that, NO has a short lifetime (maybe a few minutes), and can quickly oxidise to form NO2, which has a longer lifetime and can therefore travel on to rural areas. Often, rural regions will have higher average ozone concentrations than cities (which might seem counter-intuitive!). Although the emissions in those areas are lower, they can experience net ozone production from the additional NO2 which has travelled downwind from a nearby city.  In relatively clean tropospheric air, the production / destruction of ozone is closely linked to the ratio of NO to NO2 – an equilibrium known as the photostationary state (Leighton, 1961) – and there are some studies to show a negative correlation between annual mean NOx and O3 measurements in both rural and urban areas (e.g. Bower et al., 1989). But none of this is particularly simple, because there will always be VOCs present in air, and ozone production / destruction is also highly sensitive to the ratio of NO : VOC – this was not fully understood until Greiner (1967) and several subsequent studies, which explained the role of the hydroxyl radical OH in the reaction chain to create NO2 without destroying ozone. Another phenomenon is the ‘weekend effect’, where weekday emissions tend to be quite different from emissions during the weekend because there is no morning / evening rush-hour traffic and resultant NO (Seguel et al., 2012). If VOC levels remain high, ozone production is favoured.

Figure 3: From Bower et al., 1989. Points on the scatterplot represent mean annual NOx and winter mean O3 measurements taken at 8 rural and 2 urban background sites in the UK. Pearson correlation coefficient r = -0.91.

Let us return to the present day. How might the weather conditions affect the delicate balance between NOx, VOCs and ozone? And what about other particles closely monitored throughout the pandemic, such as particulate matter (PM)?

February was unusually wet and windy in the UK. Strong winds can disperse both NO2 and PM, while rain is an efficient sink of PM by physically washing out the particles. Both pollutants have been monitored closely at a number of locations globally over the past few weeks, as they are good indicators of emissions (and ozone is not). Before the gloriously sunny weather came, I wondered about ways of distinguishing between causes of the unusually low NO2 / PM concentrations: what proportion is attributable to the lockdown, and what is attributable to a very wet and windy February / March period in this region? How might ambient ozone concentrations change as we move into the summer, as lockdown measures might begin to gradually relax and pollution returns to pre-lockdown levels? And what does this mean for people who are vulnerable to respiratory issues aggravated by ozone? All these questions – and many more – are currently being explored by air quality experts all over the world, hopefully reaching some conclusions in time for us all to act on them timely and appropriately.

Stay home, stay safe, and thank you for reading. Please leave a comment or send an email if you have any questions (I’ll be happy to answer) or corrections: I am a PhD student and there are probably still some gaps in my understanding.

For further reading: The Copernicus Atmosphere Monitoring Service (CAMS) are providing vital satellite observations of interest to COVID-19 matters, which I encourage you to check out if you are interested in the air quality aspects of the pandemic.

Relationships in errors between meteorological forecasts and air quality forecasts

Email: K.M.Milczewska@pgr.reading.ac.uk

Exposure to pollutants in the air we breathe may trigger respiratory problems. Pollutants such as ozone (O_{3}) and particulate matter (PM_{2.5}) – particles of about 1/20th of the width of a hair strand – can get into our lungs and cause inflammation, alter their function, or otherwise cause trouble for the cardiovascular system – especially in people with existing underlying respiratory conditions. Although high pollution episodes in the UK are infrequent, the public becomes aware of the associated problems during events such as red skies, in part caused by long-range transport of Saharan dust. Furthermore, the World Health Organisation (WHO) estimates that 85% of UK towns regularly exceed the safe annual PM_{2.5} limit. It is therefore important to forecast surface pollution concentrations accurately in order to enable the public to mitigate some of those adverse health risks.

Figure 1: Smog in London (December 1952). This 5-day event caused many deaths attributable to elevated concentrations of pollutants. The Clean Air Act of 1956 followed. Credit: TopFoto / The Image Works.

In general, air pollution can be difficult to forecast near the surface because of the multitude of factors which affect it. Incorrectly modelling chemical processes within the atmosphere, surface emissions or indeed the meteorology can lead to errors in predicting ground-level pollution concentrations. It is well accepted within the literature that weather forecasting is of decisive importance for air quality. Thus, my PhD project tries to link forecast errors in meteorological processes within the atmospheric boundary layer (BL) with forecast errors in pollutants such as O_{3} and NO_{2} (nitrogen dioxide) using the operational air quality forecasting model in the UK, the Air Quality in the Unified Model (AQUM). This model produces an hourly air quality forecast issued to the public by DEFRA in the form of a Daily Air Quality Index (DAQI) and is verified against surface-based observations from the Automatic Urban and Rural Network (AURN).

Figure 2: Automatic Urban and Rural Network (AURN) ground-based measuring sites for O_{3} and NO_{2}.

A three-month evaluation of hourly forecasts from AQUM shows a delay in the average increase of the morning O_{3} + NO_{2} (‘total oxidant’) concentrations when compared to AURN observations. We also know that BL depth is important for the mixing of pollutants – it acts as a sort of lid on top of the lower part of the troposphere. Since the noted lag in total oxidant increase in our model occurs exactly at the time of the morning BL development, we can form a testable hypothesis: that an inaccurate representation of BL processes – specifically, morning BL growth – leads to a delay in entrainment of O_{3}-rich air masses from the layer of air above it: the residual layer. It has been suggested in the literature that when the daytime convective mixed layer collapses upon sunset, the remaining pollutants are effectively trapped in the leftover (‘residual’) layer, and thus can act as a night-time reservoir of O_{3} above the stable or neutral night-time boundary layer (NBL).

Figure 3: Total oxidant (O_{3} + NO_{2}) average forecast (AQUM, red) and observations (AURN, black) diurnal cycle, averaged over JJA 2017 at 48 urban background sites. Shading is inter-quartile range.
Figure 4: Rate of change of the mean diurnal profile of the forecast (AQUM, red) and observations (AURN, black) of the total oxidant.

To test the hypothesis, semi-idealised experiments are conducted. We simulate a one-month long release of chemically inert tracers within the Numerical Atmospheric Dispersion Environment (NAME) using different sets of numerical weather prediction (NWP) outputs. This enables a process-based evaluation of how different meteorology affects tracers within the BL. Tracers are released within the lateral boundaries of the domain centred on the UK. The idea is to separate the effects of meteorology from chemistry on the tracer concentrations. In particular, we want to understand the role of entrainment of O_{3}-rich air masses from the residual layer down into the developing BL during the morning hours.

We located around 50 AURN sites in urban locations and compared hourly BL depths from June 2017 in the two sets of NWP output used for the tracer simulations: the UKV and UM Global (UMG) configurations of the Met Office Unified Model. It was found that although the average diurnal profiles of BL depth were quite similar, there was a lag in the morning increase of BL depth within the UMG configuration. This may be because the representation of surface sensible heat flux (SSHF) differs in the two NWP models: the UMG uses a single tile scheme to represent urban areas, whereas the UKV uses a more realistic, two-tile scheme (‘MORUSES’) which distinguishes between roof surfaces and street canyons. SSHF is a measure of energy exchange at the ground, where positive fluxes represent a loss of heat from the surface to the atmosphere. Therefore, a more realistic representation of SSHF results in the UKV being better at capturing and storing urban heat. This leads to a faster development of the BL depth in the UKV compared to the UMG, which in turn could mean that there is more turbulent motion and mixing within the atmosphere.

Assuming that the vertical gradient in pollutant concentrations is positive between the morning BL and the free troposphere, mixing air from above should enhance pollutant concentrations nearer to the surface. Our tracer results show that during days when synoptic conditions are dominated by high pressure, the diurnal cycle in forecast and observed surface pollutant concentrations can be adequately replicated by our simplified set-up. Differences between the diurnal cycle between tracer simulations with the two different meteorological set-ups show that the UKV is not only entraining more tracer from above the boundary layer than the simulation using UMG, but also the concentrations increase on average 1 – 2 hours earlier in the morning. These results suggest that indeed the model meteorology – in particular, representation of BL processes – is important to entrainment of polluted air masses into the BL, which in turn has a significant influence on the surface pollutant concentrations.

Within the past two decades, it has been recognised by the weather and air quality modelling communities that neither type of model can truly exist without the other. This post has discussed just one aspect of how meteorology influences the air quality forecast – there are, of course, many other parameters (e.g. wind speed, precipitation, relative humidity) which affect the forecast pollutant concentrations. We therefore also evaluated night-time errors in the wind speed and found that these errors are positively correlated with the total oxidant forecast errors. This means that when the wind speed forecast is overestimated, it is likely to affect the night-time and morning forecast of both O_{3} and NO_{2} in a significant way.

References

Ambient Air Pollution: A global assessment of exposure and burden of disease. WHO, 2016.

Bohnenstengel S., Evans S., Clark P., Belcher S.: Simulations of the London urban heat island, Quarterly Journal of the Royal Meteorological Society, 2011 vol: 137 (659) pp: 1625-1640

Cocks A., 1993: The Chemistry and Deposition of Nitrogen Species in the Troposphere, The Royal Society of Chemistry, Cambridge 1993

Savage N., Agnew P., Davis L., Ordonez C., Thorpe R., Johnson C., O’Connor F., Dalvi M.: Air quality modelling using the Met Office Unified Model (AQUM OS24-26): model description and initial evaluation, Geoscientific Model Development, 2013 vol: 6 pp: 353-372

Sun J., Mahrt L., Banta R., Pichugina Y.: Turbulence Regimes and Turbulence Intermittency in the Stable Boundary Layer during CASES-99, Journal of the Atmospheric Sciences, 2012 vol: 69 (1) pp: 338-351

Zhang, 2008: Online-coupled meteorology and chemistry models: History, current status, and outlook. Atmos. Chem. Phys, 2008 vol: 8 (11) pp: 2895-2932

On relocating to the Met Office for five weeks of my PhD

Some PhD projects are co-organised by an industrial CASE partner which provides supervisory support and additional funding. As part of my CASE partnership with the UK Met Office, in January I had the opportunity to spend 5 weeks at the Exeter HQ, which proved to be a fruitful experience. As three out of my four supervisors are based there, it was certainly a convenient set-up to seek their expertise on certain aspects of my PhD project!

One part of my project aims to understand how certain neighbourhood-based verification methods can affect the level of surface air quality forecast accuracy. Routine verification of a forecast model against observations is necessary to provide the most accurate forecast possible. Ensuring that this happens is crucial, as a good forecast may help keep the public aware of potential adverse health risks resulting from elevated pollutant concentrations.

The project deals with two sides of one coin: evaluating forecasts of regional surface pollutant concentrations; and evaluating those of meteorological fields such as wind speed, precipitation, relative humidity or temperature. All of the above have unique characteristics: they vary in resolution, spatial scale, homogeneity, randomness… The behaviour of the weather and pollutant variables is also tricky to compare against one another because the locations of their numerous measurement sites nearly never coincide, whereas the forecast encompasses the entirety of the domain space. This is kind of the crux of this part of my PhD: how can we use these irregularly located measurements to our advantage in verifying the skill of the forecast in the most useful way? And – zooming out still – can we determine the extent to which the surface air pollution forecast is dependent on some of those aforementioned weather variables? And can this knowledge (once acquired!) be used to further improve the pollution forecast?

IMG_4407
Side view of the UK Met Office on a cold day in February.

While at the Met Office, I began my research specifically into methods which analyse the forecast skill when a model “neighbourhood” of a particular size around a particular point-observation is evaluated. These methods are being developed as part of a toolkit for evaluation of high resolution forecasts, which can be (and usually are) more accurate than a lower resolution equivalent, but traditional metrics (e.g. root mean square error (RMSE) or mean error (ME)) often fail to demonstrate the improvement (Mittermaier, 2014). They can also fall victim to various verification errors such as the double-penalty problem. This is when an ‘event’ might have been missed at a particular time in the forecast at one gridpoint because it was actually forecast in the neighbouring grid-point one time-step out, so the RMSE counts this error both in the spatial and temporal axes. Not fair, if you ask me. So as NWP continues to increase in resolution, there is a need for robust verification methods which relax the spatial (or temporal) restriction on precise forecast-to-observation matching somewhat (Ebert, 2008).

One way to proceed forward is via a ‘neighbourhood’ approach which treats a deterministic forecast almost as an ensemble by considering all the grid-points around an observation as an individual forecast and formulating a probabilistic score. Neighbourhoods are made of varying number of model grid-points, i.e. a 3×3 or a 5×5 or even bigger. A skill score such as the ranked probability score (RPS) or Brier Score is calculated using the cumulative probability distribution across the neighbourhood of the exceedance of a sensible pollutant concentration threshold. So, for example, we can ask what proportion of a 5×5 neighbourhood around an observation has correctly forecasted an observed exceedance (i.e. ‘hit’)? What if an exceedance forecast has been made, but the observed quantity didn’t reach that magnitude (i.e. ‘false alarm’)? And how do these scores change when larger (or smaller) neighbourhoods are considered? And, if these spatial verification methods prove informative, how could they be implemented in operational air quality forecast verification? All these questions will hopefully have some answers in the near future and form a part of my PhD thesis!

Although these kind of methods have been used for meteorological variables, they haven’t yet been widely researched in the context of regional air quality forecasts. The verification framework for this is called HiRA – High Resolution Assessment, which is part of the wider verification network Model Evaluation Tools (which, considering it is being developed as a means of uniformly assessing high-resolution meteorological forecasts, has the most unhelpful acronym: MET). It is quite an exciting opportunity to be involved in the testing and evaluation of this new set of verification tools for a surface pollution forecast at a regional scale, and I am very grateful to be involved in this. Also, having the opportunity to work at the Met Office and “pretend” to be a real research scientist for a while is awesome!

Email: k.m.milczewska@pgr.reading.ac.uk

Macmillan Coffee Morning / Bake-Off 2017

(Written by Hannah Gough & Kaja Milczewska)

Following on from last year, the Macmillan Coffee Morning 2017 proved to be another storming success in the Met department. Four tables full of cake and other goodies were sold across the morning, raising well over £300 for Macmillan Cancer. We combined this with a ‘Bake Off’, where two tables of bakes were entered into four categories: ‘traditional’, ‘pumpkin’, ‘WCD’ (weather and climate discussion) and the technical challenge: scones. Competition was fierce, with no bake being disliked by our judges: Steve Woolnough, Claire Morris, Rob Thompson and Michael Jonhston.

The goods which did not make it into any category (but definitely into our bellies!) made up two other tables, featuring the likes of rum cake, banana bread, Swiss roll, cookies and cupcakes of various flavours and a very shiny-chocolate topped salted caramel slice.

Those with allergies were well catered for with gluten free chocolate orange iced cupcakes and chocolate fudge cake. Vegan entrants included chocolate muffins and a lemon and chia seed loaf with rain cloud decoration!

Josh Talib won the scone category with butternut squash, thyme and goat’s cheese scones, Rebecca Frew won the traditional cake category with a tasty Bara Brith (speckled bread), a Welsh speciality. The pumpkin category was won by Wendy Neale with some scrumptious pumpkin and ginger cupcakes, whilst the lightning bolt biscuits by Dan Hodson zapping the competition in the WCD category.

A big thanks to all who donated cakes, time and cash to this event. Macmillan Coffee mornings are held frequently all over the country, raising money towards cancer care. We hope this continues in our department in the future! For more information on the work Macmillan do, visit https://www.macmillan.org.uk/


Experiences of the NERC Atmospheric Pollution and Human Health Project.

Email: k.m.milczewska@pgr.reading.ac.uk

One of the most exciting opportunities of my PhD experience to date has been a research trip to Beijing in June, as part of the NERC Atmospheric Pollution and Human Health (APHH) project. This is a worldwide research collaboration with a focus on the way air pollution in developing megacities affects human health, and the meeting in Beijing served as the 3rd project update.

Industrialisation of these cities in the last couple of decades has caused air pollution to rise rapidly and regularly exceed levels deemed safe by the World Health Organisation (WHO).  China sees over 1,000,000 deaths annually due to particulate matter (PM), with 76 deaths per 100,000 capita. In comparison, the UK has just over 16,000 total deaths and 26 per capita. But not only do these two countries have very different climates and emissions; they are also at very different stages of industrial development. So in order to better understand the many various sources of pollution in developing megacities – be they from local transport, coal burning or advected from further afield – there is an increased need for developing robust air quality (AQ) monitoring measures.

The APHH programme exists as a means to try and overcome these challenges. My part in the meeting was to expand the cohort of NCAS / NERC students researching AQ in both the UK and China, attending a series of presentations in a conference-style environment and visiting two sites with AQ monitoring instruments. One is situated in the Beijing city centre while the other in the rural village of Pinggu, just NW of Beijing. Over 100 local villagers take part in a health study by carrying a personal monitor with them over a period of two weeks. Their general health is monitored at the Pinggu site, alongside analysis of the data collected about their personal exposure to pollutants each day, i.e. heatmaps of different pollutant species are created according to GPS tracking. Having all the instruments being explained to us by local researchers was incredibly useful, because since I work with models, I haven’t had a great deal of first hand exposure to pollutant data collection. It was beneficial to get an appreciation of the kind of work this involves!

IMG_8121

In between all our academic activities we also had the chance to take some cultural breaks – Beijing has a lot to offer! For example, our afternoon visit to the Pinggu rural site followed the morning climb up the Chinese Great Wall. Although the landscape was somewhat obscured by the pollution haze, this proved to be a positive thing as we didn’t have to suffer in the direct beam of the sun!


I would like to greatly thank NERC, NCAS and University of Leeds for the funding and organisation of this trip. It has been an incredible experience, and I am looking forward to observing the progess of these projects, hopefully using what I have learnt in some of my own work.

For more information, please visit the APHH student blog in which all the participants documented their experiences: https://www.ncas.ac.uk/en/introduction-to-atmospheric-science-home/18-news/2742-ncas-phd-students-visit-four-year-air-quality-fieldwork-project-in-beijing

Meteorology Ball 2017

Email: K.M.Milczewska@pgr.reading.ac.uk

On Friday 17th February, the annual Meteorology Ball provided a great excuse for members of the department and their guests to dress up for the evening. But for all the excitement of this year’s masquerade theme, the Ball is mainly a charity event. Through the sale of raffle tickets and an auction of promises, the event aims to raise money for the David Grimes Trust, administered by the Reading San Francisco Libre Association (RSFLA), in honour of the well-remembered academic from our department who devoted a great deal of his time to the charity.

RSFLA supports environmental and educational projects in the rural Nicaraguan town of San Francisco Libre, which was ‘twinned’ with Reading in 1994 in order to encourage the exchange of culture and knowledge. Over the past few years, the Meteorology department has supported this link through regular cake sales, running the Reading Half Marathon and, of course, the annual ball.

David Grimes was a respected, integral member of the department and there are many among us who reminisce about his goodwill, interactive lectures and Panto appearances. There are also those among us who, despite never having had the chance to meet David, can easily imagine the positive impact he had both in and outside of our department, through our continued support of the charity under his name. The money  raised is mainly spent on educational support in the San Francisco Libre district: helping to fund a scholarship programme, build a library and toilet facilities among various other projects – and the people who benefit directly have a special message for us all!
https://youtu.be/vWsf9TWwWp4

The generosity of over 80 people attending made the event a great success, raising over £1500 through bidding on bizzarre auction items and lessons, as well as purchasing raffle tickets. To add to this, Santander will be chipping in with an extra £1500 to match, bringing the total raised to over £3000 for the charity! Such success would never have happened, had it not been for all the help we received from Santander, local businesses offering prizes for the raffle, and most importantly: all of those who bought a ticket to come! On behalf of all the organisers, I would like to finish this post with a massive bout of thanks for making the evening worth all the effort and continuing the important tradition of fundraising for the David Grimes Trust.

IMG_1534.JPG