Cape Verde with a Chance of Dust Storms

Natalie Ratcliffe – n.ratcliffe@pgr.reading.ac.uk

My PhD project was could have been done entirely from behind a computer screen, but I ended up in Cape Verde for 3 weeks in June 2022 on a field campaign.

Though the island of Sao Vicente is one of the Cape Verde (= green cape) islands, it wasn’t particularly green…

Working with Dr Franco Marenco from The Cyprus Institute (CyI) and my supervisor at Reading, Dr Claire Ryder, I managed to get some funding to spend 3 weeks in Cape Verde alongside an organised campaign. The ASKOS campaign was created to calibrate and validate aerosol, wind and cloud products from the Aeolus satellite, launched in 2018. They planned on using a combination of ground-based instruments and drones supplied by the Unmanned Systems Research Laboratory (USRL) with CyI to profile dust above Cape Verde to compare with the Aeolus aerosol products.

My PhD project is based around trying to understand how some large dust particles (diameter > 20 um) are travelling much further from the Sahara than expected based on their deposition velocity. One theory about how these particles are transported so far is that they are vertically mixed throughout the depth of the Saharan Air Layer (SAL, dry dusty air layer transported from the Sahara, typically up to ~6 km altitude) during convective mixing in the daytime. At night, with the removal of this convection, these large particles begin to settle through the SAL at a faster rate than other fine particles, before being mixed up again to the top of the SAL during the convective day. This is hypothesised to increase the time taken for the particles to reach the surface, encouraging long-range transport of these coarse particles. We proposed to fly drones with optical particle counters attached up through the SAL during the day and night to see if this theory has any standing.

Before I could go to Cape Verde came all the admin and preamble for going on a field campaign. Before booking flights and accommodation, the wonderfully long health and safety risk assessment form must be completed and approved. Reading through that form really makes it feel like you’re going to face every single threat known to humankind while you’re off campus; hurricanes, volcanoes, Covid-19, getting bitten by ticks (other animals/insects are available), sunburn (to be fair, a very real concern for me) and even getting hacked and bribed. I suppose being prepared for all these eventualities is meant to make it less scary

I had three virtual meetings with everyone involved in the campaign before we travelled, so I had a little bit of an idea what I was supposed to be doing when we were out there. Though to be honest, I still wasn’t entirely sure until a couple of weeks before we left! Claire and I had to introduce our work and what we wanted to achieve from this campaign. I was a little apprehensive as we were going to be requesting to collect data in the very early morning (3-6am ish) meaning we’d have to ask some of the other scientists to be up very early (or late depending on your opinion).

The Wall-e LiDAR. Wall-e was looking at the orientation of the dust particles. eVe was there too but she was basically just an all-white version of Wall-e (disappointing).

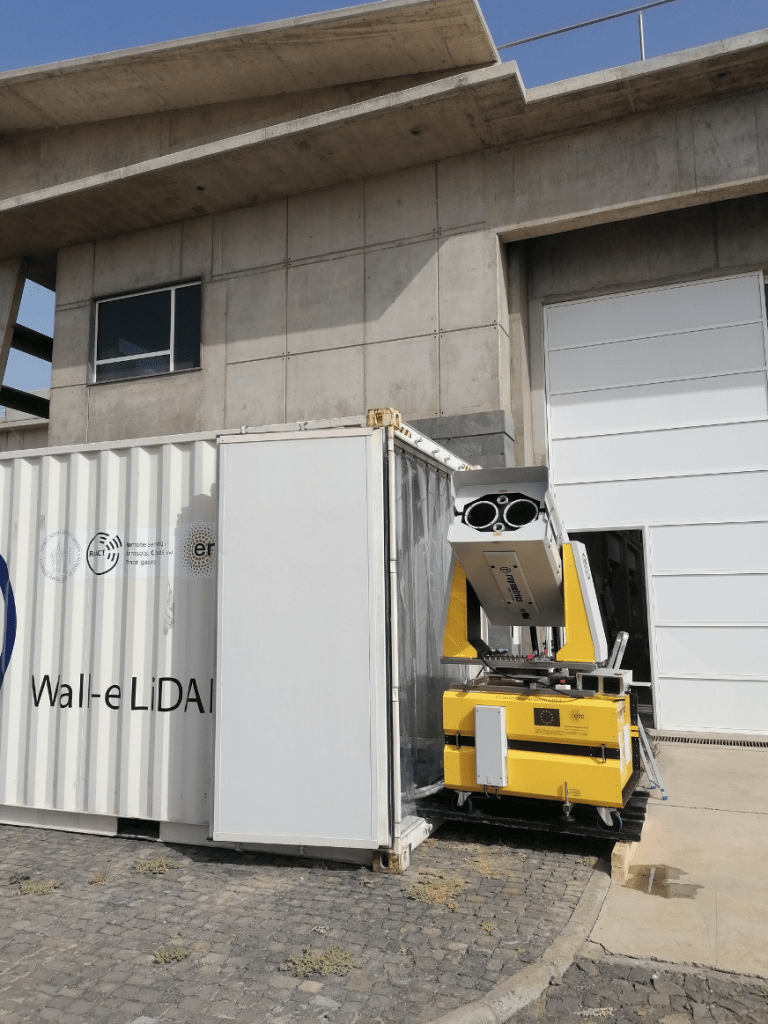
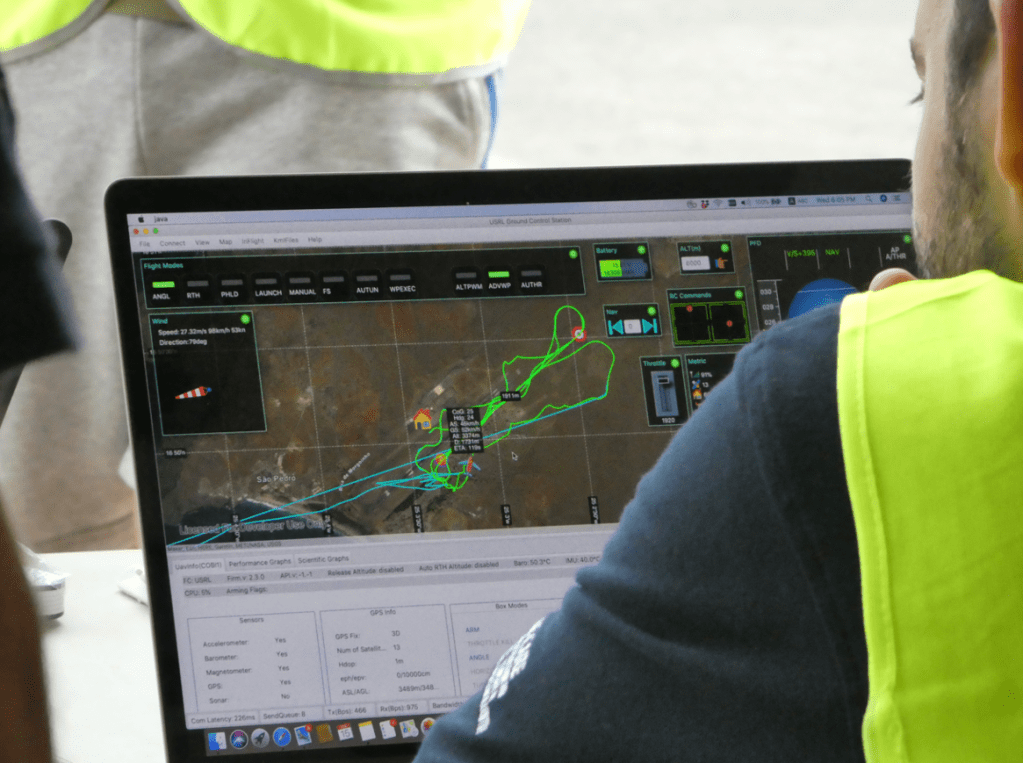
Now we get to the fun part where I actually go on the campaign (or on holiday as some people kept insisting. FYI, this was absolutely not the case). Most days would start with a few of us looking at the forecast to work out when we should aim to fly the drones. We would decide on a plan for the day, a suggested plan for the next day, briefly looking at data from the day before and then collating this all into a newsletter which was sent out to everyone on the campaign. These forecasts were useful for those collecting in-situ observations as well as those working on the ground-based remote sensing equipment. It also became very clear in these meetings that each scientist had a preferred forecasting model. We had so many options for forecasts (SKIRON, Met Office, CAMS, IAASARS, ECMWF etc), as well as varying satellite retrievals (EUMETSAT Dust RGB, MODIS NASA AOD, NOAA GOES-East visible images etc) and near-real-time observations from the ground instruments (PollyXT LIDAR, HALO Doppler wind lidar, CIMEL Sunphotometer etc) that there was occasionally some jostling to work out which forecast and measurements to trust and focus our planning based on! I was then able to go to the airport to help the flight team. I would refer to the most recent reading from the lidar and suggest which layers in the dust should be sampled with filters, as well as checking the wind lidar to make sure it wasn’t getting windier.

The USRL team getting ready for launch. The drones were thrown rather than taking off from the ground. The pilot is in the middle; he has a controller and a headset which he can use to pilot the drone.
The drone path, windspeed, ground speed and altitude can be watched from the ground.

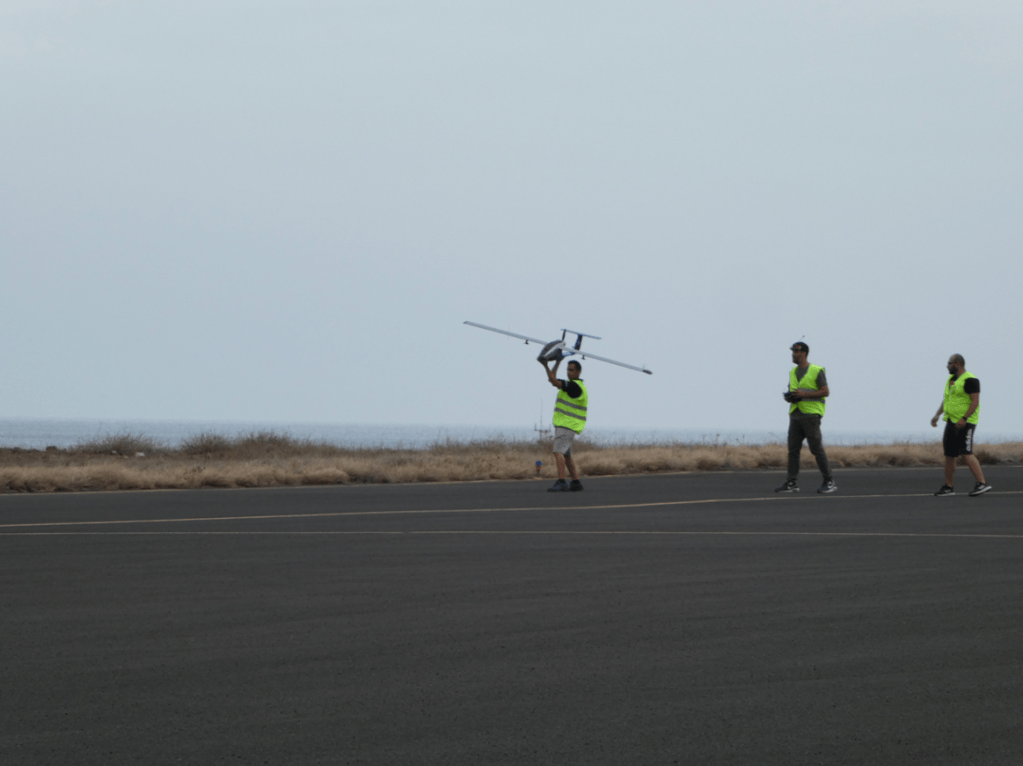
Looking back, we should have focused our forecasting on the wind and cloud more than the dust concentration. Initially, we were planning to measure when there was an interesting or high concentration dust event over the island. However, we eventually realised that the wind and cloud cover were the most limiting factors for measuring in terms of the in-situ and ground-based measurements, respectively. This unfortunately meant that, on a few occasions, the flight team were stuck at the airport waiting for the winds to drop before they could launch the drones. Or that the remote sensing teams couldn’t take results at the same time as the drones because there was too much cloud. It was a learning experience for everyone involved!

I’ve taken away four things from this campaign that it seems will probably happen on any field campaign, so take note if you ever get the opportunity!

  • You’ll get to meet some really cool people
  • Probably get food poisoning
  • Your equipment will break at some point
  • And many things will go wrong… It’s an inevitability

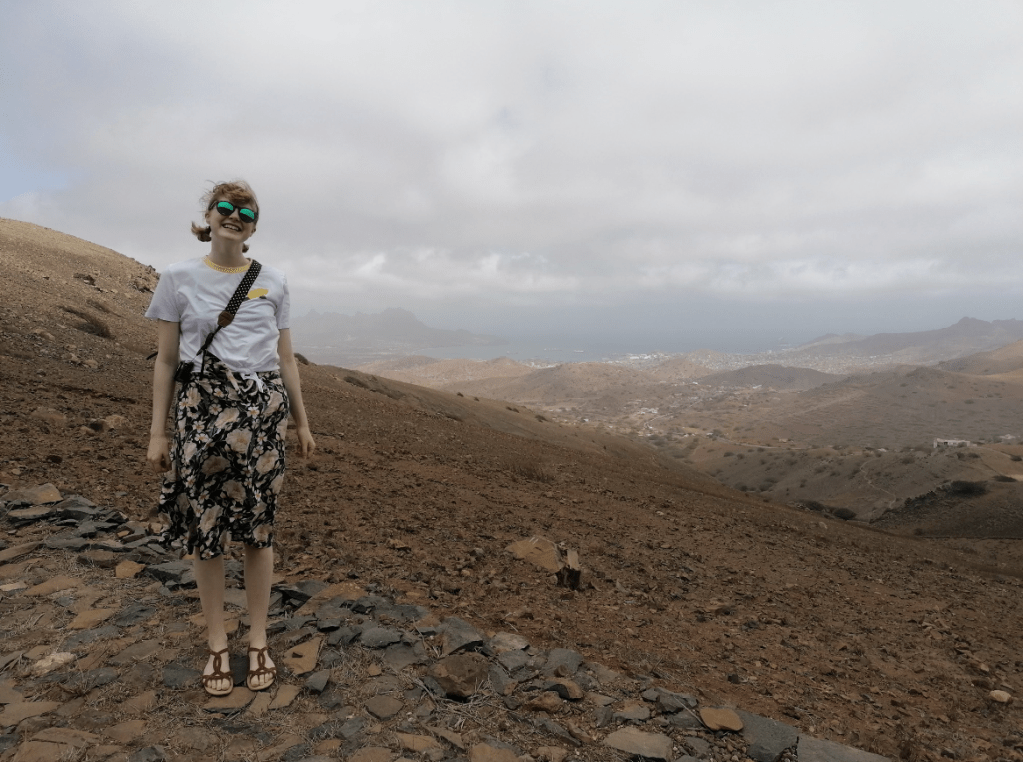
Some of the issues we faced were: instruments taking longer to calibrate and setup than expected, helium arriving two weeks late, missing weather balloons, two got covid, five got food poisoning, one drone crash-landed, too windy to fly the drones, not dusty enough, too cloudy for the lidars… It was definitely an exercise in contingency planning. I did say that this was a fun experience and I do mean it! Though there were many tense moments where things went completely opposite to the plan, I got to meet a lot of cool scientists, learn about new instruments, go to Africa for the first time and get hands on with some dust at last!

Feel free to check out this blog post which I wrote for ESA’s Campaign Earth blog page: (https://blogs.esa.int/campaignearth/2022/08/03/delving-deep-into-dusty-skies-on-the-askos-aeolus-field-campaign/).

This blog article is part of the DAZSAL project that is supported by the European Commission under the Horizon 2020 – Research and Innovation Framework Programme, H2020-INFRAIA-2020-1, Grant Agreement number: 101008004, Transnational Access by ATMO-ACCESS.

Arctic Summer-time Cyclones Field Campaign in Svalbard

Hannah Croad – h.croad@pgr.reading.ac.uk

The rapid decline of sea ice is permitting increased human activity in the summer-time Arctic, where it will be exposed to the risks of Arctic weather. Arctic cyclones are the major weather hazard in the summer-time Arctic, producing strong winds and ocean waves that impact sea ice over large areas. My PhD project is about understanding the dynamics of Arctic summer-time cyclones. One of the biggest uncertainties in our understanding is the interaction of cyclones with the surface and sea ice. Sea ice-atmosphere coupling is greatest in summer when the ice is thinner and more mobile. Strong winds associated with cyclones can move and alter the sea ice, but the sea ice state also feeds back on the development of cyclones, determining surface drag and turbulent fluxes of heat and moisture


My PhD project is closely linked with the Arctic Summer-time Cyclones NERC project, and therefore, I had the opportunity to join the associated field campaign. The field campaign team is comprised of scientists, engineers and pilots from the University of Reading, the University of East Anglia and British Antarctic Survey (BAS). The primary aim of the field campaign was to fly through Arctic cyclones, (i) mapping cyclone structure and (ii) obtaining measurements necessary to characterise the cyclone-sea interaction. In particular, observations of near-surface fluxes of momentum, heat and moisture over sea ice and ocean are needed, as these fluxes dictate the impact of the surface on cyclones. These observations are needed to evaluate and improve the representation of turbulent exchange in numerical weather prediction (NWP) models, especially over sea ice where there are not many existing observations. To obtain accurate measurements of near-surface fluxes, we need to be quite close to the surface (no higher than 300 ft). To do this, we would be using BAS’s Twin Otter aircraft, equipped with Meteorological Airborne Science INstrumentation (MASIN). The twin-engine prop aircraft is small and light, and is therefore ideal for flying at low-levels just above the surface (as low as 50 ft!). There are many instruments fitted on the MASIN research aircraft, but the most important measurements for our purposes were temperature, wind speed, humidity (important for mapping cyclone structure), surface layer turbulent fluxes (from the 50 Hz turbulence probe), and ice surface properties (from laser altimeter).

British Antarctic Survey’s Twin Otter aircraft, fitted with the MASIN equipment. You can see the turbulence probe on the boom at the front of the aircraft, and the CAPS (cloud, aerosol, and precipitation spectrometer) probe on the left wing. The pilot is on top of the aircraft, carrying out final checks before a science flight. Photo from John Methven.

After a 1-year delay due to the Covid-19 pandemic, the field campaign took place in July and August 2022. We were based on the Norwegian archipelago of Svalbard, a 3-hour flight north of Oslo. The team was based in Longyearbyen, the main town on Svalbard. At 78°N, Svalbard is the most northern town in the world! Longyearbyen is located within a valley on the shore of Adventfjorden. The town is a strange but charming place with lots of eccentricities. Longyearbyen is populated with wooden buildings, with pipes above the ground (as the ground freezes in winter), and old mining structures on the sides of the valley. The town is small, but well provided for, with a few tourist shops, restaurants, and a supermarket. As Svalbard is in the Arctic circle, during the summer months it experiences 24-hour sunlight, which was very strange! Furthermore, Longyearbyen is one of the only places on Svalbard that is ‘polar bear safe’ – you should only leave the town limits if you have a rifle!


The field campaign team worked at Longyearbyen airport. The team would study the forecasts from different weather models for the next week, to decide on flight plans. We were primarily looking for strong winds (ideally associated with cyclones, but beggars can’t be choosers!) over the sea ice, within range of the Twin Otter aircraft (approximately 600 nautical miles). With flight planning, there were many things to consider. It was a case of waiting for good weather to come to us, and planning rest days for the pilots when the weather wasn’t looking so interesting in the forecast. Flight plans would consist of transit to and from the target region, where science would be conducted. Science flying included low-level legs to obtain turbulent flux measurements, vertical profiles of the boundary layer, and stacked cross-sections through cyclone features (e.g. fronts) in and above the boundary layer. For flights where low-level flying was planned, it was key that there should not be low cloud in the target area, as this would prevent the aircraft from flying below 1000 ft for safety reasons. It was also important that there were no bad conditions (poor visibility or strong winds) in Longyearbyen, which would prevent the aircraft from taking off or landing. Longyearbyen is an isolated airfield, and the aircraft cannot carry enough fuel to make it back to the mainland if conditions are too poor to land, so this was a very important consideration. Furthermore, the American and French THINICE project field campaign was being conducted at the same time in Svalbard, with the SAFIRE ATR42 aircraft flying at higher levels, looking downwards on Arctic cyclones. We were able to co-ordinate several flights through the same weather systems, with the Twin Otter aircraft flying below the ATR42.


The Twin Otter aircraft holds 3-4 people, including the pilot. With an instrument engineer also on board, this left space for 1 or 2 scientists on each flight (Note: to fly on the aircraft we had to do helicopter underwater escape training – see my previous blog at https://socialmetwork.blog/2021/07/16/helicopter-underwater-escape-training-for-arctic-field-campaign/). The cabin is very small (too small for a person to stand up), and is rather cramped, with a considerable amount of space taken up by the extra range fuel tank! The aircraft is flown between 50 and 10,000 ft, and so the cabin is not pressurized. For low-level flying, the crew must wear immersion suits and life jackets on the aircraft (in the unlikely event that the aircraft must ditch in the ocean). On the flight the crew wear noise-cancelling headphones (as the engines are rather loud), and everyone can speak to each other over the intercom. During the flight the scientists will alter the flight plan if necessary, depending on the conditions they encounter, and take notes of the environment and any notable events that occur during the flight. This includes noting what they can see out of the window (e.g. sea ice fraction, cloud), any interesting observations from the live feed of the instrument output within the aircraft (e.g. boundary layer depth), and any instruments that are not working or faulty.


I had the opportunity to fly on the aircraft on the third science flight of the field campaign (I wrote about this in another blog: https://research.reading.ac.uk/arctic-summertime-cyclones/first-field-campaign-flying-experience/). We were targeting a region to the north-west of Svalbard, in the Fram Strait, where there was forecast to be strong northerly winds over the marginal ice zone. The primary objective was to measure turbulent fluxes over sea ice at low-level. However, on reaching the target region, we were unable to descend lower than 500 ft due to cloud and Arctic sea smoke (formed as cold Arctic air moves over warmer water in between the sea ice floes) at the surface – not safe conditions for flying at low-level! Through gaps in the clouds, we got a glimpse at the Arctic sea smoke over the marginal ice zone (see below). (Note: Several other flights in the field campaign encountered better conditions and were able to get to low levels – see video below!). We searched for better conditions near the target region for an hour, but didn’t find any, so made the return trip home. It was a shame that we could not fly low enough to obtain turbulent flux measurements, but the flight was still useful for obtaining profiles of wind structure in the boundary layer, and for our understanding of forecast performance in the region.

Photos taken from the Twin Otter aircraft 500 ft above the surface, with a layer of Arctic sea smoke overlaying the ice floes of the marginal ice zone. Here visibility is too low to descend any further. Photos from Hannah Croad.
Flying over the marginal ice zone at 70 ft in good visibility conditions, with the shadow of the Twin Otter aircraft visible. Video from John Methven.

During the month-long field campaign a total of 17 science flights were conducted, flying in all directions from Longyearbyen, with an accumulated 80 hours of flying time. This included 4 Arctic cyclone cases, and 7.5 hours of surface layer turbulent flux measurements (more than we could have hoped for!). The data from the aircraft is currently undergoing quality control. Analysis will now proceed in two streams:

  1. Run simulations of Arctic cyclone cases in NWP models, evaluating against field campaign observations and using various tools to relate surface friction and heating to cyclone evolution (led by the University of Reading team)
  2. Use observations of turbulent fluxes in the surface layer over the marginal ice zone and sea ice properties to improve the representation of turbulent exchange over sea ice – i.e. develop parametrizations (led by the University of East Anglia team)

Building on the outputs and findings from these two work packages, we will then run sensitivity experiments of Arctic cyclones in NWP models, using the revised turbulent exchange parametrizations, to understand the impact on cyclone development.

A summary of all the science flights conducted during the Arctic Summer-time Cyclones field campaign. Flight routes are coloured blue-yellow, indicating flight altitude. Also plotted is the campaign mean sea ice fraction (AMSR2).

I really enjoyed my time on the field campaign, and I learnt a lot! It was great to help the team with forecasting and flight planning, and to be on a science flight. I also got to do a bit of media work, talking on BBC Radio 4’s Inside Science programme (https://www.bbc.co.uk/programmes/m0019z2y). It was a fantastic experience, and now the team and I are looking forward to getting started with the analysis and using the data!

Arctic Summer-time Cyclones field campaign team (some missing) in front of the Twin Otter aircraft. Photo from Dan Beeden.

Urban observations in Berlin

Martina Frid – m.a.h.frid@pgr.reading.ac.uk

Beth Saunders – bethany.saunders@pgr.reading.ac.uk

Introduction 

With a large (and growing) proportion of the global population living in cities, research undertaken in urban areas is important; especially in hazardous situations (heatwaves, flooding, etc), which become more severe and frequent due to climate change.  

This post gives an overview of recent work done for The urbisphere; a Synergy Project funded by the European Research Council (urbisphere 2021), aiming to forecast feedbacks between weather, climate and cities.  

Berlin Field Campaign 

The project has included a year-long field campaign (Autumn 2021 – Autumn 2022) undertaken in Berlin (Fig. 1). A smart Urban Observation System was used to take measurements across the city. Sensors used include ceilometers, Doppler wind LIDARs, radiometers, thermal cameras, and large aperture scintillometers (LAS). These measurements were taken to provide new information about the impact of Berlin (and other cities) on the urban boundary layer. The unique observation network was able to provide dense, multi-scale measurements, which will be used to evaluate and inform weather and climate models.  

Figure 1: Locations of the urbisphere senors in Berlin, Germany (urbisphere 2021).

Large Aperture Scintillometry in Berlin

The Berlin field campaign has included 6 LAS paths (Fig. 1). LAS paths consist of a transmitter and receiver mounted in the free atmosphere (Fig. 2), 0.5 – 5 km apart (e.g. Ward et al. 2014).

A beam of near-infrared radiation (wavelength of ~ 850 nm) is passed from the transmitter to receiver, where the beam intensity is measured. Changes in the refractive index of air are used to derive turbulent sensible heat flux. As the received intensity is the result of fluctuations all along the beam, derived quantities are spatially-integrated, and are therefore at a larger-scale compared to other flux measurement techniques (e.g. eddy-covariance).

Figure 2: One of six large aperture scintillometer path (orange) transects. Ground height (blue) is shown between the receiver site (GROP) and transmitter site (OSWE) in Berlin. The Path’s effective beam height is 50 m above ground level.

Our Visit to Berlin

During the first week of August, we travelled to Berlin for three days of fieldwork, to prepare for an intense observation period (IOP). This trip included us installing sensors, and testing they worked as expected. We visited three observation sites: GROP (123 m above sea level, Fig. 2), OSWE (63 m, Fig. 2) and NEUK (60 m).

One of the main purposes of this visit was to align two of the LAS paths (including the one in Fig. 2). Initially, work is undertaken at the transmitter site (Fig. 3, top) to point the instrument in the approximate direction of the receiver using a sight (Fig. 3, right hand side photographs).

At the receiver site (Fig. 3, bottom), the instrument’s measurement of signal strength can be displayed on a monitor in real time. Using this output as a guide, small adjustments to the receiver’s alignment are made by loosening or tightening two bolts on the mount; one which adjusts the receiver’s pitch, and one with adjusts the yaw. This was carried out until we reached a peak reading in signal strength, indicating the path was aligned.

Figure 3: Photographs of the large aperture scintillometer transmitter at site OSWE (top) and receiver at site GROP (bottom).

Our contribution to the IOP

Back in Reading, daily weather forecasts were carried out for the IOP, to determine when ground-based observations could be made. As the field campaign coincided with the central European heat wave, some of the highest temperatures were recorded during the IOP, and there was a need to forecast thunderstorm and the possibility of lightning strikes.

Ideal conditions for observations were clear skies and a consistent wind direction with height. A variety of different wind directions during the IOP was also preferable, to capture different transects of Berlin. For the selected days, group members in Berlin deployed multiple weather balloons simultaneously across multiple sites within the city and the outskirts. This was also timed with satellite overpasses. Observations of the mixing layer height (urban and suburban) were taken using a ceilometer mounted in a van, which drove along different transects of Berlin.

As the field campaign is wrapping up in Berlin, several instruments are now being moved to the new focus city: Paris. We are looking forward to this new period of interesting observations! Thank you and goodbye from us at the top of the GROP observation site!

References

urbisphere, 2021: Project Context and Objectives. http://urbisphere.eu/ (accessed 27/09/22)

Ward, H. C., J. G. Evans, and C. S. B. Grimmond, 2014: Multi-Scale Sensible Heat Fluxes in the Suburban Environment from Large-Aperture Scintillometry and Eddy Covariance. Boundary-Layer Meteorol., 152, 65–89.

Helicopter Underwater Escape Training for Arctic Field Campaign

Hannah Croad h.croad@pgr.reading.ac.uk

The focus of my PhD project is investigating the physical mechanisms behind the growth and evolution of summer-time Arctic cyclones, including the interaction between cyclones and sea ice. The rapid decline of Arctic sea ice extent is allowing human activity (e.g. shipping) to expand into the summer-time Arctic, where it will be exposed to the risks of Arctic weather. Arctic cyclones produce some of the most impactful Arctic weather, associated with strong winds and atmospheric forcings that have large impacts on the sea ice. Hence, there is a demand for improved forecasts, which can be achieved through a better understanding of Arctic cyclone mechanisms. 

My PhD project is closely linked with a NERC project (Arctic Summer-time Cyclones: Dynamics and Sea-ice Interaction), with an associated field campaign. Whereas my PhD project is focused on Arctic cyclone mechanisms, the primary aims of the NERC project are to understand the influence of sea ice conditions on summer-time Arctic cyclone development, and the interaction of cyclones with the summer-time Arctic environment. The field campaign, originally planned for August 2021 based in Svalbard in the Norwegian Arctic, has now been postponed to August 2022 (due to ongoing restrictions on international travel and associated risks for research operations due to the evolving Covid pandemic). The field campaign will use the British Antarctic Survey’s low-flying Twin Otter aircraft, equipped with infrared and lidar instruments, to take measurements of near-surface fluxes of momentum, heat and moisture associated with cyclones over sea ice and the neighbouring ocean. These simultaneous observations of turbulent fluxes in the atmospheric boundary layer and sea ice characteristics, in the vicinity of Arctic cyclones, are needed to improve the representation of turbulent exchange over sea ice in numerical weather prediction models. 

Those wishing to fly onboard the Twin Otter research aircraft are required to do Helicopter Underwater Escape Training (HUET). Most of the participants on the course travel to and from offshore facilities, as the course is compulsory for all passengers on the helicopters to rigs. In the unlikely event that a helicopter must ditch on the ocean, although the aircraft has buoyancy aids, capsize is likely because the engine and rotors make the aircraft top heavy. I was apprehensive about doing the training, as having to escape from a submerged aircraft is not exactly my idea of fun. However, I realise that being able to fly on the research aircraft in the Arctic is a unique opportunity, so I was willing to take on the challenge! 

The HUET course is provided by the Petans training facility in Norwich. John Methven, Ben Harvey, and I drove to Norwich the night before, in preparation for an early start the next day. We spent the morning in the classroom, covering helicopter escape procedures and what we should expect for the practical session in the afternoon. We would have to escape from a simulator recreating a crash landing on water. The simulator replicates a helicopter fuselage, with seats and windows, attached to the end of a mechanical arm for controlled submersion and rotation. The procedure is (i) prepare for emergency landing: check seatbelt is pulled tight, headgear is on, and that all loose objects are tucked away, (ii) assume the brace position on impact, and (iii) keep one hand on the window exit and the other on your seatbelt buckle. Once submerged, undo your seatbelt and escape through the window. After a nervy lunch, it was time to put this into practice. 

The aircraft simulator being submerged in the pool (Source: Petans promotional video

The practical part of the course took place in a pool (the temperature resembled lukewarm bath water, much warmer than the North Atlantic!). We were kitted up with two sets of overalls over our swimming costumes, shoes, helmets, and jackets containing a buoyancy aid. We then began the training in the aircraft simulator. Climb into the aircraft and strap yourself into a seat. The seatbelt had to be pulled tight, and was released by rotating the central buckle. On the pilots command, prepare for emergency landing. Assume the brace position, and the aircraft drops into the water. Hold on to the window and your seatbelt buckle, and as the water reaches your chest, take a deep breath. Wait for the cabin to completely fill with water and stop moving – only then undo your seatbelt and get out! 

The practical session consisted of three parts. In the first exercise, the aircraft was submerged, and you had to escape through the window. The second exercise was similar, except that panes were fitted on the windows, which you had to push out before escaping. In the final exercise, the aircraft was submerged and rotated 180 degrees, so you ended up upside down (and with plenty of water up your nose), which was very disorientating! Each exercise required you to hold your breath for roughly 10 seconds at a time. Once we had escaped and reached the surface, we deployed our buoyancy aids, and climbed to safety onto the life raft. 

Going for a spin! The aircraft simulator being rotated with me strapped in
Ben and I happy to have survived the training!

The experience was nerve-wracking, and really forced me to push myself out of my comfort zone. I didn’t need to be too worried though, even after struggling with undoing the seatbelt a couple of times, I was assisted by the diving team and encouraged to go again. I was glad to get through the exercises, and pass the course along with the others. This was an amazing experience (definitely not something I expected to do when applying for a PhD!), and I’m now looking forward to the field campaign next year. 

Trouble in paradise: Climate change, extreme weather and wildlife conservation on a tropical island.

Joseph Taylor, NERC SCEARNIO DTP student. Zoological Society of London.

Email: J.Taylor5@pgr.reading.ac.uk

Projecting the impacts of climate change on biodiversity is important for informing

Mauritius Kestrel by Joe Taylor
Male Mauritius kestrel (Falco punctatus) in the Bambous Mountains, eastern Mauritius. Photo by Joe Taylor.

mitigation and adaptation strategies. There are many studies that project climate change impacts on biodiversity; however, changes in the occurrence of extreme weather events are often omitted, usually because of insufficient understanding of their ecological impacts. Yet, changes in the frequency and intensity of extreme weather events may pose a greater threat to ecosystems than changes in average weather regimes (Jentsch and Beierkuhnlein 2008). Island species are expected to be particularly vulnerable to climate change pressures, owing to their inherently limited distribution, population size and genetic diversity, and because of existing impacts from human activities, including habitat destruction and the introduction of non-native species (e.g. Fordham and Brook 2010).

Mauritius is an icon both of species extinction and the successful recovery of threatened species. However, the achievements made through dedicated conservation work and the investment of substantial resources may be jeopardised by future climate change. Conservation programmes in Mauritius have involved the collection of extensive data on individual animals, creating detailed longitudinal datasets. These provide the opportunity to conduct in-depth analyses into the factors that drive population trends.

My study focuses on the demographic impacts of weather conditions, including extreme events, on three globally threatened bird species that are endemic to Mauritius. I extended previous research into weather impacts on the Mauritius kestrel (Falco punctatus), and applied similar methods to the echo parakeet (Psittacula eques) and Mauritius fody (Foudia rubra). The kestrel and parakeet were both nearly lost entirely in the 1970s and 1980s respectively, having suffered severe population bottlenecks, but all three species have benefitted from successful recovery programmes. I analysed breeding success using generalised linear mixed models and analysed survival probability using capture-mark-recapture models. Established weather indices were adapted for use in this study, including indices to quantify extreme rainfall, droughts and tropical cyclone activity. Trends in weather indices at key conservation sites were also analysed.

The results for the Mauritius kestrel add to a body of evidence showing that precipitation is an important limiting factor in its demography and population dynamics. The focal population in the Bambous Mountains of eastern Mauritius occupies an area in which rainfall is increasing. This trend could have implications for the population, as my analyses provide evidence that heavy rainfall during the brood phase of nests reduces breeding success, and that prolonged spells of rain in the cyclone season negatively impact the survival of juveniles. This probably occurs through reductions in hunting efficiency, time available for hunting and prey availability, so that kestrels are unable to capture enough prey to sustain themselves and feed their young (Nicoll et al. 2003, Senapathi et al. 2011). Exposure to heavy and prolonged rainfall could also be a direct cause of mortality through hypothermia, especially for chicks if nests are flooded (Senapathi et al. 2011). Future management of this species may need to incorporate strategies to mitigate the impacts of increasing rainfall.

References:

Fordham, D. A. and Brook, B. W. (2010) Why tropical island endemics are acutely susceptible to global change. Biodiversity and Conservation 19(2): 329‒342.

Jentsch, A. and Beierkuhnlein, C. (2008) Research frontiers in climate change: Effects of extreme meteorological events on ecosystems. Comptes Rendus Geoscience 340: 621‒628.

Nicoll, M. A. C., Jones, C. G. and Norris, K. (2003) Declining survival rates in a reintroduced population of the Mauritius kestrel: evidence for non-linear density dependence and environmental stochasticity. Journal of Animal Ecology 72: 917‒926.

Senapathi, D., Nicoll, M. A. C., Teplitsky, C., Jones, C. G. and Norris, K. (2011) Climate change and the risks associated with delayed breeding in a tropical wild bird population. Proceedings of the Royal Society B 278: 3184‒3190.

Experiences of the NERC Atmospheric Pollution and Human Health Project.

Email: k.m.milczewska@pgr.reading.ac.uk

One of the most exciting opportunities of my PhD experience to date has been a research trip to Beijing in June, as part of the NERC Atmospheric Pollution and Human Health (APHH) project. This is a worldwide research collaboration with a focus on the way air pollution in developing megacities affects human health, and the meeting in Beijing served as the 3rd project update.

Industrialisation of these cities in the last couple of decades has caused air pollution to rise rapidly and regularly exceed levels deemed safe by the World Health Organisation (WHO).  China sees over 1,000,000 deaths annually due to particulate matter (PM), with 76 deaths per 100,000 capita. In comparison, the UK has just over 16,000 total deaths and 26 per capita. But not only do these two countries have very different climates and emissions; they are also at very different stages of industrial development. So in order to better understand the many various sources of pollution in developing megacities – be they from local transport, coal burning or advected from further afield – there is an increased need for developing robust air quality (AQ) monitoring measures.

The APHH programme exists as a means to try and overcome these challenges. My part in the meeting was to expand the cohort of NCAS / NERC students researching AQ in both the UK and China, attending a series of presentations in a conference-style environment and visiting two sites with AQ monitoring instruments. One is situated in the Beijing city centre while the other in the rural village of Pinggu, just NW of Beijing. Over 100 local villagers take part in a health study by carrying a personal monitor with them over a period of two weeks. Their general health is monitored at the Pinggu site, alongside analysis of the data collected about their personal exposure to pollutants each day, i.e. heatmaps of different pollutant species are created according to GPS tracking. Having all the instruments being explained to us by local researchers was incredibly useful, because since I work with models, I haven’t had a great deal of first hand exposure to pollutant data collection. It was beneficial to get an appreciation of the kind of work this involves!

IMG_8121

In between all our academic activities we also had the chance to take some cultural breaks – Beijing has a lot to offer! For example, our afternoon visit to the Pinggu rural site followed the morning climb up the Chinese Great Wall. Although the landscape was somewhat obscured by the pollution haze, this proved to be a positive thing as we didn’t have to suffer in the direct beam of the sun!


I would like to greatly thank NERC, NCAS and University of Leeds for the funding and organisation of this trip. It has been an incredible experience, and I am looking forward to observing the progess of these projects, hopefully using what I have learnt in some of my own work.

For more information, please visit the APHH student blog in which all the participants documented their experiences: https://www.ncas.ac.uk/en/introduction-to-atmospheric-science-home/18-news/2742-ncas-phd-students-visit-four-year-air-quality-fieldwork-project-in-beijing

4th ICOS Summer School

Email: R.Braghiere@pgr.reading.ac.uk

The 4th ICOS Summer School on challenges in greenhouse gases measurements and modelling was held at Hyytiälä field station in Finland from 24th May to 2nd June, 2017. It was an amazing week of ecosystem fluxes and measurements, atmospheric composition with in situ and remote sensing measurements, global climate modelling and carbon cycle, atmospheric transport and chemistry, and data management and cloud (‘big data’) methods. We also spent some time in the extremely hot Finnish sauna followed by jumps into a very cold lake, and many highly enjoyable evenings by the fire with sunsets that seemed to never come.

sunset_Martijn Pallandt
Figure 1. Sunset in Hyytiälä, Finland at 22:49 local time. Credits: Martijn Pallandt

Our journey started in Helsinki, where a group of about 35 PhD students, with a number of postdocs and master students took a 3 hours coach trip to Hyytiälä.  The group was very diverse and international with people from different backgrounds; from plant physiologists to meteorologists. The school started with Prof. Dr. Martin Heimann  introducing us to the climate system and the global carbon cycle, and Dr. Alex Vermeulen highlighted the importance of good metadata practices and showed us more about ICOS research infrastructure. Dr. Christoph Gerbig joined us via Skype from Germany and talked about how atmospheric measurements methods with aircrafts (including how private air companies) can help scientists.

Hyytiala_main_tower_truls_Andersen_2
Figure 2. Hyytiälä flux tower site, Finland. Credits: Truls Andersen

On Saturday we visited the Hyytiälä flux tower site, as well as a peatland field station nearby, where we learned more about all the flux data they collect and the importance of peatlands globally. Peatlands store significant amounts of carbon that have been accumulating for millennia and they might have a strong response to climate change in the future. On Sunday, we were divided in two groups to collect data on temperature gradients from the lake to the Hyytiälä main flux tower, as well as on carbon fluxes with dark (respiration only) and transparent (photosynthesis + respiration) CO2 chambers.

chamber_measurements_renato
Figure 3: Dark chamber for CO2 measurements being used by a group of students in the Boreal forest. Credits: Renato Braghiere

On the following day it was time to play with some atmospheric modelling with Dr. Maarten Krol and Dr. Wouter Peters. We prepared presentations with our observation and modelling results and shared our findings and experiences with the new data sets.

The last two days have focused on learning how to measure ecosystem fluxes with Prof. Dr. Timo Vesala, and insights on COS measurements and applications with Dr. Kadmiel Maseyk. Timo also shared with us his passion for cinema with a brilliant talk entitled “From Vertigo to Blue Velvet: Connotations between Movies and Climate change” and we watched a really nice Finnish movie “The Happiest Day in the Life of Olli Mäki“.

4th_icos_summer_school_group_photo
Figure 4: 4th ICOS Summer School on Challenges in greenhouse gases measurements and modelling group photo. Credits: Wouter Peters

Lastly, it was a fantastic week where we were introduced to several topics and methods related to the global carbon budget and how it might impact the future climate. No doubt all information gained in this Summer School will be highly valuable for our careers and how we do science. A massive ‘cheers’ to Olli Peltola, Alex Vermeulen, Martin Heimann, Christoph Gerbig, Greet Maenhout, Wouter Peters, Maarten Krol, Anders Lindroth , Kadmiel Maseyk, Timo Vesala, and all the staff at the Hyytiälä field station.

This post only scratches the surface of all of the incredible material we were able to cover in the 4th ICOS Summer School, not to mention the amazing group of scientists that we met in Finland, who I really look forward to keeping in touch over the course of the years!


Tales from the Alice Holt forest: carbon fluxes, data assimilation and fieldwork

Email: ewan.pinnington@gmail.com

Forests play an important role in the global carbon cycle, removing large amounts of CO2 from the atmosphere and thus helping to mitigate the effect of human-induced climate change. The state of the global carbon cycle in the IPCC AR5 suggests that the land surface is the most uncertain component of the global carbon cycle. The response of ecosystem carbon uptake to land use change and disturbance (e.g. fire, felling, insect outbreak) is a large component of this uncertainty. Additionally, there is much disagreement on whether forests and terrestrial ecosystems will continue to remove the same proportion of CO2 from the atmosphere under future climate regimes. It is therefore important to improve our understanding of ecosystem carbon cycle processes in the context of a changing climate.

Here we focus on the effect on ecosystem carbon dynamics of disturbance from selective felling (thinning) at the Alice Holt research forest in Hampshire, UK. Thinning is a management practice used to improve ecosystem services or the quality of a final tree crop and is globally widespread. At Alice Holt a program of thinning was carried out in 2014 where one side of the forest was thinned and the other side left unmanaged. During thinning approximately 46% of trees were removed from the area of interest.

flux_me
Figure 1: At the top of Alice Holt flux tower.

Using the technique of eddy-covariance at flux tower sites we can produce direct measurements of the carbon fluxes in a forest ecosystem. The flux tower at Alice Holt has been producing measurements since 1999 (Wilkinson et al., 2012), a view from the flux tower is shown in Figure 1. These measurements represent the Net Ecosystem Exchange of CO2 (NEE). The NEE is composed of both photosynthesis and respiration fluxes. The total amount of carbon removed from the atmosphere through photosynthesis is termed the Gross Primary Productivity (GPP). The Total Ecosystem Respiration (TER) is made up of autotrophic respiration (Ra) from plants and heterotrophic respiration (Rh) from soil microbes and other organisms incapable of photosynthesis. We then have, NEE = -GPP + TER, so that a negative NEE value represents removal of carbon from the atmosphere and a positive NEE value represents an input of carbon to the atmosphere. A schematic of these fluxes is shown in Figure 2.

forest_fluxes
Figure 2: Fluxes of carbon around a forest ecosystem.

The flux tower at Alice Holt is on the boundary between the thinned and unthinned forest. This allows us to partition the NEE observations between the two areas of forest using a flux footprint model (Wilkinson et al., 2016). We also conducted an extensive fieldwork campaign in 2015 to estimate the difference in structure between the thinned and unthinned forest. However, these observations are not enough alone to understand the effect of disturbance. We therefore also use mathematical models describing the carbon balance of our ecosystem, here we use the DALEC2 model of ecosystem carbon balance (Bloom and Williams, 2015). In order to find the best estimate for our system we use the mathematical technique of data assimilation in order to combine all our available observations with our prior model predictions. More infomation on the novel data assimilation techniques developed can be found in Pinnington et al., 2016. These techniques allow us to find two distinct parameter sets for the DALEC2 model corresponding to the thinned and unthinned forest. We can then inspect the model output for both areas of forest and attempt to further understand the effect of selective felling on ecosystem carbon dynamics.

fluxes
Figure 3: Model predicted cumulative fluxes for 2015 after data assimilatiom. Solid line: NEE, dotted line: TER, dashed line: GPP. Orange: model prediction for thinned forest, blue: model prediction for unthinned forest. Shaded region: model uncertainty after assimilation (± 1 standard deviation).

In Figure 3 we show the cumulative fluxes for both the thinned and unthinned forest after disturbance in 2015. We would probably assume that removing 46% of the trees from the thinned section would reduce the amount of carbon uptake in comparison to the unthinned section. However, we can see that both forests removed a total of approximately 425 g C m-2 in 2015, despite the thinned forest having 46% of its trees removed in the previous year. From our best modelled predictions this unchanged carbon uptake is possible due to significant reductions in TER. So, even though the thinned forest has lower GPP, its net carbon uptake is similar to the unthinned forest. Our model suggests that GPP is a main driver for TER, therefore removing a large amount of trees has significantly reduced ecosystem respiration. This result is supported by other ecological studies (Heinemeyer et al., 2012, Högberg et al., 2001, Janssens et al., 2001). This has implications for future predictions of land surface carbon uptake and whether forests will continue to sequester atmospheric CO2 at similar rates, or if they will be limited by increased GPP leading to increased respiration.

References

Wilkinson, M. et al., 2012: Inter-annual variation of carbon uptake by a plantation oak woodland in south-eastern England. Biogeosciences, 9 (12), 5373–5389.

Wilkinson, M., et al., 2016: Effects of management thinning on CO2 exchange by a plantation oak woodland in south-eastern England. Biogeosciences, 13 (8), 2367–2378, doi: 10.5194/bg-13-2367-2016.

Bloom, A. A. and M. Williams, 2015: Constraining ecosystem carbon dynamics in a data-limited world: integrating ecological “common sense” in a model data fusion framework. Biogeosciences, 12 (5), 1299–1315, doi: 10.5194/bg-12-1299-2015.

Pinnington, E. M., et al., 2016: Investigating the role of prior and observation error correlations in improving a model forecast of forest carbon balance using four-dimensional variational data assimilation. Agricultural and Forest Meteorology, 228229, 299 – 314, doi: http://dx.doi.org/10.1016/j.agrformet.2016.07.006.

Heinemeyer, A., et al., 2012: Exploring the “overflow tap” theory: linking forest soil co2 fluxes and individual mycorrhizo- sphere components to photosynthesis. Biogeosciences, 9 (1), 79–95.

Högberg, P., et al., 2001: Large-scale forest girdling shows that current photosynthesis drives soil respiration. Nature, 411 (6839), 789–792.

Janssens, I. A., et al., 2001: Productivity overshadows temperature in determining soil and ecosystem respiration across european forests. Global Change Biology, 7 (3), 269–278, doi: 10.1046/j.1365-2486.2001.00412.x.

Continue reading