Online comic “xkcd” set a trend for explaining complicated things using only the 1000 most common words when they created this schematic of Saturn-V. They have subsequently published more on how microwaves, plate tectonics and your computer work, using the same style.
So we thought we’d jump on the bandwagon in a recent PhD group meeting, and have a go at explaining our research topics using the ten-hundred most common words. You can have a go yourselves, and tweet us with it @SocialMetwork on Twitter. Enjoy!
The Role of the Asian Summer Monsoon in European Summer Climate Variability – Jonathan Beverley
I look at how heavy rain in in-dear in summer makes rain, sun, wind and other things happen in your-up. This happens by big waves high up in the sky moving around the world. We might be able to use this to make a long know-before better and to help people live longer and not lose money.
Contribution of near-infrared bands of greenhouse gases to radiative forcing – Rachael Byrom
I study how the sun’s light warms the sky. This happens when these really tiny things in the air that we can’t see eat the sun’s light which then makes the sky warmer. I use computers to look into how this happens, especially how exactly the really tiny things eat the sun’s light and how this leads to warming. By this I mean, if I add lots of the tiny things to a pretend computer sky, all over the world, then will the sky also warm over all of the world too and by how much will it warm? This might be interesting for people who lead the world so that they can see how much of the really tiny things we should be allowed to put into the sky.
Wind profile effects on gravity wave drag and their impact on the global atmospheric circulation – Holly Turner
I look at waves in the air over high places and how they slow down the wind. When the wind gets faster the higher up you go, it changes how it slows down. I want to use this to make computer wind pictures better.
To be a doctor, I look at a fire-breathing ground thing with smoke and rocks on a hot place surrounded by water. I look at space pictures to understand the relationships between the air that smells and fire-rock bits in the air, and other stuff. It’s a very angry fire-breathing ground thing and might kill the near-by humans
Surface fluxes, temperatures and boundary layer evolutions in the building grey zone in London – Beth Saunders
I work on numbers which come out of the Met Office’s computer world. These numbers are different to what is seen and felt in real life for cities. True numbers, seen in real life, help to say how hot cities are, and how different the hot city is to areas that aren’t cities, with trees and fields, because of the city’s people, cars and houses. Numbers saying how fast the wind goes, and the wind’s direction, change in cities because of all the areas with tall houses. Finding times where the computer world numbers are bad for cities will help to make the Met Office’s computer give numbers more like the true numbers.
Cloud electrification and lightning in the evolution of convective storms – Ben Courtier
To be a doctor, I look at sudden light shocks from angry water air that happens with noise in the sky and how the angry water air changes before the light shock happens. I do this in order to better guess when the sudden light shock happens.
Politics. Science. They are two worlds apart. One is about trying to understand and reveal the true nature of the universe using empirical evidence. The other is more invested in constructing its own reality; cherry-picking evidence which conforms to the desired perception of the universe. Ok, so this is a gross simplification. Politicians have by no means an easy task. They are expected to make huge decisions on limited evidence and understanding. Meanwhile, whilst we all like the romantic idea that the science we do is empirical and non-biased, there are frequent examples (such as the perils of the impact factor or sexism in peer review) to counter this. We do understand, however, that evidence lies at the core of what we do. A good research paper will highlight what evidence has led to a conclusion or outcome, how that evidence was collected, and any uncertainties or limitations of the evidence. This is essential for transparency and reproducibility. What if we could introduce the same tools to politics?
For effective public scrutiny of policies, transparency in how evidence is used is essential. Credit for photo: Jamie Smith, Unsplash
In October 2017 I spent multiple hours reviewing government policy documents to assess just how well they were using evidence. I was contributing to the Sense about Science publication transparency of evidence: spot check. This document is the product of a collaboration in 2015 between Sense about Science, the Institute for Government and the Alliance for Useful Evidence wherein the evidence transparency framework was proposed. This framework aims to encourage government to be transparent in their use of evidence. In November 2016, Sense about Science published the original transparency of evidence report which was a trial use of this framework applied to a random selection of ‘publicly-available policy documents’. After feedback from the departments and participants involved, the framework has been refined to produce the spot check.
The review involved a team of young scientists, including me, each assessing how a subset of around 10 of these policies is using evidence. At this stage the quality of this evidence, or whether the policy has merit based on the presented evidence, was not considered. The priority is to assess the transparency in how evidence is being used to shape policy. We scored each policy in four key areas (with a score out of 3 given for each area):
Diagnosis: The policymakers should outline all they know about a particular issue including its causes, impacts and scale with supporting evidence. Any uncertainties or weaknesses in the evidence base should be highlighted.
Proposal: The policy should outline the chosen intervention with a clear statement of why this approach has been selected as well as any negatives. It should also be made clear why other approaches have not been used, and if the chosen intervention has not been fully decided on how the Government intends to make that decision. Once again the strengths and weaknesses of the evidence base should be acknowledged and discussed.
Implementation: If the method for implementing the proposal has not been made, what evidence will be used to make that decision? If it has, why has this approach been selected over alternatives, and what negatives exist? As previously, supporting evidence should be provided and assessed for its quality.
Testing and Evaluation: Will there be a pilot / trial of the policy and if not why not? How will the impacts and outcomes of the policy be assessed? The testing methods and criteria for success should be made clear, with an accompanying timetable.
For full details of this framework refer to Appendix 1 of the transparency of evidence: spot check publication. Whilst the framework is fairly explicit, it was nevertheless challenging as a reviewer to provide a fair assessment of each policy. The policies ranged in content from cyber-security to packaging waste; some were a few pages long, some closer to 100 pages; some were still at the consultation stage and others were ready to implement. Furthermore, sometimes values and pragmatism are as important in policy making as the available evidence. Policies based on such values can still be scored highly provided it is explicit and justified why these values have taken priority over any available contradictory evidence.
The findings discussed within the report are consistent with what I found when reviewing the policies. In particular, whilst inclusion of supporting evidence has improved since the original assessment, an approach of “info-dumping” seems to have been adopted whereby evidence is provided without being explicit about why it is relevant or it has been used. Similarly often references are cited without it being clear why. Many policies also failed to make the chain of reasoning from diagnosis to testing and evaluation of a policy clear. These complaints should not be unfamiliar to scientists! Finally, very few documents discussed how policies would be tested and evaluated. I am hoping by this point it should be clear why we as scientists can have a positive input. The same skills we use to produce high quality research and papers can be used to produce transparent and testable policies.
We have established why a scheme to engage young researchers in assessing and improving use of evidence in policy making has value, however perhaps you may still be wondering why we should care? Linking back to the theme of this blog, in the next few years we are going to see a raft of policies worldwide designed to combat climate change in response to the Paris Agreement. As the people providing the evidence, climate scientists will have a role in scrutinising these policies and ensuring they will achieve the predicted outcomes. For this to happen, transparency of evidence is essential. Furthermore, we all exist as citizens outside of our research, and as citizens we should want the ability to properly hold government and other policy makers accountable.
This year the Department of Meteorology are participating and organising several events to raise money for the David Grimes Trust, a part of Reading San Francisco Libre Association. The David Grimes Trust was set-up after the passing away of Dr. David Grimes, a Reader in African Meteorology and an integral part of our department. His works include leading the TAMSAT group from the mid-1990s and supporting a new generation of African scientists. More details about David Grimes and the Reading San Francisco Libre can be found at http://www.met.reading.ac.uk/david/ and http://www.sanfranciscolibre.org/.
Events taking place include a departmental bake sale and a Meteorology Gatsby Ball. 20 members of the department are also running the Reading Half Marathon, and you can support them by donating at https://mydonate.bt.com/fundraisers/metdeptreadinghalf2018 .
This week’s blog post comes from Nick Byrne, a recent PhD graduate from the department, who’s written a two-day diary for us on his experiences in Nicaragua visiting San Francisco Libre.
Day 1
05:30 – Days in Nicaragua begin early! In San Francisco Libre (and in ‘el campo’ in general) everyone is up from as early as 04.00. Animals are tended to and tortillas are prepared from scratch, perhaps also along with a dish of ‘gallo pinto’ and some coffee.
School in San Francisco Libre
In the big towns life begins a little later. I’m staying in Esteli, a city in the northern highlands which is over 100km from SFL. My ‘expreso’ bus to Managua leaves at 06.45 and I only have time for a banana before I have to dash out the door.
08:00 – The bus drops me at the side of the highway near San Benito where I need to catch a regular bus to SFL. I get some travel advice from a friendly owner of a nearby ‘pulperia’, who tells me that the bus should arrive in about an hour. Regular buses in Nicaragua (or ‘chicken buses’ to tourists) are often retired American schoolbuses that have been redecorated in colourful ways. Anything and everything can be sold on them, and a couple of fresh Nicaraguan ‘picos’ can be very welcome if you missed breakfast.
11:00 – The bus arrives in SFL! I get off outside the house of a German NGO where 4 young volunteers are spending the year. I meet two of them, Flo and Clara, before being introduced to local resident and president of APREDEN (Association for the Recovery and Development of the Environment in Nicaragua), Jimmy Zamora. I give Jimmy a small gift of art supplies from Reading which he tells me will be very popular with the children of SFL. We chat briefly with the volunteers at the house and then hop on Jimmy’s bike for a ride to the local ‘comedor’ where we get some food and a delicious melon ‘fresco’.
12:00 – Over lunch we talk about some recent projects in SFL such as the plant nursery and beekeeping programs in ‘La Guayabita’, and the education programs in the library and the school. Between working on the various projects and coordinating activities with the German NGO, Jimmy is effectively on duty 24/7. Like many Nicaraguans, participating in his church community and singing in the choir at weekends is his release from the challenges that work brings. We also talk a little about his visit to England and his love of The Beatles, and we even manage a brief discussion on how residents perceive climate change in SFL.
13:00 – After lunch we spend the afternoon visiting various projects and activities in SFL. These include the harbour and canal network to the capital Managua, the semi-developed volcanic bath and spa facility for tourists, and also to the many communities surrounding the lake that were devastated by flooding after hurricane Mitch and from heavy rains in recent years. A recurrent theme is that even in difficult conditions, SFL is not lacking in creative solutions to the various problems that arise. The primary challenge is finding funding to get a project started. I’m told that the average daily wage for an agricultural worker in Nicaragua is around $5 a day, and so even a few dollars can have a huge impact on the daily quality of life.
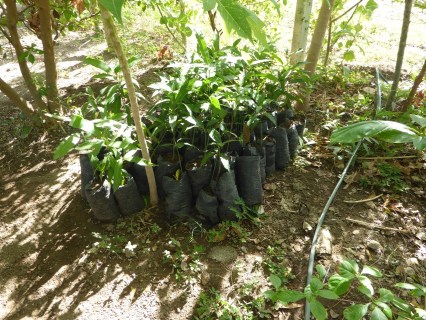
Perhaps the project which Jimmy and colleagues are most proud of is the work at ‘La Guayabita’. This is a nursery for plants and trees as well as housing the location of the beekeeping project in SFL. There is a close connection between both of these projects as the bees help pollinate the nursery, while a diverse ecological system is crucial for a successful beekeeping program. When the beekeeping program initially started, all that the community had was the technical expertise of a few residents. Over time, and with the help of various fundraising efforts (including from the David Grimes Trust in Reading), the necessary materials were purchased and now the program is actually generating money for the community.
Plants at La Guayabita
The nursery itself has a striking visual impact as deforestation has been a problem in SFL over recent decades. Plants from the nursery are being used to redevelop recently bought land and this major project is currently in the early stages of development. Jimmy’s colleagues describe it best by calling ‘La Guayabita’ the lungs of SFL.
17:00 – Saturday evening is a chance to unwind a little. A karaoke competition has been organised in the central park and many children and families are present to enjoy the atmosphere. Jimmy is hosting the event and there is a wide range of genres. Songs range from recent hits such as ‘Chambea’ and ‘Casate Conmigo’ to crowdpleasers like ‘Me Gusta Tu Vieja’ (which I’m told is a Mexican joke about ‘your mum’!). Jimmy closes the event with a ranchera called ‘La Ley De La Vida’ before the prizes are presented. Everyone goes home around 21.00 after a very enjoyable evening.
Day 2
5:30 – I wake with the roosters and have breakfast with the German volunteers. We talk about their experience, from the initial shock of their first few weeks, to their determination to make the most of their year-long stay, to them now being an integral part of community life. They are well-known amongst the children of SFL, who like to chat and play whenever they pass the house. After breakfast I meet Jimmy again, and we go to visit the school and library education projects.
9:00 – The selection of books and educational materials in the library is impressive, and both the school and the library have been colourfully decorated with many art projects from the school children along with flowers and trees from the surrounding gardens. The library also contains materials for a weather station funded by the David Grimes Trust, along with English teaching materials donated by Caversham resident Russell Maddicks during a recent visit. Jimmy tells me that the project that they are currently working on in the library is to raise money for a sound system so that regular dance classes and audio lessons can be held. This is likely to cost a couple of hundred dollars and so it may be sometime before the project is finally completed.
Donated English Materials
The Library
11:00 – Suddenly it is 11.00 and we realise that it is time for me to leave. I say some quick goodbyes and then hop on Jimmy’s bike for the hour drive down the ’41’ from where I will catch my bus back to Esteli. I’m very grateful to Jimmy for taking the time to drive me personally, and this kindness is a typical example of what I have experienced from everyone in SFL during my short visit. It’s been a fantastic experience to meet a community I’ve read so much about since I came to Reading; after getting to know someone as committed to community work as Jimmy, it is much easier to understand how fundraising efforts in Reading can be translated into real community impacts thousands of miles away in SFL. I tell Jimmy that I hope to be able to visit again on my way home to Ireland in a couple of weeks, and he informs me that I should be just in time to sample some freshly harvested honey!
Morning School.
Morning School.
Thank you to Jimmy Zamora and volunteers for providing photos.
Reproducing the result of a scientific experiment is necessary to establish trust, and reproducibility has long been a key part of the scientific method. Traditionally, an experiment could be repeated by following the method documented by the original scientists: setting up apparatus, taking measurements, and so on. If the method was sufficiently well documented then it was, perhaps, likely that the original results could be reproduced. These ‘wet lab’ experiments continue today, but many experiments are now performed entirely on computers. Such computational experiments involve no physical apparatus, but merely the processing of input data files through some scientific software before writing more data files for later analysis and plotting.
Repeating computational experiments is particularly difficult because, before any results can be obtained, there are many pieces of software apparatus that must be assembled: we must install an operating system, choose the correct version of our programming language and all the necessary scientific libraries, and we must use input parameters that are identical to those used in the original experiment. Assembling any of these pieces incorrectly might lead to subtly incorrect results, obviously incorrect results, or a failure to obtain any results at all. All this places a burden on the original scientists to document every piece of software, its version number and input parameters, and places a burden on the scientist wishing to reproduce the results.
There are a variety of tools that help to relieve this burden by automating the process of conducting computational experiments. Singularity is one such tool, having been purpose-built for automating computational experiments. A scientist creates a single configuration file that provides all the information Singularity needs to assemble the pieces of software apparatus and perform the experiment. This way, instead of writing a ‘method’ section that is only human-readable, the scientist has written a configuration file that is both human-readable and machine-readable. Using this configuration, Singularity will create an image file with all the correct versions of scientific software pre-installed. The scientist can verify their work by reproducing their experiment themselves, and they can run the same experiment just by copying the image file between their personal laptop, office workstation, or their institution’s HPC cluster. And they can send their Singularity configuration file and image files to other scientists, or they can obtain a DOI by uploading the files to Zenodo, making their computational experiments citeable in the same way as their journal publications.
I’ve used Singularity to run my own atmospheric simulations using the OpenFOAM computational fluid dynamics software. While my results have yet to be reproduced by others, I regularly use Singularity to reproduce my own results on my laptop, university desktop and AWS cloud compute servers, giving me confidence that my software and my results are robust. Whenever I’ve been stuck, the friendly Singularity developers have been quick to help out on twitter. But overall, I’ve found Singularity to be easy to use, and anyone that is familiar with git commands should feel right at home using it. Give it a try!
The Volcanic and Magmatic Studies Group (VMSG) held a conference from the 3-6th of January in Leeds. The Centre for Observation and Modelling of Earthquakes, Volcanoes and Tectonics (COMET) held a student conference from 8-9th January in Cambridge. It was a conference double-whammy about all things volcanic – heaven!
VMSG is a joint special interest group of the Mineralogical Society of Great Britain and Ireland and the Geological Society of London. The VMSG conference is a fairly small affair, with about 200 in attendance, and it brings together research in geochemistry, seismology, volcanology and related fields. Because of its size, it’s a nice informal space where there is a focus on students presenting their work to the VMSG community, but anyone is free to present their research.
Talks ranged from how tiny fossils, called diatoms, became trapped in a pyroclastic density current, to modelling of lava domes, to how local people interact with the volcano they live on at Masaya, to every aspect of volcanology you can think of. The final talk was definitely a highlight – with everyone in 3D glasses to look at volcanic plumes across Russia, it really brought the satellite images to life (and we got to keep the glasses).
90 posters on a variety of topics were presented, the majority of which were by students (I was one of them). There was of course an obligatory dinner and disco to round off the second day of talks, and a great chance to network with other people from VMSG.
For the best poster title of the conference, you need look no further than this gem.
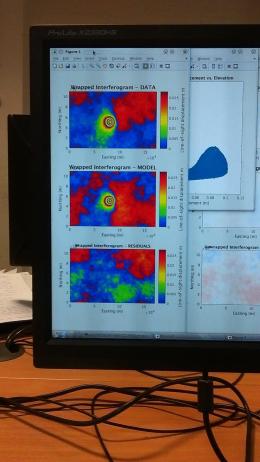
The conference also provides workshops on different aspects of research, with sessions on writing papers, diffusion modelling and InSAR to name a few. These were hosted on the 6th at the University of Leeds Environment and Earth Sciences Department, and comprised a full day of talks and labs so you could get to grips with the techniques you were being shown. I attended the InSAR workshop, which gave a good introduction to the topic of comparing two satellite images and seeing where the ground had moved. There was also a session on deformation modelling in the afternoon and playing with bits of code.
An afternoon of modelling InSAR deformations and code – hill-arity ensued.
Then it was onto the second leg of the conferences, which took the action to Cambridge, where students that are part of COMET met up to discuss work and attend talks from 8-9th January.
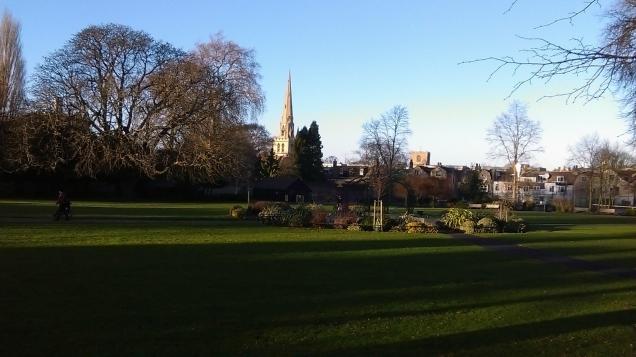
Gneiss weather in Cambridge!
COMET is a National Environment Research Council Centre of Excellence, it comprises a group of researchers that uses remote and ground sensed data and models to study earthquakes and volcanoes. They also work with the British Geological Survey and the European Space Agency, and fund PhD projects in related fields.
The meet-up of students comprised two days of talks from students, with some keynote speakers who had been past members of COMET that had gone on to careers outside of academia. The talks from second and third years included: remote sensing and InSAR being used to examine tectonic strain in the East African Rift Valley and slip (movement) rates along faults in Tibet, modelling how gas bubbles in magma change the more crystals you add to the magma, and using cosmogenic isotopes to work out slip rates on a fault in Italy.
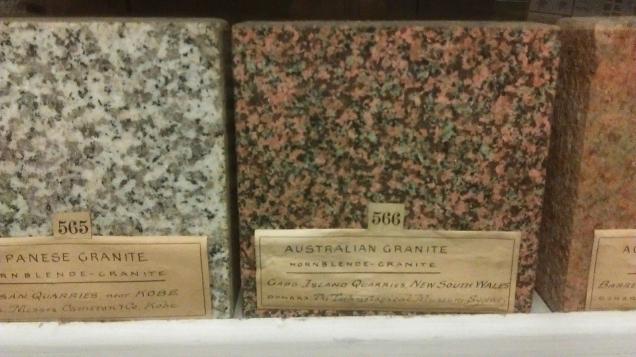
The Department had cabinets and cabinets of samples that rocked.
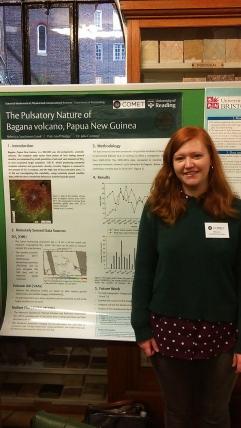
First years are also given the chance to give a talk lasting 5 minutes, so I filled people in on what I’d been up to in the past four months – lots of data collection! My project will be using satellite data to look at the varied eruption behaviour of Bagana volcano in Papua New Guinea, with a view to modelling this behaviour to better understand what causes it. Bagana has a tendency to send out thick lava flows in long pulses and let out lots of gas, and occasionally then violently erupt and let out lots of ash and hot pyroclastic density currents. But it is very understudied, as it is so remote – so there’s lots still to be learnt about it!
Me with my poster (I’ve run out of geology puns).
The meet-up also included a fancy meal in Pembroke College’s Old Library, with candles and it felt a bit like being at Hogwarts! Then it was back to Reading, thoroughly worn out, but with lots of ideas and many useful contacts – VMSG2019 is in St. Andrews and I can’t wait.
‘When is the wet season in Britain?’ a new student from Botswana asked me once. ‘Errrr, January-December?’ I replied flippantly. But in Botswana, and across much of Africa they experience one or two well-defined wet seasons per year, when the majority of the annual rainfall occurs. The timing and length of this wet season(s) is of significant societal importance; it replenishes water supplies used for drinking and other domestic purposes, affects the agricultural growing seasons and impacts the lifecycle of a number of vectors associated with the transmission of diseases such as malaria and dengue fever. Delays in the onset, or even failure of the wet season, can lead to reduced yields and potential food insecurity.
Future changes in climate will not be felt solely through changes in mean climate; projected shifts in atmospheric circulation patterns will also alter seasonality. Africa is acutely vulnerable to the effects of climate change so understanding future changes in the seasonal cycle of African precipitation is of utmost importance in establishing appropriate adaptation strategies. In order to produce reliable projections of seasonality, we require models to contain an accurate representation of current seasonality.
In our recent study we use a novel method to diagnose progression of the rainy seasons across continental Africa and identify important deficiencies in the climate simulations (a previous blog post and paper describes this method).
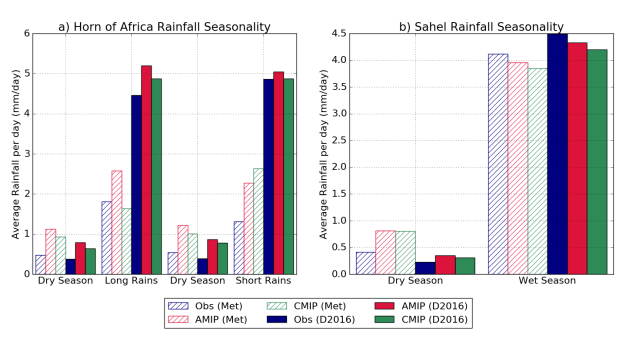
Firstly, when we use the method of Dunning et al. (2016) to identify the wet seasons in satellite-based precipitation estimates, atmosphere-only and coupled climate model simulations we find that the rainy seasons are differentiated more clearly from the dry seasons (shown by larger differences in the average rainfall per rainy day; Figure 1) than when fixed meteorological seasons (OND, MAM etc) are used, as this method accounts for interannual variability in seasonal timing and model timing biases.
Figure 1. Average rainfall rate (mm day−1) during the wet/dry seasons over the Horn of Africa (a) and the Sahel (b) when defined using meteorological seasons (dashed bars) and dynamically varying seasons (Dunning et al. 2016, solid). See Figure 2 for a map of the regions.
Overall, climate model simulations capture the gross seasonal cycle of African precipitation on a continental scale, and seasonal timing exhibits good agreement with observations, however deficiencies manifest over key regions (Figure 2). The Horn of Africa (Somalia, southern Ethiopia, Kenya) experiences two wet seasons per year; the ‘long rains’ during March-May and the ‘short rains’ during October-November. Whilst the simulations capture two wet seasons per year, they exhibit significant timing biases, with the long rains around 3 weeks late and the short rains nearly 4 weeks too long on average (Figure 2). Accounting for these biases may be crucial in interpreting the contrasting trend of observed declining rainfall during the ‘long rains’ in recent years and model projections of increasing ‘long rains’ rainfall in the future.
Figure 2: Multi-model mean onset (open circles) and cessation (filled squares) for observations, atmosphere-only (AMIP) and coupled (CMIP) over selected regions (b). Shaded bars indicate the period of the wet season. For SWAC the mean annual regime onset/cessation in coupled simulations is plotted, along with mean onset/cessation for MIROC4h and BCC-CSM1-1-M (coupled simulations).
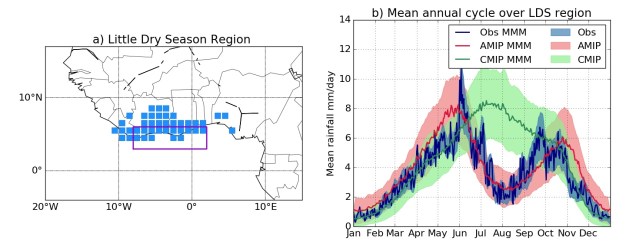
The most notable bias affects the southern coastline of West Africa, a region of complex meteorology with growing population and declining air quality. This region experiences the first wet season from April-June and the second wet season from mid-September-October, separated by the ‘Little Dry Season’ (LDS) in July-August. The LDS can be useful for weeding and spraying crops with pesticides between the two wet seasons, but can adversely affect crop yields if it is too long or pronounced. We find that simulations produce an unrealistic single summer wet season, with no mid-summer break in the rains and this is linked with biases in ocean temperature patterns. Given that climate simulations cannot capture the current seasonality, future projections for this region should be treated with caution.
Figure 3: a) Location of the region that experiences the Little Dry Season (LDS; blue dots) and the SST region of interest (pink box). b) Mean annual cycle of rainfall in observations, atmosphere-only and coupled simulations over LDS region.
This work highlights important deficiencies in the representation of the seasonal cycle of rainfall by climate simulations with implications for the reliability of future climate projections and associated impact assessments, including water availability for hydropower generation, the length of the malaria transmission season and future crop yields.
The full paper can be found here:
Dunning, C.M., Allan, R.P. and Black, E. (2017) Identification of deficiencies in seasonal rainfall simulated by CMIP5 climate models, Environmental Research Letters, 12(11), 114001, doi:10.1088/1748-9326/aa869e
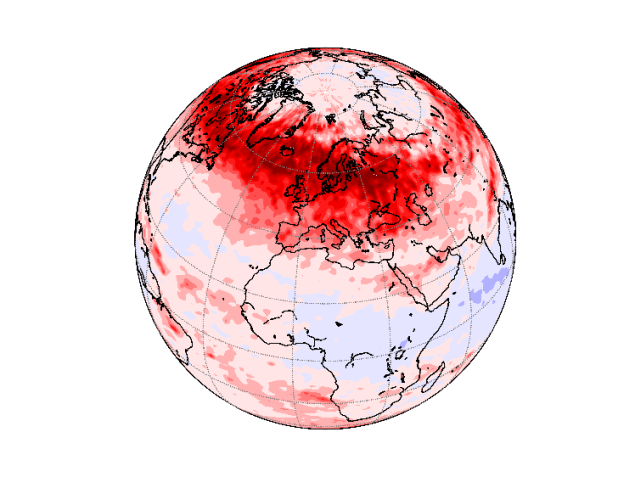
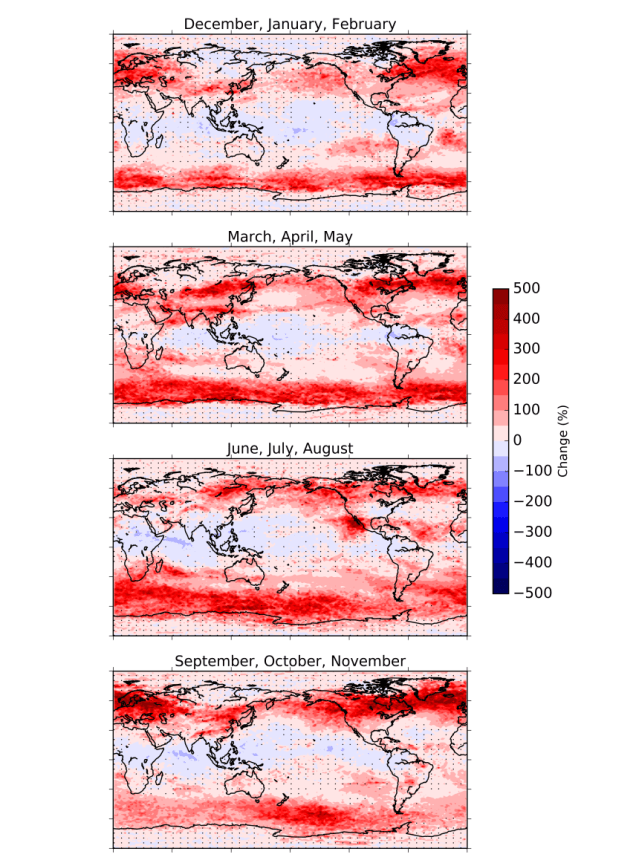
Figure 1: Percentage change of clear-air turbulence over Europe and the North Atlantic
Clear-Air Turbulence (CAT) is a major hazard to the aviation industry. If you have ever been on a plane you have probably heard the pilots warn that clear-air turbulence could occur at any time so always wear your seatbelt. Most people will have experienced it for themselves and wanted to grip their seat. However, severe turbulence capable of causing serious passenger injuries is rare. It is defined as the vertical motion of the aircraft being strong enough to force anyone not seat belted to leave the chair or floor if they are standing. In the United States alone, it costs over 200 million US dollars in compensation for injuries, with people being hospitalised with broken bones and head injuries. Besides passengers suffering serious injuries, the cabin crew are most vulnerable as they spend most of the time on their feet serving customers. This results in an additional cost if they are injured and unable to work.
Clear-air turbulence is defined as high altitude inflight bumpiness away from thunderstorm activity. It can appear out of nowhere at any time and is particularly dangerous because pilots can’t see or detect it using on-board instruments. Usually the first time a pilot is aware of the turbulence is when they are already flying through it. Because it is a major hazard, we need to know how it might change in the future, so that the industry can prepare if necessary. This could be done by trying to improve forecasts so that pilots can avoid regions likely to contain severe turbulence or making sure the aircraft can withstand more frequent and severe turbulence.
Our new paper published in Geophysical Research Letters named ‘Global Response of Clear-Air Turbulence to Climate Change’ aims at understanding how clear-air turbulence will change in the future around the world and throughout the year. What our study found was that, the busiest flight routes around the world would see the largest increase in turbulence. For example, the North Atlantic, North America, North Pacific and Europe (see Figure 1) will see a significant increase in severe turbulence which could cause more problems in the future. These regions see the largest increase because of the Jet Stream. The Jet Stream is a fast flowing river of air that is found in the mid-latitudes. Clear-air turbulence is predominantly caused by the wind traveling at different speeds around the Jet Stream. Climate change is expected to increase the Jet Stream speed and therefore increase the vertical wind shear, causing more turbulence.
To put these findings in context, severe turbulence in the future will be as frequent as moderate turbulence historically. Anyone who is a frequent flyer will have likely experienced moderate turbulence at some point, but fewer people have experienced severe turbulence. Therefore, this study suggests this will change in the future with most frequent flyers experiencing severe turbulence on some flight routes as well as even more moderate turbulence. Our study also found moderate turbulence will become as frequent in the summer as it has done historically in winter. This is significant because although clear-air turbulence is more likely in winter, it will however now become much more of a year round phenomenon (see Figure 2).
Figure 2: Percentage change of clear-air turbulence around the world in all four seasons. No Stipling (stipling) indicates it is (is not) significant at the 90% confidence level.
This increase in clear-air turbulence highlights the importance for improving turbulence forecasting. Current research has shown that using ensemble forecasts (many forecasts of the same event) and also using more turbulence diagnostics than the one we used in this study can improve the forecast skill. By improving the forecasts, we could consistently avoid the areas of severe turbulence or make sure passengers and crew are seat-belted before the turbulence event occurs. Unfortunately, as these improvements are not yet fully operational, you can still reduce your own risk of injury by making sure you wear your seat belt as much as possible so that, if the aircraft does hit unexpected turbulence, you would avoid serious injuries.
Storer, L. N., Williams, P. D., & Joshi, M. M. (2017). Global response of clear-air turbulence to climate change. Geophysical Research Letters, 44, 9976–9984. https://doi.org/10.1002/2017GL074618
At the beginning of September 3 PhD students from Reading, including myself, went to Cambridge to attend the NCAS Climate Modelling Summer School. This is an annual event aimed at PhD students and early career scientists who want to develop their understanding of climate models, with topics covering parameterisations to supercomputers.
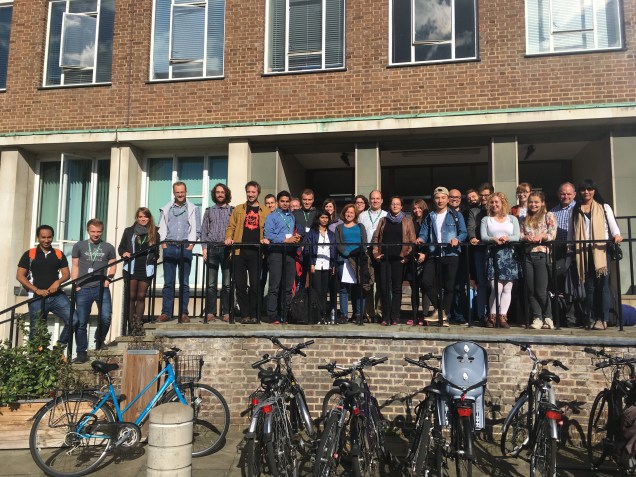
Staff and students of the course pose outside the Chemistry department, which played host to morning lectures
The course ran over two weeks with lectures on the components of climate models in the morning, covering fundamental dynamics and thermodynamics, numerical methods and different parameterisations. This was followed by an afternoon of computer practicals and then more topical lectures in the evening, such as “User engagement in climate science” and “The Sun and Earth’s climate system”. The lectures were very fast paced but this was a great opportunity to cover so many topics in a short space of time and get a grounding in lots of different topics that I will definitely be looking over in future. A poster session on the second evening gave us the chance to learn about other people’s work and make connections with other people starting out their careers in climate science, including a few readers of the blog, that will hopefully last throughout our careers.
One of the highlights of the course was the chance to run some (rather interesting) experiments with an earth system model. This involved breaking into groups with each being given a different project. It was exciting to go through the whole process of having an idea, developing a hypothesis, thinking of specific experiments to answer the hypothesis and then analysing the results in just a week – something that takes much longer when you’re doing a PhD! My group worked on the Flat Earth experiment, which looked at the effect of removing all of the earth’s orography not, to our dismay, turning the earth into a flat disk. I learned a lot about how to run models, something which I have never done even though I use the output. It also developed my understanding of different climate processes that I don’t work with such as the monsoons, and even dynamical vegetation.
Flat earth experiment looking at the change in the monsoon winds
Throughout the course we stayed at St Catharine’s College. Right in the centre of Cambridge it quickly felt like a home from home, keeping us well fed to get through the intense science. Although the weekend was rainy, apparently breaking a run of excellent weather for the school, we still had plenty of time to explore beautiful Cambridge. A few people were even brave enough to go punting!
An interesting, hectic and inspiring two weeks later we may have been glad to head back to Reading for a good sleep but having thoroughly enjoyed the summer school.