Dechen Gyeltschen (d.l.gyeltshen@pgr.reading.ac.uk)
Summary of Gyeltshen, D. L., et al. (2026)
What is space weather?
Space weather refers to the short-term changes in the space environment of our solar system. We tend to focus on near-Earth space due to its direct impact on human life and infrastructure. Extreme space weather events can cause disruptions to satellite operations, navigation systems, radio communication, power grids, and rail networks. Additionally, they expose humans in space or on high-altitude flights to harmful radiation and energetic particles. Although mitigation procedures are being developed and refined, their efficacy relies on the accuracy of extreme space weather forecasts. As such, understanding causal phenomena such as solar eruptive processes and high-speed solar wind remains a high priority for improving prediction accuracy.
Coronal Mass Ejections (CMEs) are drivers of the most severe space weather. They consist of a large structure of plasma and an accompanying magnetic field that have a typical Sun-Earth transit time of 1-5 days. This range exists because a) CMEs are ejected at different speeds and b) CMEs interact with the background ‘ambient’ solar wind and can be accelerated/decelerated due to drag forces. Current CME transit time predictions possess errors on the order ± 10 hours.
How are forecasts made?
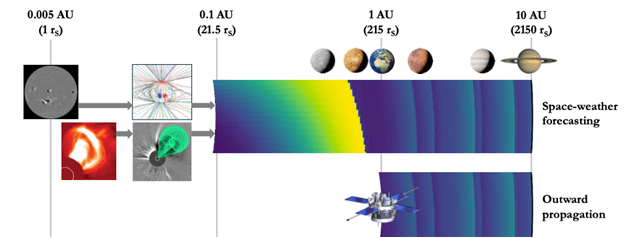
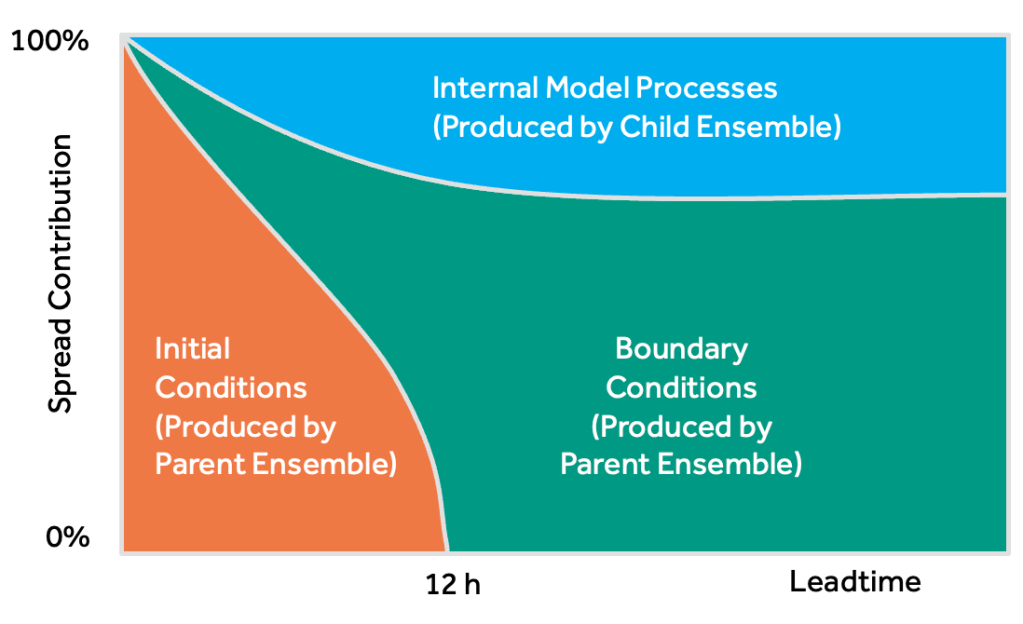
Identifying sources of these errors requires an understanding of how CME transit time forecasts are made. The forecast process is outlined as follows, with a visual summary provided in Figure 1:
- Information about the Sun’s magnetic field structure in the form of magnetograms is used as initial data.
- These are fed into coronal models to generate ambient solar wind speed profiles at 0.1 Astronomical Units from the Sun (1 AU ~ 150 million kilometers).
- CME parameters are derived from white light coronagraph images and extrapolated to 0.1 AU.
- Together they serve as initial conditions for heliospheric models that simulate CME propagation to Earth and other planetary bodies.
While the models used are imperfect, transit time errors largely stem from initial uncertainties in observations of CME parameters and ambient solar wind conditions.
What did we do?
Though the sources of transit time errors are identified, the extents of their contributions vary, and isolating individual error contributions for observed events is difficult. In particular, the ambient solar wind properties exhibit substantial variability over the solar cycle. Observations show that during solar minimum, Earth intercepts interchangeable fast and slow winds over the course of a month. On the other hand, the solar wind during solar maximum is less stark in its longitudinal gradients. Does this structural difference between solar cycle phases change the ambient solar wind influence on CME propagation? If yes, by how much?
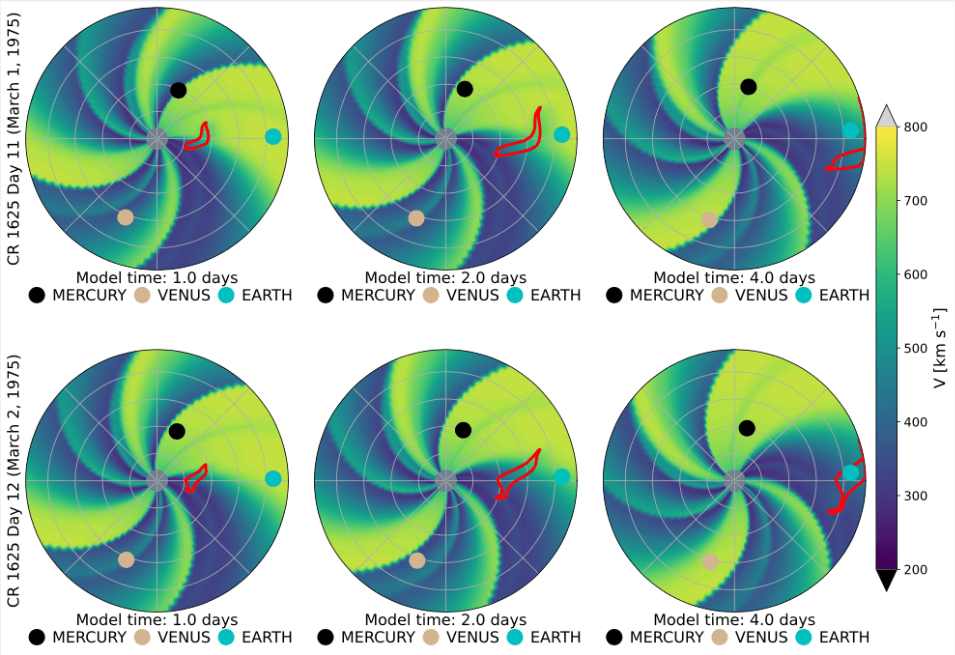
We performed simulations of CME propagation using the Heliospheric Upwind eXtrapolation with time-dependence (HUXt) solar wind model to answer these questions. HUXt approximates the solar wind as a one-dimensional and hydrodynamic flow, which allows for low computational cost. We used realistic solar wind data to simulate a statistically average CME and a fast CME every day between 1975 – 2024 (4.5 solar cycles). This is 18,000 runs and 126,000 simulation days (for each CME)! This gave us a dataset of daily CME transit times to Earth that was later used for the analyses. An example of two such simulations is provided in Figure 2.
What did we find out?
From the dataset of daily transit times, we calculated the monthly medians and interquartile ranges. We used the median to characterise the typical transit time, and the interquartile range to represent short-term variability of transit time. The distributions for these metrics are shown in Figure 3 for both types of CMEs.
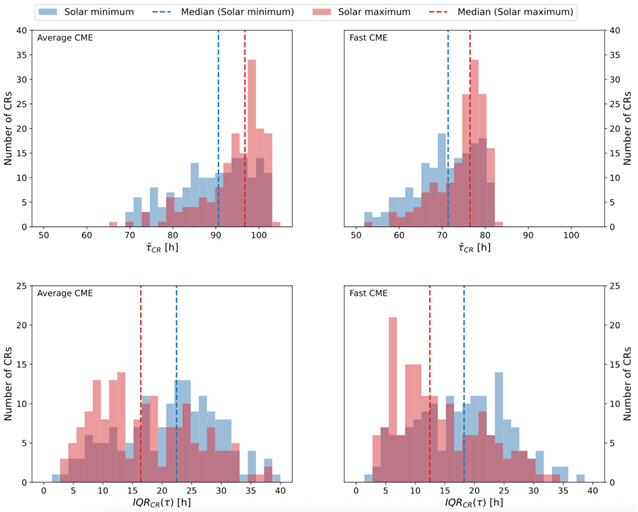
Figure 3 tells us three things:
- CMEs arrive faster during solar minimum: the median values show that average CMEs arrive about 5 hours earlier during solar minimum. This is because CMEs encounter either slow or fast wind during solar minimum, but solar maximum presents mostly slow wind that does not accelerate any CME to the same degree.
- Transit times are more variable (~6h more variable for an average CME) during solar minimum. The design of our experiment dictates that this effect purely arises from the change in ambient solar wind structure over a solar cycle.
- These results are true for both CME types.
In other words, even identical CMEs can exhibit a range of transit times due to changes in the ambient solar wind structure. Moreover, the magnitude of this variability peaks during solar minimum. It implies that in the absence of accurate ambient solar wind conditions, CME arrivals are intrinsically less predictable during solar minimum than solar maximum. Additionally, the penalty for incorrectly modelling the ambient solar wind—for example, small errors in speed gradients or the position of high-speed streams—is greater during solar minimum.
Main Takeaways
- During solar minimum, the arrival time of coronal mass ejections at Earth is roughly twice as uncertain due to the influence of the ambient solar wind compared to solar maximum.
- Importance of ambient solar wind representation during solar minimum is emphasised.

 ) at each time step in each group, and compare these fields between groups to see if I can find a source of forecast error.