Email: h.l.gough@pgr.reading.ac.uk
Recent estimates by the United Nations (2009) state that 50 to 70 % of the world’s population now live in urban areas with over 70 % of our time being spent indoors, whether that’s at work, at home or commuting.
We’ve all experienced a poor indoor environment, whether it’s the stuffy office that makes you sleepy, or the air conditioning unit that causes the one person under it to freeze. Poor environments make you unproductive and research is beginning to suggest that they can make you ill. The thing is, the microclimate around one person is complex enough, but then you have to consider the air flow of the room, the ventilation of the building and the effect of the urban environment on the building.
So what tends to happen is that buildings and urban areas are simplified down into basic shapes with all the fine details neglected and this is either modelled at a smaller scale in a wind tunnel or by using CFD (computer fluid dynamics). However, how do we know whether these models are representative of the real-world?

This is Straw city, which was built in Silsoe U.K during 2014. You can just see the car behind the array (purple circle), these cubes of straw are 6 m tall, or roughly the height of an average house. Straw city is the stepping stone between the scale models and the real world, and was an urban experiment in a rural environment. We measured inside the array, outside of the array and within the blue building so we could see the link between internal and external flow: which meant the use of drones and smoke machines! The focus of the experiment was on the link between ventilation and the external conditions.

After 6 months of data collection, we took the straw cubes away and just monitored the blue cube on its own and the effect of the array can clearly be seen in this plot, where pink is the array, and blue is the isolated cube. So this is showing the pressure coefficient (Cp), and can be thought of as a way of comparing one building to another in completely different conditions. You can see that the wind direction has an effect and that the array reduces the pressure felt by the cube by 60-90 %. Pressure is linked to the natural ventilation of a building: less pressure means less flow through the opening.

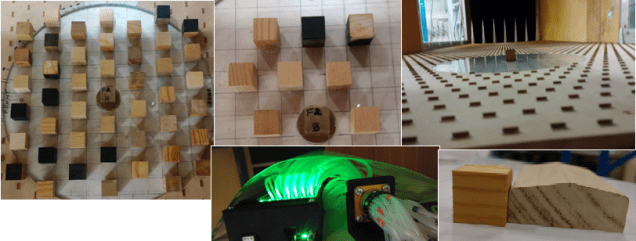
Alongside the big straw city, we also went to the Enflo lab at the University of Surrey to run some wind tunnel experiments of our own, which allowed us to expand the array.
So we have a data set that encompasses all wind directions and speeds, all atmospheric stabilities, different temperature differences and different weather conditions. It’s a big data set and will take a while to work through, especially with comparisons to the wind tunnel model and CFD model created by the University of Leeds. We will also compare the results to the existing guidelines out there and to other similar data sets.
I could ramble on for hours about the work, having spent far too long in a muddy field in all weathers but for more information please email me or come along to my departmental seminar on the 8th November.
This PhD project is jointly funded by the University of Reading and the EPSRC and is part of the Refresh project: www.refresh-project.org.uk
