Caleb Miller – c.s.miller@pgr.reading.ac.uk
In the Reading area, December and January seem to be prime fog season. Since I’m studying the effects of fog on atmospheric electricity, that means that winter is data collection season! However, in order to begin collecting data in the first year of my PhD, there was only a short amount of time to prepare an instrument and deploy it to the observatory before Christmas.
One of the instruments that I am using to measure fog is called the Optical Cloud Sensor (OCS). It was designed by Giles Harrison and Keri Nicoll, and it is described in more detail in this paper: (Harrison and Nicoll 2014). The OCS has four channels of LEDs which shine light into the surrounding air. When fog is present, the fog droplets scatter light back to the instrument, where the intensity from each channel can be measured.
Powering the instrument
The OCS was originally designed to be flown on a weather balloon, which meant that it was meant to be powered by battery and run for only short periods of time. In my case, however, I wanted the device to be able to continuously collect data over a period of weeks or months without interruption. Then, we would be able to catch any fog events, even if they hadn’t been forecasted. That meant the device would need to be powered by the +15V power supply available at the observatory, and my first step was to create a power adapter for the OCS so that this would be possible.
Initially, I had been considering using an Arduino microcontroller as a datalogger, so I decided to put together a power adapter on an Arduino shield (a small electronic platform) for maximum convenience. I included multiple voltage levels on my power adapter and connected them to different power inputs on the OCS. Once this was completed, the entire system could now be powered with a single power supply that was available at the observatory!
I was able to find all of the required parts for the power supply in stock in the laboratory in the Meteorology Department, and I soldered it together in a few days. The technical staff of the university were very helpful in this process! A photograph of the power adapter connected to an Arduino is shown in Figure 1.

Figure 1. The power adapter for the optical cloud sensor, built on an Arduino shield
Storing data from the instrument
Once the power supply had been created, the next step was setting up a datalogging system. On a balloon, the data would be streamed in real-time down to a ground station by radio link. But when this system was deployed to the ground, that would no longer be necessary.
Instead, I decided to use a CR1000X datalogger from Campbell Scientific. This system has a number of voltage inputs which can be programmed using a graphical interface over a USB connection, and it has a port for an SD card. I programmed the datalogger to sample each of the four analog channels coming from the OCS every five seconds and to store the measurements on an SD card. Collecting the measurements was then as simple as removing the SD card from the datalogger and copying the data to my laptop. This could be done without interrupting the datalogger, as it has its own internal storage, and it would continue measuring while the SD card was removed.
I had also considered simultaneously logging a digital form of the measurements to an Arduino in addition to the analog measurements made by the datalogger. This would give us two redundant logging systems which would decrease the chances of losing valuable information in the event of an instrument malfunction. However, due to a shortage of time and a technical issue with the instrument’s digital channels, I was unable to prepare the Arduino logger by the time we were ready to deploy the OCS, so we used only the analog datalogger.
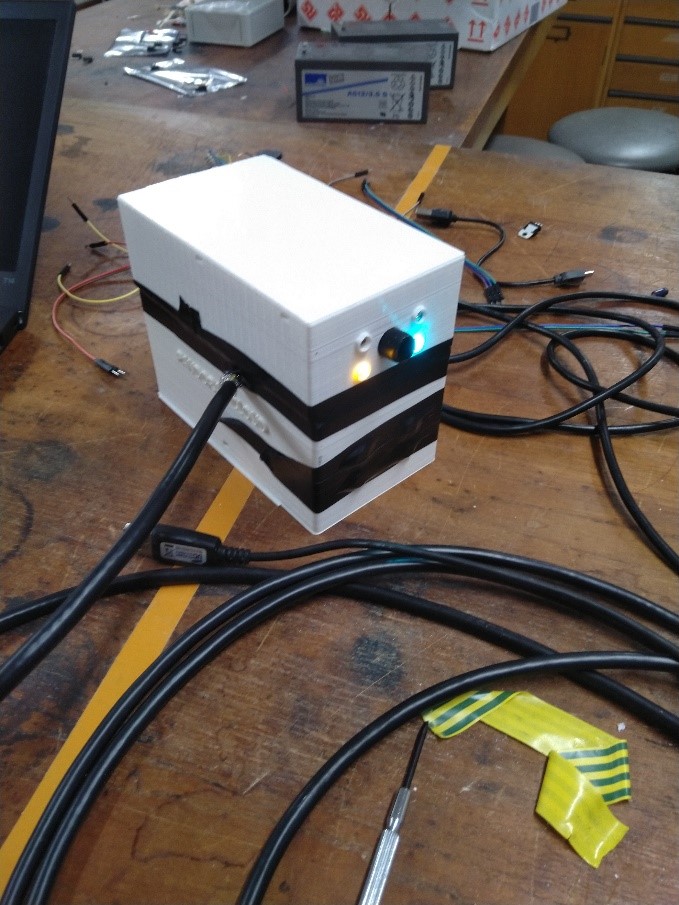
Figure 2. The OCS with its new power supply being tested in the laboratory
Deploying the instrument
Once the power supply and datalogger were completed, the instrument was ready to be deployed! It was a fairly simple process to get approval to put the instrument in the observatory; then I met with Ian Read to find a suitable location to set up the OCS. There were several posts in the observatory which were free, and I chose one which was close to the temperature and humidity sensors in the hopes that the conditions would be fairly similar in those locations. Once everything was ready, the technicians and I took the OCS and datalogger and set it up in the field site. At first, when we powered it on, nothing happened. Apparently, one of the solder joints on my power adapter had been damaged when I carried it across campus. However, I resoldered that connection with advice from the university technical staff, and it worked beautifully!

Figure 3. The datalogger inside its enclosure in the observatory

Figure 4. The OCS attached to its post in the observatory
Except for a short period of maintenance in January, the OCS has been running continuously from December until May, and it has already captured quite a few fog events! With the data from the OCS, I now have an additional resource to use in analyzing fog. The levels of light backscattered from the four channels of the instrument provide interesting information, which I am combining with electrical and visibility measurements to analyze the microphysical properties of fog development.
Hopefully, over the next year, we will be able to measure many more fog events with this instrument that will help us to better understand fog!
Harrison, R. G., and K. A. Nicoll, 2014: Note: Active optical detection of cloud from a balloon platform. Rev. Sci. Instrum., 85, 066104, https://doi.org/10.1063/1.4882318.


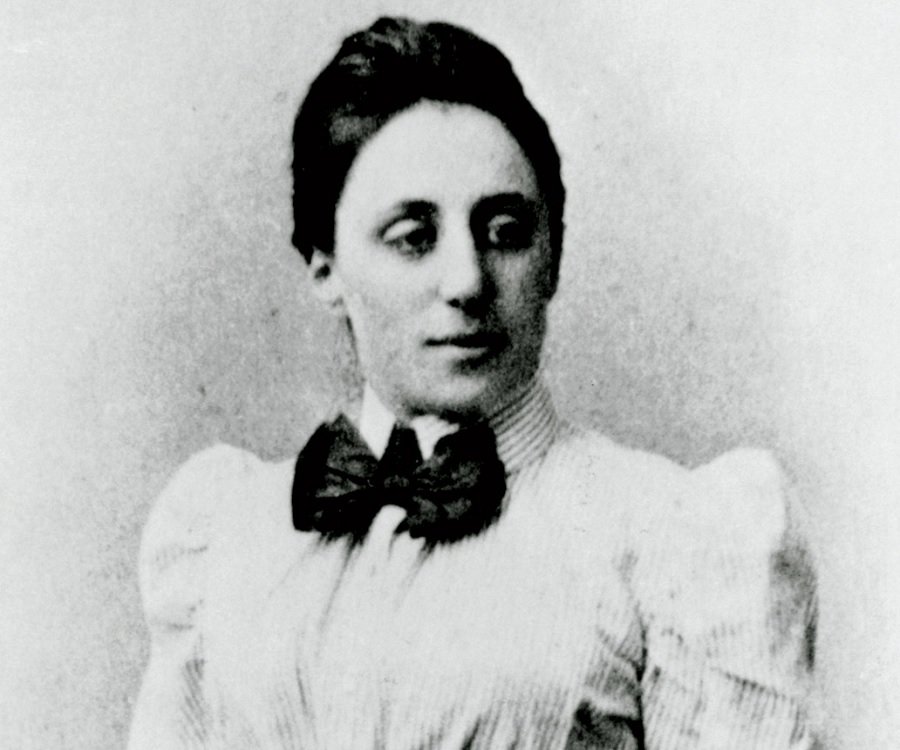 A true revolutionary in the field of theoretical physics and abstract algebra, Amelie Emmy Noether was a German-born inspiration thanks to her perseverance and passion for research. Instead of teaching French and English to schoolgirls, Emmy pursued the study of mathematics at the University of Erlangen. She then taught under a man’s name and without pay because she was a women. During her exploration of the mathematics behind Einstein’s general relativity alongside renowned scientists like Hilbert and Klein, she discovered the fundamentals of conserved quantities such as energy and momentum under symmetric invariance of their respective quantities: time and homogeneity of space. She built the bridge between conservation and symmetry in nature, and although Noether’s Theorem is fundamental to our understanding of nature’s conservation laws, Emmy has received undeservedly small recognition throughout the last century.
 Claudine Hermann is a French physicist and Emeritus Professor at the École Polytechnique in Paris. Her work, on physics of solids (mainly on photo-emission of polarized electrons and near-field optics), led to her becoming the first female professor at this prestigious school. Aside from her work in Physics, Claudine studied and wrote about female scientists’ situation in Europe and the influence of both parents’ works on their daughter’s professional choices. Claudine wishes to give girls “other examples than the unreachable Marie Curie”. She is the founder of the Women and Sciences association and represented it at the European Commission to promote gender equality in Science and to help women accessing scientific knowledge. Claudine is also the president of the European Platform of Women Scientists which represents hundreds of associations and more than 12,000 female scientists.
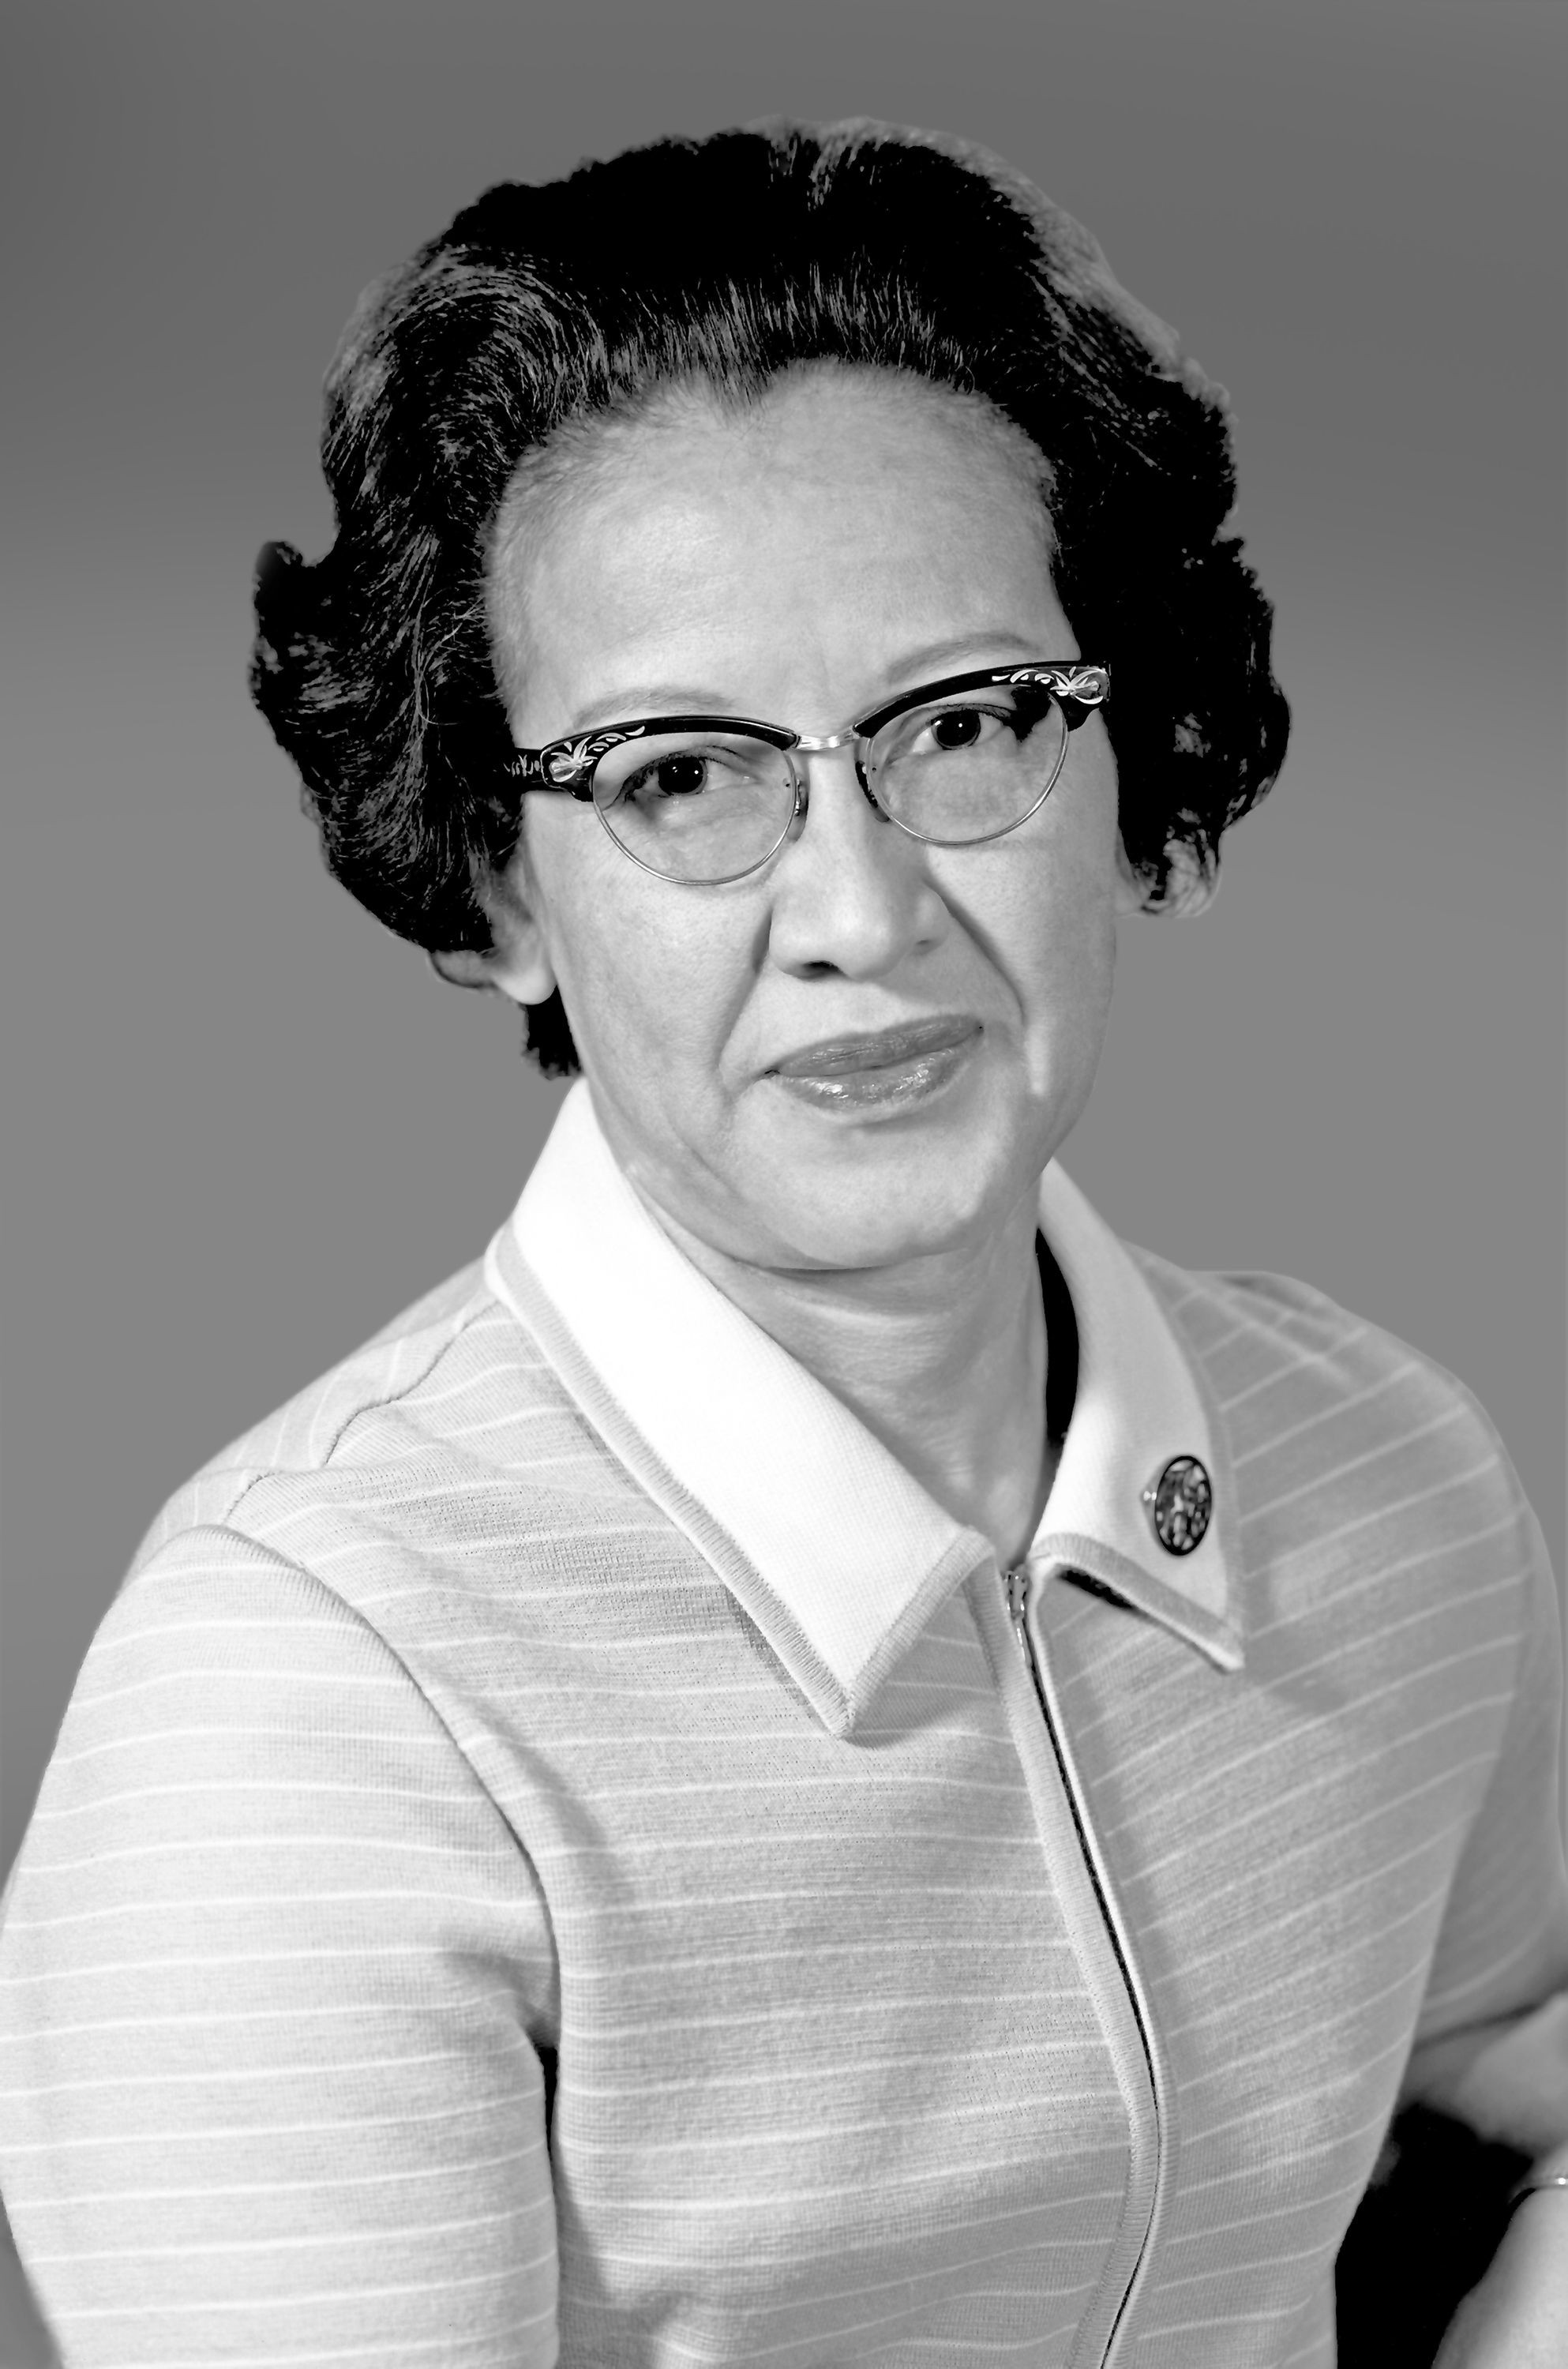 For most people being handpicked to be one of three students to integrate West Virginia’s graduate schools would probably be the most notable life achievements. However for Katherine Johnson’s this was just the start of a remarkable list of accomplishments. In 1952 Johnson joined the all-black West Area Computing section at NACA (to become NASA in 1958). Acting as a computer, Johnson analysed flight test data, provided maths for engineering lectures and worked on the trajectory for America’s first human space flight.
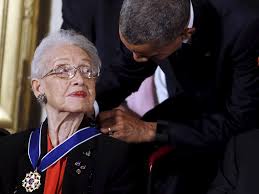
 Women however were not allowed on such ships, thus Marie Tharp was stationed in the lab, checking and plotting the data. Her drawings showed the presence of the North Atlantic Ridge, with a deep V-shaped notch that ran the length of the mountain range, indicating the presence of a rift valley, where magma emerges to form new crust. At this time the theory of plate tectonics was seen as ridiculous. Her supervisor initially dismissed her results as ‘girl talk’ and forced her to redo them. The same results were found. Her work led to the acceptance of the theory of plate tectonics and continental drift.
 Ada Lovelace was a 19th century Mathematician popularly referred to as the “first computer programmer”. She was the translator of “Sketch of the Analytical Engine, with Notes from the Translator”, (said “notes” tripling the length of the document and comprising its most striking insights) one of the documents critical to the development of modern computer programming. She was one of the few people to understand and even fewer who were able to develop for the machine. That she had such incredible insight into a machine which didn’t even exist yet, but which would go on to become so ubiquitous is amazing!

 As a student, being an RMetS member can lead to conversations that could develop your career and bring unexpected opportunities. This has been greatly enhanced with the RMetS mentoring scheme.
 For a student, the highlight in the RMetS calendar is the annual student conference. Every year, sixty to eighty students come together to present their work and develop professional relationships that continue for years to come. This year’s conference is hosted at the University of York on the 5th and 6th July 2018 (
 Other benefits to becoming an RMetS student member include eligibility to the