The impact of atmospheric model resolution on the Arctic

Email: sally.woodhouse@pgr.reading.ac.uk

The Arctic region is rapidly changing, with surface temperatures warming at around twice the global average and sea ice extent is rapidly declining, particularly in the summer. These changes affect the local ecosystems and people as well as the rest of the global climate. The decline in sea ice has corresponded with cold winters over the Northern Hemisphere mid-latitudes and an increase in other extreme weather events (Cohen et al., 2014). There are many suggested mechanisms linking changes in the sea ice to changes in the stratospheric jet, midlatitude jet and storm tracks; however this is an area of active research, with much ongoing debate.

Stroeve_et_al-2012-fig2a
Figure 1. Time-series of September sea ice extent from 20 CMIP5 models (colored lines), individual ensemble members are dotted lines and the individual model mean is solid. Multi-model ensemble mean from a subset of the models is shown in solid black with +/- 1 standard deviation in dotted black. The red line shows observations. From Stroeve et al. (2012)

It is therefore important that we are able to understand and predict the changes in the Arctic, however there is still a lot of uncertainty. Stroeve et al. (2012) calculated time series of September sea ice extent for different CMIP5 models, shown in Figure 1. In general the models do a reasonable job of reproducing the recent trends in sea ice decline, although there is a large inter-model spread and and even larger spread in future projections. One area of model development is increasing the horizontal resolution – where the size of the grid cells used to calculate the model equations is reduced.

The aim of my PhD is to investigate the impact that climate model resolution has on the representation of the Arctic climate. This will help us understand the benefits that we can get from increasing model resolution. The first part of the project was investigating the impact of atmospheric resolution. We looked at three experiments (using HadGEM3-GC2), each at a different atmospheric resolutions: 135km (N512), 60km (N216) and 25km (N96).

sea_ice_concentration_obs_GC2
Figure 2. Annual mean sea ice concentration for observations (HadISST) and the bias of each different experiment from the observations N96: low resolution, N216: medium resolution, N512: high resolution.

The annual mean sea ice concentration for observations and the biases of the 3 experiments are shown in Figure 2. The low resolution experiment does a good job of producing the sea extent seen in observations with only small biases in the marginal sea ice regions. However, in the higher resolution experiments we find that the sea ice concentration is much lower than the observations, particularly in the Barents Sea (north of Norway). These changes in sea ice are consistent with warmer temperatures in the high resolution experiments compared to the low resolution.

To understand where these changes have come from we looked at the energy transported into the ocean by the atmosphere and the ocean. We found that there is an increase in the total energy being transported into the Arctic which is consistent with the reduced sea ice and warmer temperatures. Interestingly, the increase in energy is being transported into the Arctic by the ocean (Figure 3), even though it is the atmospheric resolution that is changing between the experiments. In the high resolution experiments the ocean energy transport into the Arctic, 0.15 petawatts (PW), is in better agreement with observational estimates, 0.154 PW, from Tsubouchi et al. (2018). Interestingly, this is in contrast to the worse representation of sea ice concentration in the high resolution experiments. (It is important to note that the model was tuned at the low resolution and as little as possible was changed when running the high resolution experiments which may contribute to the better sea ice concentration in the low resolution experiment.)

strait_locations
Location of ocean gateways into the Arctic. Red: Bering Strait, Green: Davis Strait, Blue: Fram Strait, Magenta: Barents Sea
ocean_heat_transport_GC2
Figure 3. Ocean energy transport for each resolution experiment through the four ocean gateways into the Arctic. The four gateways form a closed boundary into the Arctic.

We find that the ocean is very sensitive to the differences in the surface winds between the high and low resolution experiments. In different regions the differences in winds arise from different processes. In the Davis Strait the effect of coastal tiling is important, where at higher resolution a smaller area is covered by atmospheric grid cells that cover both land and ocean. In a cell covering both land and ocean the model usually produces wind speeds to low for over the ocean. Therefore in the higher resolution experiment we find that there are higher wind speeds over the ocean near the coast. Whereas over the Fram Strait and the Barents Sea instead we find that there are large scale atmospheric circulation changes that give the differences in surface winds between the experiments.

References

Cohen, J., Screen, J. A., Furtado, J. C., Barlow, M., Whittleston, D., Coumou, D., Francis, J., Dethloff, K., Entekhabi, D., Overland, J. & Jones, J. 2014: Recent Arctic amplification and extreme mid-latitude weather. Nature Geoscience, 7(9), 627–637, http://dx.doi.org/10.1038/ngeo2234

Stroeve, J. C., Kattsov, V., Barrett, A., Serreze, M., Pavlova, T., Holland, M., & Meier, W. N., 2012: Trends in Arctic sea ice extent from CMIP5, CMIP3 and observations. Geophysical Research Letters, 39(16), 1–7, https://doi.org/10.1029/2012GL052676

Tsubouchi, T., Bacon, S., Naveira Garabato, A. C., Aksenov, Y., Laxon, S. W., Fahrbach, E., Beszczynska-Möller, A., Hansen, E., Lee, C.M., Ingvaldsen, R. B. 2018: The Arctic Ocean Seasonal Cycles of Heat and Freshwater Fluxes: Observation-Based Inverse Estimates. Journal of Physical Oceanography, 48(9), 2029–2055, http://journals.ametsoc.org/doi/10.1175/JPO-D-17-0239.1

APPLICATE General Assembly and Early Career Science event

5

On 28th January to 1st February I attended the APPLICATE (Advanced Prediction in Polar regions and beyond: modelling, observing system design and LInkages associated with a Changing Arctic climaTE (bold choice)) General Assembly and Early Career Science event at ECMWF in Reading. APPLICATE is one of the EU Horizon 2020 projects with the aim of improving weather and climate prediction in the polar regions. The Arctic is a region of rapid change, with decreases in sea ice extent (Stroeve et al., 2012) and changes to ecosystems (Post et al., 2009). These changes are leading to increased interest in the Arctic for business opportunities such as the opening of shipping routes (Aksenov et al., 2017). There is also a lot of current work being done on the link between changes in the Arctic and mid-latitude weather (Cohen et al., 2014), however there is still much uncertainty. These changes could have large impacts on human life, therefore there needs to be a concerted scientific effort to develop our understanding of Arctic processes and how this links to the mid-latitudes. This is the gap that APPLICATE aims to fill.

The overarching goal of APPLICATE is to develop enhanced predictive capacity for weather and climate in the Arctic and beyond, and to determine the influence of Arctic climate change on Northern Hemisphere mid-latitudes, for the benefit of policy makers, businesses and society.

APPLICATE Goals & Objectives

Attending the General Assembly was a great opportunity to get an insight into how large scientific projects work. The project is made up of different work packages each with a different focus. Within these work packages there are then a set of specific tasks and deliverables spread out throughout the project. At the GA there were a number of breakout sessions where the progress of the working groups was discussed. It was interesting to see how these discussions worked and how issues, such as the delay in CMIP6 experiments, are handled. The General Assembly also allows the different work packages to communicate with each other to plan ahead, and for results to be shared.

2
An overview of APPLICATE’s management structure take from: https://applicate.eu/about-the-project/project-structure-and-governance

One of the big questions APPLICATE is trying to address is the link between Arctic sea-ice and the Northern Hemisphere mid-latitudes. Many of the presentations covered different aspects of this, such as how including Arctic observations in forecasts affects their skill over Eurasia. There were also initial results from some of the Polar Amplification (PA)MIP experiments, a project that APPLICATE has helped coordinate.

1
Attendees of the Early Career Science event co-organised with APECS

At the end of the week there was the Early Career Science Event which consisted of a number of talks on more soft skills. One of the most interesting activities was based around engaging with stakeholders. To try and understand the different needs of a variety of stakeholders in the Arctic (from local communities to shipping companies) we had to try and lobby for different policies on their behalf. This was also a great chance to meet other early career scientists working in the field and get to know each other a bit more.

What a difference a day makes, heavy snow getting the ECMWF’s ducks in the polar spirit.

Email: sally.woodhouse@pgr.reading.ac.uk

References

Aksenov, Y. et al., 2017. On the future navigability of Arctic sea routes: High-resolution projections of the Arctic Ocean and sea ice. Marine Policy, 75, pp.300–317.

Cohen, J. et al., 2014. Recent Arctic amplification and extreme mid-latitude weather. Nature Geoscience, 7(9), pp.627–637.

Post, E. & Others, 24, 2009. Ecological Dynamics Across the Arctic Associated with Recent Climate Change. Science, 325(September), pp.1355–1358.

Stroeve, J.C. et al., 2012. Trends in Arctic sea ice extent from CMIP5, CMIP3 and observations. Geophysical Research Letters, 39(16), pp.1–7.

Sea ice is complicated, but do sea ice models need to be?

email: r.frew@pgr.reading.ac.uk

Sea ice is complex…

When sea water freezes it forms sea ice, a composite of ice and brine. Sea ice exhibits varying structural, thermodynamic and mechanical properties across a range of length- and time-scales. It can be subcategorised into numerous different types of sea ice depending on where is grows and how old it is.


ice_formation
Different sea ice growth processes and types 1.

However, climate models do not simulate the evolution of floes (they model floes as cylindrical) or the floe size distribution, which has implications for ice melt rates and exchange of heat with the atmosphere and ocean. Sea ice also hosts algae and small organisms within brine channels in the ice, which can be important for nutrient cycles. This is a developing area of earth system modelling.

sympagic_web
Schematic of life within brine channels in sea ice 2.

How much complexity do global climate models need to sufficiently model the interactions of sea ice with the ocean and atmosphere?
The representation of sea ice in global climate models is actually very simple, with minimal sea ice types and thickness categories. The main important feature of sea ice for global climate models is its albedo, which is much greater than that of open water, making it important for the surface energy balance. So, it is important to get the correct area of sea ice. Global climate models need sea ice:

  • to get the correct heat exchange with the atmosphere and ocean
  • to get a realistic overturning circulation in the ocean.
  • because salt release during sea ice growth is important for the ocean salinity structure, and therefore important to get the correct amount of sea in/near deep water formation sites.
  • sea ice is not important for sea level projections.

So, do the complex features of sea ice matter, or are simple parameterisations sufficient?

Sea_ice_Drawing_General_features.svg 
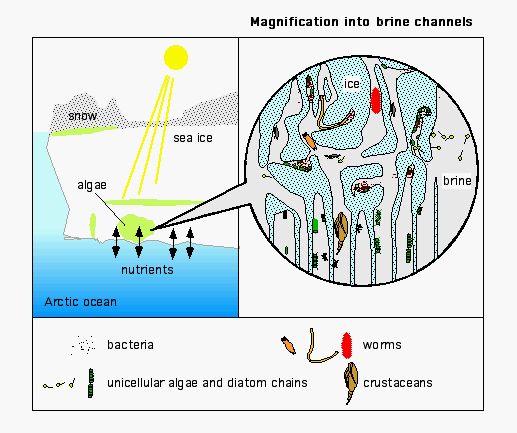
Schematic showing some dynamic features of sea ice 3.

Which leads to a lot more questions…

  • Where does the balance between sufficient complexity and computational cost lie?
  • Does adding extra model complexity actually make it harder to understand what the model is doing and therefore to interpret the results?
  • Do climate models need any further improvements to sea ice in order to better simulate global climate? There is still large uncertainty surrounding other climate model components, such as clouds and ocean eddies, which are believed to explain a lot of the discrepancy between models and observations, particularly in the Southern Ocean.

A lot of these questions depend on the scientific question that is being asked. And the question is not necessarily always ‘how is global climate going to change in the future’. Sea ice is fascinating because of its complexity, and there are still many interesting questions to investigate, hopefully before it all melts!

 Images clockwise from top left: grease ice 4, pancake ice 5, surface melt ponds 6, ice floes 7

The Future Developments in Climate Sea Ice Modelling Workshop

This blog stems from a one day workshop I attended on ‘Future developments in climate sea ice modelling’ at the Isaac Newton Centre as part of a four month programme on the ‘Mathematics of Sea Ice Phenomena’. The format of the day was that three different strands of sea ice researchers gave 40 min talks giving their strand’s point of view of current sea ice developments and what the focus should be for sea ice modelers, each followed by 40 mins of open discussion with the audience.

The three (very good!) talks were:

  1. Dirk Notz: What do climate models need sea ice for? A top-down, system level view of what sea ice models should produce from the perspective of a climate modeller.
  2. Cecilia Bitz: What sea ice physics is missing from models? A bottom-up view of what is missing from current sea ice models from the perspective of a sea ice scientist.
  3. Elizabeth Hunke: What modelling approaches can be used to address the complexity of sea ice and the needs of climate models?


  1. https://nsidc.org/cryosphere/seaice/characteristics/formation.html.
  2. https://www.eduplace.com/science/hmxs/ls/mode/cricket/sect7cc.shtml
  3. https://en.wikipedia.org/wiki/Fast_ice
  4. https://www.travelblog.org/Photos/2101807
  5. http://www.antarctica.gov.au/about-antarctica/environment/icebergs-and-ice/sea-ice
  6. https://en.wikipedia.org/wiki/Sea_ice#/
  7. https://www.shutterstock.com/video/clip-15391768-stock-footage-flying-over-arctic-ice-floes.html

NERC Course on Polar Fieldwork Skills

Email: r.frew@pgr.reading.ac.uk

The aims of the NERC funded BAS run course, “A skills framework for delivering safe and effective fieldwork in the polar regions”, were to learn how to safely and effectively plan and carry out fieldwork at the poles. And in doing so, to give 16 early career polar scientists across a range of disciplines the opportunity to go to the Arctic and learn practical fieldwork skills that we don’t pick up from our day to day office work.

The first part took place at Madingley Hall in Cambridge where we were briefed as an entire cohort on planning, logistics, instrumentation, risk assessment, GPS mapping, health and safety, and were exceedingly well fed as part of the process….

The sunny early morning views that greeted us into Ny Ålesund.

Next we set off to put what we had learnt into practice in Ny Ålesund, on the Island of Spitzbergen (translates as ‘pointy mountains’) in Svalbard. Ny Ålesund is a small international village predominantly inhabited by scientists, with a peak population in summer of around 150, and a hardy winter population of 35 toughing out the minimal daylight hours and chilling temperatures, which reach minimums of around -20°C! Our journey began with three flights, and a stopover in Longyearbyen, also known as Santa Claus town, although it looks a lot more industrial than the name implies. We then had a 3.30am start which was aided by the 24 hour daylight to get the boat to Ny Ålesund. After 4 hours of queasiness we arrived at the NERC UK Arctic research station in Ny Ålesund.

groupphoto
The group all kitted out in front of the NERC UK Arctic Research Station. Photos courtesy of Simon Morley.

The first task we had to do after arrival was the rifle training course. This felt like a dangerous activity to be doing at 2pm in the afternoon after a 3.30am start. However it is safe to say we were all sufficiently awake after the first gun shot… We never left the NERC Arctic base without a massive rucksack full of layers, food, water, flask etc and most importantly a rifle and flare gun in case of running into a polar bears. As we are essentially trespassing on the bears’ territory, it is up to us to avoid disturbing them and to use rifles for self-defence as a last resort.

Terrestrial wildlife around Ny Ålesund. The greatest wildlife threat we faced was the cheeky Arctic fox stealing our sandwiches!

In Ny Ålesund you are very far removed from civilisation, even via digital means as there is no wifi (due to a large experiment detecting quasars) or phone signal. Therefore life in Ny Ålesund feels timeless, as outside events that rampage on social media feel far removed and irrelevant. However signatures of global warming are evident, with the extent of glaciers noticeably retreating each year, and sea ice becoming a rarer and rarer occurrence in the fjord within the living memory of residents of Ny Ålesund.

From left to right: View of Ny Ålesund, the closest we came to a polar bear in the doorway of the mess building, old hut from the mining industry.

The past mining infrastructure is evident everywhere, and classified as ‘heritage’, meaning that despite thinking of them as eyesores, in the otherwise immaculate views the run down infrastructure is actually protected as part of Ny Ålesund’s history. The NERC UK Arctic base was very cosy, we definitely weren’t roughing it like all those early polar explorers! The base is run by station manager Nick Cox, who was full of stories about everything and anything. Most evenings ended with everyone staying at the base gathering together for storytime with Nick in the living room of the UK Arctic base. Everyone in Ny Ålesund went to the mess building (best view I’ve ever had whilst eating breakfast!) in the centre of Ny Ålesund for meals, and on Saturdays everyone makes more of an effort to change out of work clothes and enjoy good food and wine together before heading to the small pub which opens on Saturday nights for people to gather to drink, chatter and dance.

Every time we left the UK station we had to take an enormous rucksack filled with food (packed lunch and lots of snacks, Mars bars disappeared like gold dust), waterproofs, spare layers, emergency blanket, first aid kit, temporary shelters, spare batteries for any equipment needed, flare gun, rifle, bullets, a satellite phone (one between the group), radio (at least one for each separate group). Keeping in contact via radio is very important, even if our group was going to be just 15 mins late we had to radio in and let the people at the station now so they can amend the signing out book. There was also a radio line for all of the stations in Ny Ålesund, so everybody would know if somebody was in trouble or extra help was needed. All the extra layers were essential. In just the five days we were there, we saw sun, rain, snow, sometimes all in one day! Preparing for all eventualities and all of the `what ifs’ is essential for polar fieldwork.

We had two main projects that required fieldwork planning and execution. The first was a two day marine biology project (led by Simon Morley from BAS) which was undertaken in two boats followed up by lab work. We took sediment grabs, plankton nets, CTD profiles (measurements of salinity, temperature and density), put down traps overnight. The aim was to investigate the difference between near rivers and near glaciers, and build up a picture of the food web there. Understanding the small marine creatures at the base of the food web and their temperature tolerance has important implications for larger marine and terrestrial creatures higher up the chain.

Left to right, getting our hands dirty sieving the sediment samples on the boat, putting on the immersion suits before getting onto the smaller boat in case of falling in! Photos courtesy of Simon Morley and Ed King.

The second two day task (led by Ed king from BAS) was to investigate the retreat of a glacier about 4-5km from Ny Ålesund called Midtre Lovénbreen. We carried out was to do a ground penetrating radar survey along and across the nearest glacier to Ny Ålesund to measure the ice thickness. Also, we mapped out the snout of the glacier and took photos to compare the glacier to previous years. A 15-20m retreat of the snout of the glacier relative to last year was measured!

Clockwise from left: Setting up the geophysics kit for a transect on the glacier, Midtre Lovénbreen in 1999, Midtre Lovénbreen September 2016. Glacier photos courtesy of Ed King.

The five or so days we had in Ny Ålesund flew by and before we knew it, it was time for us all to take the (very choppy) boat journey back to Longyearbyen before heading back to the UK. I really, really enjoyed the course, and I would highly recommend to any PhDs or Postdocs who study the poles to consider applying for the course in 2017!

Thanks to everyone at BAS involved in organising the course, in particular Alistair Crane, Blair Fyffe, Simon Morley, Ed King, Nick cox, and of course Ali Teague for organising all of the logistics and ensuring we all got there and back as smoothly as possible!