sshRACC: The Making Of

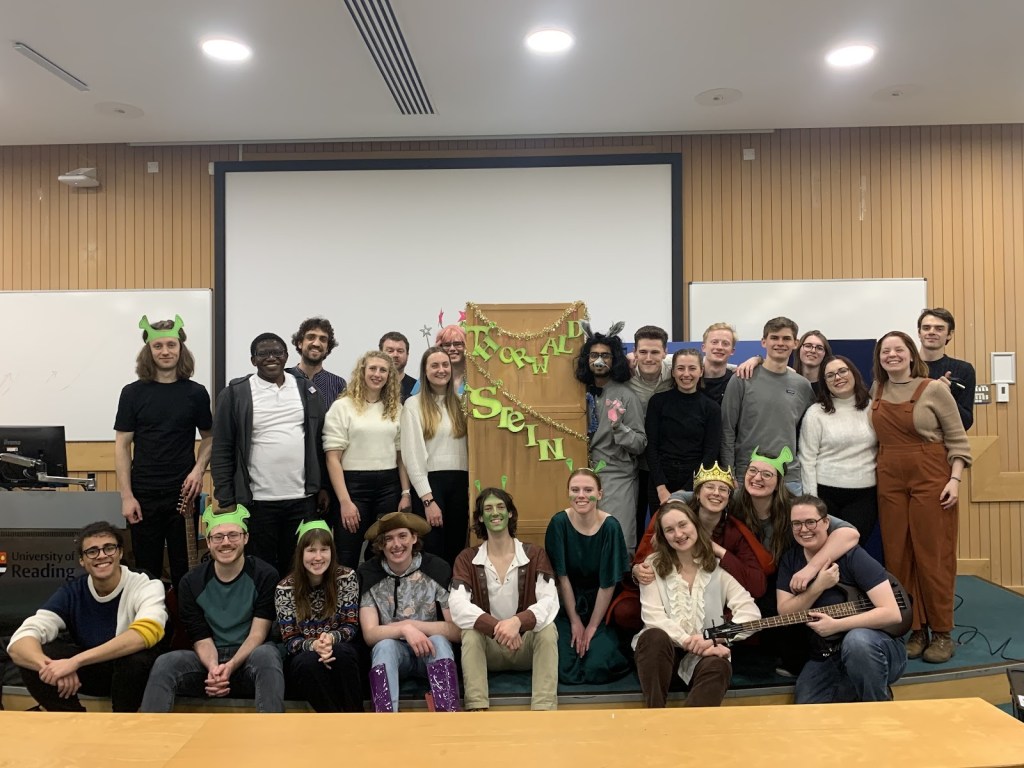
Once upon a time, in the first week of term, last year’s panto organisers Jen Stout and Caleb Miller came to HP180 to ask if we (Catherine Toolan, Rosie Mammatt, and Hette Houtman) wanted to organise this year’s panto. Duty called, and we answered. We swiftly set out to start the preparations for this prestigious event.  

We set week 3 as the deadline to decide what story we would parody (2 weeks behind schedule). Luckily, some brainstorming on the (slightly hungover) morning after last year’s panto afterparty had already produced a strong candidate: Shrek. We agreed that the plot would be hard to adapt, but the potential for great songs would more than make up for it. During a general assembly of PhD students, it was decided almost unanimously that Shrek was the best we could come up with (sorry Rhiannon, maybe you can do Stratatouille next year). And so it was that Thorwald Stein came to be portrayed as an ogre. 

Plot

By week 8 (5 weeks behind schedule) the plot was finally ironed out. 

Thorwald Stein, a happy and eco-friendly researcher, is having a meeting with PhD student DonkeyBrian Lo, when a horde of fairytale characters barge into his swam-, err office. They bring the news that head of department, Lord Charquaad-Perez, has turned off the heating in most of the building to cut down on carbon emissions! When Thorwald demands an end to this nonsense, Lord Charquaad-Perez tells Thorwald he can have the heating back on if he brings down the dreaded FAAM-dragon, which is breathing out loads of carbon and taking up most of their carbon budget.  

Thus, Thorwald and his trusty companion DonkeyBrian set out on this quest to bring back peace to the department. They are joined by Lord Charquaad’s minion, Chris in Westboots, who keeps an eye on things for his master. When they finally reach the far, far away land of Wessex and spot the FAAM-dragon, they discover that world-renowned climate scientist FionEd Hawkins is trapped on it! As is panto tradition, Maarten Ambaum (portrayed as Prince Charming) tells our heroes that his textbook on thermal physics contains the secrets they need to bring down the plane. But alas, all its copies have been stolen from the library! Luckily, in an ode to the retiring SCENARIO DTP coordinator Wendy Neale and her seemingly magical powers in keeping this department running, Fairy Wendymother comes to the rescue. She waves her magic wand and down comes the dreaded FAAM-dragon. 

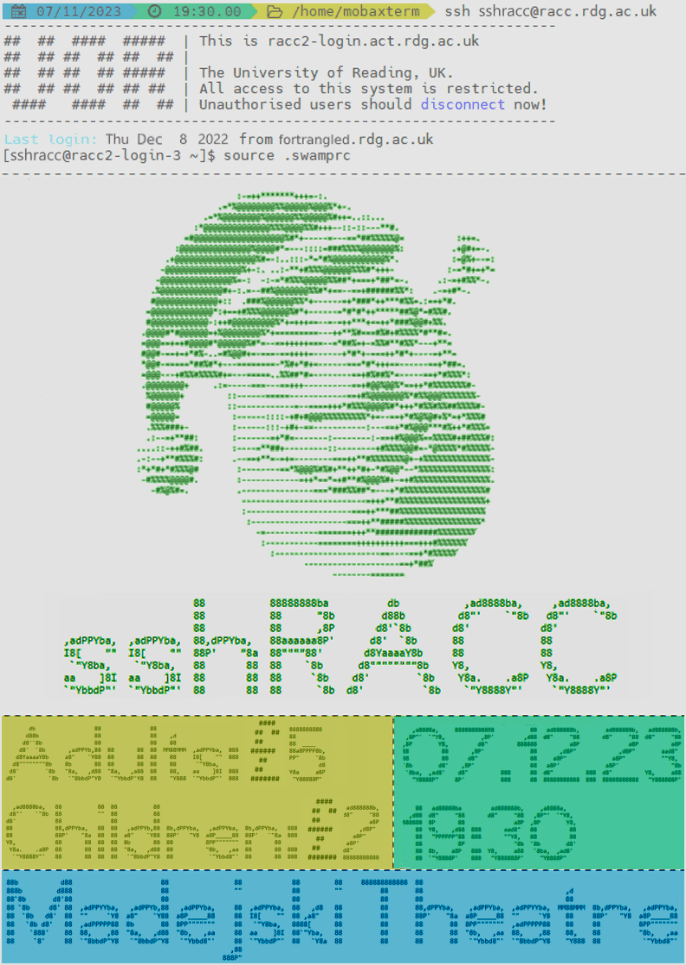
After a long journey (made even longer because their newly set travel carbon budget ran out on the way back), the crew return to the department. Thorwald and FionEd set out to cut down the department’s carbon emissions even further, but are thwarted by Lord Charquaad-Perez, who promises FionEd 3TB of storage on the sshRACC if she works on a paper with him instead of attempting to reduce the department’s carbon emissions. 

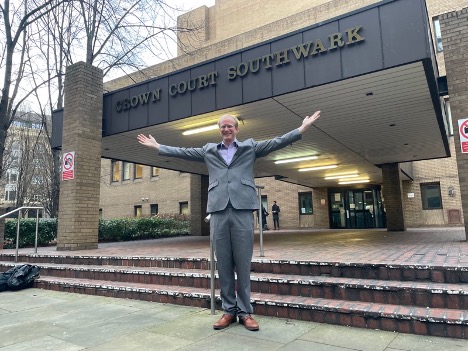
A fight ensues, and in the chaos Lord Charquaad-Perez is taken prisoner by the FAAM dragon. Thorwald and FionEd sneak into Lord Charquaad’s office and discover that it wasn’t FAAM but he himself who had been using up 80% of the budget – on Virgin Galactic tourist flights to the stratosphere! “That man must really love the stratosphere”, FionEd rightly says. 

With Lord Charquaad’s silly emissions no longer an issue, and the implementation of some ingenious emission-reducing measures from FionEd and Thorwald (like reusable coffee cups), the department becomes truly green, and can finally live la vida eco.  

Songs 

Live la vida eco? What’s that?”, we hear you ask. Livin’ la vida eco was an adaptation of the absolute banger of a song by Ricky Martin, on which we ended the panto. And it wasn’t the only bop to be played by the band that night: All-Star by Smash Mouth (‘Ed Hawkins once told me the world is gonna warm up’), Funkytown by Lipps Inc. (‘Won’t you get me some heating now?’), Holding out for a hero by Bonnie Tyler (‘I need you Wendy’), I’m a believer by Smash Mouth (‘Donkey made me change, now I’m a lot cleaner’), and finally Sk8er Boi by Avril Lavigne (‘Working on papers she’s all alone’ – we will admit this one didn’t make a lot of sense, but we just wanted to play the song). All killer, no filler. 

Once again, Flynn Ames and his protege Nathaniel Edward-Inatimi did a superb job of organising the band. Their incredible talent and months of practise meant that by the time the song rehearsals came around (just two weeks before the show), they sounded amazing. The singers, however, did not. But after a few rehearsals, we’d come out of our shells and were able to put out a (hopefully) respectable performance!  

A special thanks must also go to Beth Saunders for her many years of panto knowledge, insane drumming skills and helping us get back into the swing of live pantos after the covid years. You’ll be missed next year! 

Casting  

The job of casting the roles this year seemed to be too easy. First year Robby Marks’ fatal “I don’t mind” remark led to him becoming the title character. Similar mistakes from Niamh O’Callaghan, who u-turned from “absolutely not” to “oh go on then” in a matter of seconds, led to her becoming the esteemed climate scientist FionEd Hawkins.  

As many of the other parts had relatively few lines, it was great to have so many students wanting to get involved. This led to a great atmosphere both on and off stage – we’re hoping this enthusiasm is still there when we start looking for next year’s organisers… 

The Night of the Panto  

Tickets had been sold (about 150 of them!). Props had been made, songs had been practised. The backstage cupboard was full, Robby’s face had been painted green. The cast were assembled and waiting at 5pm sharp. But wait – who was this in the Madejski lecture theatre? Surprise! An unexpected law lecture until 6pm!  

With the doors due to open at 7pm, we were feeling the pressure. Thankfully, due to a fair amount of preparation earlier in the day between lectures, many of the time- consuming tasks like setting the band up had already been done. With all hands- on deck and some tactical delaying of the audience (by keeping them by the buffet for longer) we were ready to go by 7.15.  

The first act was underway and the performance was going well. Nobody had forgotten their lines (yet). At the end of the first act, a quick glance at the watch relieved that we’d whistled through it in under half an hour… eek! 

Fortunately, we had three fantastic interval acts to keep us entertained in the break. Blair McGinness revealed the results of the Big Biscuit Bracket 2023 – why did more than half of you vote for bourbons over chocolate leibniz? Next came the latest episode of Jon Shonk’s much-anticipated Mr Mets series, which was as fantastic as ever. And finally, Chris Scott serenaded us with a handwritten ditty about the fake panto poster on the second floor window, supported by his dancer/backing singer(?) Matt Owens. 

It was time for the second act to get underway. The end of many months of (behind schedule and therefore slightly panicked) writing and rehearsing was in sight, and the performance was wrapped up with a rousing version of Ricky Martin’s famous Livin’ la Vida Eco. Applause was demanded by our cupboard signs, the audience delivered! 

Afterwards, it was time for the swiftest take down you’ve ever seen and a night on the tiles, I mean in the coffee room, with DJ Shonk! 

Some of the phenomenal cast and crew that brought sshRACC to the stage

Reflections  

After lots of hard work, many to-do lists, and more than a few days of PhD research missed, it was very rewarding to see everyone’s efforts come together on the night and to contribute to a long-standing department tradition. Once again, we were reminded that our department is full of people with talents that lie well outside of the field meteorology! We are also proud to say that we delivered (probably) the cheapest evening out in Reading – we believe the panto has remained at the same bargain price of £5 per adult since its beginning in 1992… 

Did we enjoy the experience? Yes, we did. Do we want jobs as directors or producers on the West End? No thank you! 

We would like to thank everyone who attended, contributed to, performed in or supported the panto in any way, shape or form. There are too many of you to list here, so just know that your efforts are appreciated! 

AGU in Sunny San Francisco

Flynn Ames - f.ames@pgr.reading.ac.uk

For my first (and given carbon budgets, possibly the last) in-person conference of my PhD, I was lucky enough to go to AGU (American Geophysical Union Conference) in December 2023, taking place in San Francisco, California. As my first time in America, there was a lot to be excited about. As my first time presenting at a conference, there was a lot to be nervous about. So what did I discover?

To echo the previous year’s post: AGU is big. I mean really big. I mean seriously (please take me seriously) its huge. The poster hall was the size of an aircraft hangar – poster slots were numbered from 1 to over 3000, with each slot used by a different person for each day. Dozens of talk sessions were held at any time simultaneously across the three separate buildings (that thankfully were very close to each other), commencing anytime from 8am to 6pm, Monday to Friday. I was recommended the AGU app and would (uncharacteristically) do the same as it was very helpful in navigating the sessions. I’d also recommend properly planning what you want to attend in advance of the conference – it is very easy to miss potentially relevant sessions otherwise.

The poster hall from two different angles on Monday Morning (left) and Friday evening (right).

The keynote lectures (one per day) were like something out of Gamescom or E3. They always started with flashy, cinematic vignettes. Hosts and speakers had their own entrance theme song to walk out on stage to, whether that be Katy Perry ‘Fireworks’ or Johnny Cash ‘Ring of Fire’ (and of course, they had the cliche teleprompter from which to read). Some Keynote talks were OK in terms of content, but others were definitely a miss, seemingly prioritising style over substance or referring to subject matter in too abstract a way, so that it was difficult to gauge what the take home message was meant to be. I’d say attend at least one for the experience but skip the rest if they don’t appeal to you.

There were also miscellaneous activities to partake in. Exhibition Hall F was where you could find stalls of many research organisations, along with any American or Chinese university you can name (NASA had a cool one with some great graphics). In that same place you could also get a free massage (in plain sight of everyone else) or a professional headshot (which I tried – they brushed something on my face, I don’t know what it was) or even hang out with the puppies (a stall frequented by a certain Met PhD student). You could say there was something for everyone.

I wasn’t the only one needing rest after a long day of conferencing.

I found poster sessions to be far more useful than talks. Most talks were eight minutes long, with a red light switching on after seven. With these time constraints, presenters are often forced to assume knowledge and cram in content and slides. The presentations can be hard to follow at the best of times, but especially when you yourself are presenting later in the week and all you can do is watch and wait for that red light, knowing that it will be deciding your fate in days to come. In contrast, posters can be taken at one’s own pace – you can ask the presenter to tailor their “spiel” to you, whether that’s giving a higher-level overview (as I asked for 100% of the time) or skipping straight to the details. You get a proper chance to interact and have conversations with those doing work you’re interested in, in contrast to talks where your only hope is to hunt down and corner the presenter in the few microseconds after a session ends.

With that said, there were many great talks. Some of the coolest talks I attended were on existing and future mission concepts to Europa (moon of Jupiter) and Enceladus (moon of Saturn) respectively, which has tangential relevance to my own project (icy moon oceanography – probably best left for a future post). In these talks, they discussed the science of the upcoming Europa Clipper mission, along with a robotic EEL concept (like a robot snake) for traversing within and around the icy crevasses on Enceladus’s surface. It was really cool (and very lucky) getting to interact with people working on Europa Clipper and the current Juno mission orbiting Jupiter. Given the time taken between a mission’s proposal, getting (and sometimes losing) funding, planning, construction, and eventual launch and arrival, many of these scientists had been working on these missions for decades! 

My own talk was scheduled for the final conference day (given the luck with everything else, I won’t complain) at 8:40 am. While seemingly early, I struggled to sleep beyond 3:30am most days anyway owing to jet lag so by 8:40am, stress ensured I was wide awake, alert, and focused. 

The talk was over in a flash – I blinked and it was done (more or less).

The most academically helpful part of the conference was the conversations I had with people about my work after the talk. This was my main take away from AGU – that getting to know people in your field and having in-depth conversations really can’t have been achieved by reading someone’s paper, or even sending an email. Meeting in-person really helps. A poster session can thankfully make this feel very natural (as opposed to just randomly walking up to strangers – not for me…) and is therefore something I recommend taking advantage of. Besides, if they’re presenting a poster, they’re less able to run away, even if they want to.

A quick bullet point list of other things I learned (and didn’t) while at AGU:

Things I learned:

  • Apparently, PhD students having business cards is normal in America? – I got handed one during a dinner and the whole table didn’t understand why I was confused
  • NO BISCUITS DURING COFFEE BREAKS in America – probably because you can’t get biscuits easily in America. Regardless, my stomach deemed this a poor excuse.
  • Food portions are, in general, much bigger – surely to make up for the lack of biscuits during coffee breaks.

Things I didn’t learn:

  • How the automatic flush mechanism worked in the conference venue toilets (I really tried)
  • Given there were dozens of sessions happening simultaneously at the conference, probably many other things.

After AGU finished, I was lucky enough to spend extra time in San Francisco. The city really has a piece of everything: fantastic walks near the Golden Gate and coastal area, the characteristic steep streets and cable cars, lots of great places to eat out (great for vegans/vegetarians too! :)), and they had unexpectedly good street musicians. The weather was very nice for December – around 18 degrees. I even got sunburned on one of the days. Public transport is great in San Francisco and getting around the city was no issue.

Some of the various sights (and only pictures I took) in San Francisco.

But San Francisco also appears to be a city of extremes. There are mansions near the beach in an area that looks like a screenshot from Grand Theft Auto Five. Meanwhile in the city itself, the scale of homelessness is far beyond anything I’ve observed here in the UK. I’d very frequently walk past people with large trolleys containing what appeared to be all their belongings. Nearby the Tenderloin district, pitched tents on the pathways next to roads were common, with people cooking on gas stoves. The line to what appeared to be one soup kitchen stretched outside and round the corner. Drug use was also very noticeable. I frequently spotted people slumped over in wheelchairs, others passed out in a subway station or outside a shop. People pass by as if no-ones there. It’s one thing hearing about these issues, but it is eye-opening to see it.

Overall, attending AGU in San Francisco was an experience I will not forget and certainly a highlight of my PhD so far – I’m very grateful I was able to go! Next year’s AGU will take place in Washington DC from 9th-13th December. Will you be there? Will you be the one to write next years AGU post?  Stay tuned to the Social Metwork (and for the latter, your email inbox) to find out.

The Weather Game

Ieuan Higgs – i.higgs@pgr.reading.ac.uk

It’s a colder-than-usual, early October Friday afternoon in the PhD offices of Brian Hoskins. The week is tired, motivation is waning and most importantly – Sappo is only 30 minutes away. As the collective mind of each office meanders further and further from work, someone inevitably pipes up with:

“Has anyone done their weather game predictions this week?”

Some mutterings might move around the room – grumbling about the unpredictability of rainfall in Singapore, or a verbal jab at the cold front that decided to move across Reading about 6 hours too early – until, as predictably as ENSO, a first year cautiously asks,

“…What’s the weather game?”

Which is then met with a suitable response, such as:

“The Weather Game? It’s a bit like fantasy football, but for us weather nerds – you’re going to love it!”. 

At least, that’s how I like to describe it.

The game was hotly contested this Autumn, with huge sign-up and participation across the entire term.

A particular shoutout to the Undergraduates, who were out in force and took 50% of the top 10 spots!

Plotting the cumulative scores for the top 32 players of the term, we are treated to a blindingly colourful cascade (thanks excel?) of points totals:

From this, it is clear that our eventual winner had led the pack for a solid five weeks by the competition end – although I’m sure they were a little nervous in those final two weeks. We can also see the dreaded “flatline” – players who clearly got off to a good start but then, for whatever reason, never submitted another prediction for the remainder of the game. Another interesting feature of these plots is the occasional downward bump – a symptom of the dreaded negative score, which were (thankfully) relatively few and far between.

The illustrious awards ceremony was held in WCD on the 8th of December. Category winners were treated to a bar of tasty chocolate, and the overall winner was gifted a delightful little ThermoPro Bluetooth Thermometer & Hygrometer. This seemed an ideal prize for students who might want check if their flat-share thermostat is being undemocratically switched on while they are out at lectures. Of course, a wooden spoon was given to the last place that played at least 8 of the 10 weeks (and if you’re having that much fun with the weather – can you really ever lose?).

With all of that said, we now put our winners’ names in lights (or on the blog) – immortalising them in the records of Weather Game glory.

Wooden Spoon: Catherine Toolan

Oil and Gas – 66.8 points – 32nd place

Best Pseudonym: Meg Stretton

The SIF Lord

External: Thomas Hall

Noctilucent – 518.6 points – 2nd place

Postgraduate: Caleb Miller

I own a sphere – 414.4 points – 8th place

Staff: Patrick McGuire

WindyCrashLandingOnYou – 432.4 points – 7th place

Overall Winner: Nathan Ng

Come Rain or (Keith) Shine – 534.3 points – 1st place

The Weather Game will be back in Spring of 2024. We are excited to run it, and hope to see many new and familiar faces (well, pseudonyms) there.

Mr Weathers

Ieuan Higgs and Nathan Edward-Inatimi

WesCon 2023: From Unexpected Radiosondes to Experimental Forecasts

Adam Gainford – a.gainford@pgr.reading.ac.uk

Summer might seem like a distant memory at this stage, with the “exact date of snow” drawing ever closer and Mariah Carey’s Christmas desires broadcasting to unsuspecting shoppers across the country. But cast your minds back four-to-six months and you may remember a warmer and generally sunnier time, filled with barbeques, bucket hats, and even the occasional Met Ball. You might also remember that, weather-wise, summer 2023 was one of the more anomalous summers we have experienced in the UK. This summer saw 11% more rainfall recorded than the 1991-2020 average, despite June being dominated by hot, dry weather. In fact, June 2023 was also the warmest June on record and yet temperatures across the summer turned out to be largely average. 

Despite being a bit of an unsettled summer, these mixed conditions provided the perfect opportunity to study a notoriously unpredictable type of weather: convection. Convection is often much more difficult to accurately forecast compared to larger-scale features, even using models which can now explicitly resolve these events. As a crude analogy, consider a pot of bubbling water which has brought to the boil on a kitchen hob. As the amount of heat being delivered to the water increases, we can probably make some reasonable estimates of the number of bubbles we should expect to see on the surface of the water (none initially, but slowly increasing in number as the temperature of the water approaches the boiling point). But we would likely struggle if we tried to predict exactly where those bubbles might appear. 

This is where the WesCon (Wessex Convection) field campaign comes in. WesCon participants spent the entire summer operating radars, launching radiosondes, monitoring weather stations, analysing forecasts, piloting drones, and even taking to the skies — all in an effort to better understand convection and its representation within forecast models. It was a huge undertaking, and I was fortunate enough to be a small part of it. 

In this blog I discuss two of the ways in which I was involved: launching radiosondes from the University of Reading Atmospheric Observatory and evaluating the performance of models at the Met Office Summer Testbed.

Radiosonde Launches and Wiggly Profiles

A core part of WesCon was frequent radiosonde launches from sites across the south and south-west of the UK. Over 300 individual sondes were launched in total, with each one requiring a team of two to three people to calibrate the sonde, record station measurements and fill balloons with helium. Those are the easy parts – the hard part is making sure your radiosonde gets off the ground in one piece.

You can see in the picture below that the observatory is surrounded by sharp fences and monitoring equipment which can be tricky to avoid, especially during gusty conditions. In the rare occurrences when the balloon experienced “rapid unplanned disassembly”, we had to scramble to prepare a new one so as not to delay the recordings by too long.

The University of Reading Atmospheric Observatory, overlooked by some mid-level cloud streets. 

After a few launches, however, the procedure becomes routine. Then you can start taking a cursory look at the data being sent back to the receiving station.

During the two weeks I was involved with launching radiosondes, there were numerous instances of elevated convection, which were a particular priority for the campaign given the headaches these cause for modellers. Elevated convection is where the ascending airmass originates from somewhere above the boundary layer, such as on a frontal boundary. We may therefore expect profiles of elevated convection to include a temperature inversion of some kind, which would prevent surface airmasses from ascending above the boundary layer. 

However, what we certainly did not expect to see were radiosondes appearing to oscillate with height (see my crude screenshot below). 

“The wiggler”! Oscillating radiosondes observed during elevated convection events.

Cue the excited discussions trying to explain what we were seeing. Sensor malfunction? Strong downdraughts? Not quite. 

Notice that the peak of each oscillation occurs almost exactly at 0°C. Surely that can’t be coincidental! Turns out these “wiggly” radiosondes have been observed before, albeit infrequently, and is attributed to snow building up on the surface of the balloon, weighing it down. As the balloon sinks and returns to above-freezing temperatures, the accumulated snow gradually melts and departs the balloon, allowing it to rise back up to the freezing level and accumulate more snow, and so on. 

That sounds reasonable enough. So why, then, do we see this oscillating behaviour so infrequently? One of the reasons discovered was purely technical. 

If you would like to read more about these events, a paper is currently being prepared by Stephen Burt, Caleb Miller and Brian Lo. Check back on the blog for further updates!

Humphrey Lean, Eme Dean-Lewis (left) and myself (right) ready to launch a sonde.

Met Office Summer Testbed

While not strictly a part of WesCon, this summer’s Met Office testbed was closely connected to the themes of the field campaign, and features plenty of collaboration. 

Testbeds are an opportunity for operational meteorologists, researchers, academics, and even students to evaluate forecast outputs and provide feedback on particular model issues. This year’s testbed was focussed on two main themes: convection and ensembles. These are both high priority areas for development in the Met Office, and the testbed provides a chance to get a broader, more subjective evaluation of these issues.

Group photo of the week 2 testbed participants.

Each day was structured into six sets of activities. Firstly, we were divided into three groups to perform a “Forecast Denial Experiment”, whereby each group is given access to a limited set of data and asked to issue a forecast for later in the day. One group only had access to the deterministic UKV model outputs, another group only had access to the MOGREPS-UK high-resolution ensemble output, and the third group has access to both datasets. The idea was to test whether ensemble outputs provide added value and accuracy to forecasts of impactful weather compared to just deterministic outputs. Each group was led by one or two operational meteorologists who navigated the data and, generally, provided most of the guidance. Personally, I found it immensely useful to shadow the op-mets as they made their forecasts, and came away with a much better understanding of the processes which goes into issuing a forecast.

After lunch, we would begin the ensemble evaluation activity which focussed on subjectively evaluating the spread of solutions in the high-resolution MOGREPS-UK ensemble. Improving ensemble spread is one of the major priorities for model development; currently, the members of high-resolution ensembles tend to diverge from the control member too slowly, leading to overconfident forecasts. It was particularly interesting to compare the spread results from MOGREPS-UK with the global MOGREPS-G ensemble and to try to understand the situations when the UK ensemble seemed to resemble a downscaled version of the global model. Next, we would evaluate three surface water flooding products, all combining ensemble data with other surface and impact libraries to produce flooding risk maps. Despite being driven by the same underlying model outputs, it was surprising how much each model differed in the case studies we looked at. 

Finally, we would end the day by evaluating the WMV (Wessex Model Variable) 300 m test ensemble, run over the greater Bristol area over this summer for research purposes. Also driven by MOGREPS-UK, this ensemble would often pick out convective structure which MOGREPS-UK was too coarse to resolve, but also tended to overdo the intensities. It was also very interesting to see the objective metrics suggested that WMV had much worse spread than MOGREPS-UK over the same area, a surprising result which didn’t align with my own interpretation of model performance.

Overall, the testbed was a great opportunity to learn more about how forecasts are issued and to get a deeper intuition for how to interpret model outputs. As researchers, it’s easy to look at model outputs as just abstract data, which is there to be verified and scrutinised, forgetting the impacts that it can have on the people experiencing it. While it was an admittedly exhausting couple of weeks, I would highly recommend more students take part in future testbeds!

International symposium of data assimilation 2023

Laura Risley – l.risley@pgr.reading.ac.uk

The 9th international symposium of data assimilation (ISDA) was held in Bologna, Italy this October. Firstly, what is data assimilation? Data assimilation is the process of combining observed data with a numerical model. It also considers the errors present in both and produces the best estimate of the current state of the system. Data assimilation is used in various fields such as ocean modelling and numerical weather prediction. As such it has become an extremely important technique with high impact. ISDA is one of the largest gatherings of data assimilation scientists from across the world, and this year’s conference was no exception.  

Figure 1: All talks over the course of the week were held in this room. Here is also a snippet of the schedule.

The conference took place over 5 days, each packed full of talks. There were no parallel sessions and so attendees were able to go to all 73 talks during the day! The conference didn’t stop there as there were two posters’ sessions on the Tuesday and Thursday evenings, as well as a gala dinner on the Wednesday evening which we were all invited to. This was held in the Palazzo Pepoli – the museum of the history of Bologna. A unique venue that we were fortunate enough to be able to explore before a delicious meal. 

Attendees of ISDA came from various institutions. These included ECMWF, RIKEN, Penn State, The Met Office UK, CERFACS, DWD and many more. It was a truly global affair. The University of Reading was represented by members of the Data Assimilation Research Centre (DARC). Presentations were given by staff – Sarah Dance, Alison Fowler, Yumeng Chen and Ivo Pasmans, whereas PhD students presented posters – myself, Ieuan Higgs and Helen Hooker. The poster sessions were a great opportunity to discuss our work with people from various disciplines, but all interested. I found the experience extremely useful and very enjoyable, despite being quite nervous before the session. Poster sessions are a great chance to not only share your work with others but ask for advice from experts. Although it feels daunting talking to those who are far more experienced in data assimilation, you soon realise that everyone is there to learn and help each other. It is a supportive and friendly environment!  

Figure 2: PhD students from DARC presenting posters at ISDA (me, Ieuan Higgs and Helen Hooker).  

The conference, centred on data assimilation, covered a variety of topics from parameter estimation in earthquake models; lightning data assimilation; non-linear data assimilation and anchor observations – just to name a few! Machine learning took centre stage this year with researchers highlighting both the pitfalls and the advantages of incorporating machine learning techniques within data assimilation. 

The conference has previously been held in various locations such as Reading, Munich and Fort Collins. This year it was held in Bologna, Italy and organised by Alberto Carrassi. Bologna is a wonderful city, full of historic buildings and food. Lots and lots of food. I felt very lucky to have been able to take my first trip over to Italy for the conference. 

Figure 3: Some sights from Bologna!  

Overall, it was a fantastic week of ensemble Kalman filters, cost functions, covariance matrices, localisation, pizza, and pasta. I learnt a lot about data assimilation; how vast the applications are and how much I still have to discover in the future. ISDA 2024 will be held in Kobe, Japan! 

Designing a program to improve data access for my PhD project

Caleb Miller – c.s.miller@pgr.reading.ac.uk

In my project work, I regularly need to load hundreds of various CSV (comma separated values) files with daily data from meteorological observations. For example, many of the measurements I use are made at the Reading University Atmospheric Observatory using the main datalogger, in addition to some of my own instruments. This data comes distributed across a number of different files for each day.

Most of my analysis is done in Python using the Pandas library for data processing. Pandas can easily read in CSV files with a built-in function, and it is well-suited for the two-dimensional data tables which I regularly use.

However, after a year or so of working directly with CSV files, I began to run up against some of the performance limitations of doing so.

Daily CSV files may be good for organizational purposes, but they are not the most efficient way to store and access large amounts of data. In particular, once I wanted to start studying many years’ worth of data at the same time, reading in each file every time I wanted to re-run my code began to slow the development process significantly. Also, the code that I had written to locate each file and read it in for a given range of dates was somewhat clunky and inflexible.

It was time to develop a new solution for accessing the met observations more quickly and easily.

Pandas has built-in functions for reading a variety of different formats, not just plain-text CSV files. I decided to constrain my choices for data formats to those that Pandas could read natively.

In addition, I wanted to build a system that would satisfy three primary goals:

  • Compatibility for long-term data storage
  • High speed
  • Simple programming interface

Compatibility is important, since I wanted to ensure that my data would continue to be readable to others (and myself in the future) without any specialized software that I had written. CSV is excellent for that purpose.

However, CSV was not a fast way to access the data. Ideally, the system I chose could store both numerical data and timestamps as floating point values rather than encoded text, for better performance.

Finally, I wanted to create a system that would be flexible and easy to use–ideally, something that would only require one or two lines of code to load in the data from a given instrument and date range, rather than the many complicated steps that had been required to search for and load the many files I had been using.

System Design

In the end, I settled on a rather complicated system that resulted in a very simple, reliable, and fast data stack that could be used to access my data.

At the base layer, all the data would be stored in the original CSV files. This is the format that most of the data comes in, and the few instruments that do not can easily be converted. CSV is a very common file format, which can be read easily by many software packages and will likely be useful far into the future, even when current software is too outdated to be run.

However, rather than directly accessing the CSV files, I import them occasionally into a SQLite database file. SQLite is a widely-used, open source software library which enables users to run a database from a single file, rather than a server (as opposed to many other popular database programs). The advantage over CSV files is that it is relatively fast. Data from an individual table can be accessed by a query specifying the start and end dates. This means that it is very easy to load in arbitrary timeseries of data.

However, for loading many years’ worth of high-resolution data, even SQLITE was not as fast as I wanted. Pandas is also capable of using a format called pickle. “Pickling” a dataframe outputs the dataframe from program memory to the disk as a file. This can be then be read back very quickly into a program at a later time, even for large files.

In my data access library, once a request is made for a given timeseries of data, that dataframe is cached to a pickle file. If the same request is made again shortly afterwards, rather than going back to the SQLite database, the data is loaded from the pickle file. For large datasets, this can reduce the loading time from nearly a minute to just a few seconds, which is very helpful when repeatedly debugging a program using the same data! The cache files can be relatively large, however, so they are automatically cleared out when the code runs if they have not been used for several days.

Finally, all of this functionality is available behind a simple library, which allows for accessing a dataset from any other Python code on my machine with just two lines, as shown below.

import foglib.db as fdb
fdb.load_db("dataset_name","start_datetime","end_datetime")

Conclusions

I have found this system to work very well for my purposes. It required a fair amount of development work, but the returns have been very beneficial.

By allowing me to access almost any of my data with just a few lines of code, I can now start new analyses with less time and code overhead. This means that I have more time and energy to spend answering science questions. And because it allows reading in large datasets so quickly, this means that I can rapidly debug my code without requiring me to wait as long while my code runs.

My particular solution may not be the ideal data-loading system for everyone’s needs. However, based on my experiences working on this program, I believe that time invested in enabling access to your data at the beginning of a PhD is time very well spent.

Met Ball 2023

Adam Gainford – a.gainford@pgr.reading.ac.uk

Laura Risley – l.risley@pgr.reading.ac.uk

They said it couldn’t be done. Two Met Galas in one week?! Ludicrous, people will get confused! Well, thanks to the hard work of this year’s organisers, we’re fairly certain everyone made it to the correct event and with the appropriate attire. Although I am still waiting on that cat suit I ordered…

All jokes aside, this year’s Met Ball was held at the Meadow Suite on Friday 5th May, raising money for the Reading San Francisco Libre Association. The department has close ties to the RSFLA through the David Grimes Trust, and helps to support the people, development and environment of San Francisco Libre, Nicaragua. Just last year, the RSFLA helped provide families in the area with chickens to improve incomes and diets, on top of the ongoing support for the community centre and environmental centre in the town.

After weeks of planning, deciding menus, fixing typos (I hope you all enjoyed your lamp rump by the way) and asking for prize donations, the night finally rolled around. We were delighted to be joined by Nicola Tipler, Clive Tipler, Paul Starkey and Caroline Starkey from the RSFLA, who provided information boards and newsletters about the trust. We thank them for their attendance and for very generously providing four of the prizes including the highest selling item in the auction. We were also very pleased to welcome the Deputy Mayor of Reading Cllr Debs Edwards and her husband Alun Edwards to the event. Cllr Edwards gave a great speech before the raffle and was very enthusiastic during the auction! We hope she enjoys her tickets to the Newbury races!

We also heard from Devon Francis before the auction, who talked about the impacts that the trust has on the people of San Francisco Libre. Having visited the town herself, she has seen what a difference this support can make to the lives of so many within the town. The trust is in need of volunteers to help with admin and decision making, if you think you could help please see the contact information at the bottom of this post.

On the night we had a delicious three course meal, a raffle and an auction. Natalie Ratcliffe sure enjoyed the raffle, beating the odds and winning three prizes! Though very kindly donated the third, ain’t she kind! We had some great raffle prizes all donated from people in the department, such as Keith Shine, to local companies such as Mama’s way. Sorry to all those who didn’t win, you’ll just have to bribe next year’s organisers better! After dessert and all the speeches, we commenced the auction! Again there were some fantastic prizes to be won, in particular the Mr Met Mugs made their second appearance this time featuring Pete Inness, Ed Hawkins, Andrew Charlton-Perez and Sir Brian Hoskins! Thank you to Jon Shonk who never fails to wow us all with his Mr Met creativity! The rest of the night was left to music and chatting, with a surprise spot of karaoke thanks to Hette Houtman and Ankit Bhandekar (do we see potential Met Ball 2024 organisers??). 

We would like to thank everyone who attended, we had a great time hosting and we’re pleased to have raised so much money for the trust. Thanks to all of your tickets, raffle sales and auction prizes, we managed to raise £1,225 for the association, with almost £800 coming from the auction alone! Special thanks go to all those who very generously gave prizes for the evening. We can’t wait for Met Ball 2024!


If you would like to donate to the Reading San Francisco Libre Association or get involved with the Trust, please visit the website or contact Paul Starkey (p.h.starkey@reading.ac.uk).

Scientists Acquitted: Examining the Role of Consent in Climate Activism 

James Fallon – j.fallon@pgr.reading.ac.uk 

Ecosystem collapse and climate change threaten all of our futures. What power do scientists have to avoid this looming catastrophe? 

Last week, a jury at Southwark Crown Court heard statements from two scientists facing charges of criminal damage. They had taken action by calling on members of the Royal Society and the wider scientific community to engage in civil disobedience and non-violent direct action: to act as if the science is real, demonstrating a response commensurate with the catastrophic effects being predicted. 

Figure 1: In September 2020, Scientist Rebellion co-founders Mike and Tim took non-violent direct action at the UK’s most prominent scientific body, The Royal Society – source scientistrebellion.com

The defence rested on legal “consent”: that those working at the institute would, when confronted with the facts, consent to their actions. Had the Royal Society realised the potential of scientists to drive political change through activism, they would have agreed that the damage to their building was justified in pursuit of averting climate and ecological collapse. Dr. Tim Hewlett, astrophysicist, and Mike Lynch-White, former theoretical physicist, were unanimously acquitted on Friday.

Despite new bills being introduced to criminalise protests [1], and available legal defences being constrained, many court juries are in fact still finding climate activists not guilty for non-violent direct action .

In this blog post, I want to introduce some key ideas which explain the power and impact these types of protest can have when used by climate activists today.

Radical Intervention: What needs to happen?

According to Morrison et al. 2020, “meaningful climate action requires interventions that are preventative, effective, and systemic – interventions that are radical rather than conventional” [2]. The term “radical” can assume different definitions, categorised in Figure 2:

Figure 2: Debates about radical intervention invoke at least six different interpretations of ‘radical’. These different interpretations can be viewed as a typology, with each type reflecting the extent to which the intervention disrupts the status quo to address the root drivers of climate change. – Morrison et al. 2022

Current approaches to address climate change focus on what may be considered category “1” and “2” interventions: avoiding systemic changes and focusing on “techno fixes” and soft economic changes (such as carbon accounting). To businesses and politicians, these approaches are often desirable and successful , because they can be rapidly implemented and offer hope. But many of these approaches can suffer from a lack of follow-up, loopholes, or may even inadvertently generate new environmental or social problems.

More radical intervention is challenging, because root drivers of climate and ecological breakdown are “deeply embedded in existing societal structures, practices and values at multiple scales, and manifest in diverse ways; including as constraints on women’s reproductive rights, through irresponsible practices of technological innovation and overconsumption, and via political obsessions with ‘small’ government”.

What might a “deep” (5 and 6) radical intervention look like? Changing our future course from one of climate collapse, to a resilient world will “require disruption of [overlooked drivers including] capitalism, colonialism and global inequality”. We should be actively questioning whether economic systems reliant on infinite growth are sustainable on a planet of finite resources, and then propose new systems that prioritise wellbeing and sustainable development within our planetary boundaries [3].

Legal Consent in Activism

Actions like throwing soup on Van Goghs, gluing a hand to a window, daubing institutions in paint may all seem disconnected from the issues protestors wish to highlight. But these actions put the focus on the absurdity of a system that has greater contempt for property damage than the knowing and wilful destruction of nature. A system where economic inequality is rising whilst the wealthiest individuals are the leading driver of emissions [4].

As Greta Thunberg says, “Our house is on fire”. Defending non-violent actions at the Royal Society and Shell’s London Offices, Dr. Hewlett used this metaphor in his closing statement:

“If I smashed a window to drag you from a burning building, most would consent to that damage; Shell has set our house on fire, and when people understand the full extent of their crimes they do not generally object to a splash of paint, they object to the crime of arson. And when scientists come to appreciate our potential to raise the fire alarm, they generally do not object to the non-violent means used to bring them to that understanding, in fact they are often grateful for having their eyes opened. In order to find us guilty, you must be sure that we did not honestly believe they might consent. If we did not honestly believe in consent, why would we even try to mobilise our community?”

Figure 3: Dr. Tim Hewlett after being acquitted from the Royal Society Case – source: Scientist Rebellion

Although the argument of “consent” was successfully used to reach an acquittal in the case of the Royal Society, during the same trial and facing the same jury, Tim was found guilty of a similar protest at Shell [5]. The deliberations of a jury are known only to the jury members, so we cannot know for sure why this conclusion was reached. Tim is currently seeking legal advice. Out of 45 pieces of evidence against Shell only 2 were accepted by the judge (the rest were hidden from the jury). Expert witnesses were denied the opportunity to talk about Shell’s human rights abuses and the company’s failure to align with the Paris agreement.

Had Tim been allowed to make arguments relevant to his protest in the Shell case, it is likely that he would have been found innocent in this case as well.

“From Publications to Public Actions”: How do we accelerate systemic changes?

Given the urgency of climate and ecological emergency, Gardner et al. 2021 suggest that universities must “expand their conception of how they contribute to the public good, and explicitly recognise engagement with advocacy as part of the work mandate of their academic staff”, and outline how work models should be adapted to support this [6].

In the most read Social Metwork blog post of 2021 [7], Gabriel Perez wrote about how our own ways of thinking are influenced by external factors, and therefore there is a need for us to be aware of our roles as scientists across all levels of politics and society. By supporting and even taking part in different forms of protest, scientists can make uniquely important contributions.

It is possible to lend additional credibility to the demands of climate activists by supporting and engaging with movements. This can range from simply signing a letter, to joining in with “low-risk” activities such as talking about these movements with friends and colleagues, joining in with marches, or engaging in outreach activities. We can even join in provocative non-violent direct actions which may pose risk to our liberty (although not everyone is as equally comfortable to do this, with potential visa issues, childcare commitment, and financial struggles being some of the barriers activists may face).

Figure 4: Una rebelión necesaria: Aprill 2022, Scientists take non-violent direct action at the Spanish congress asking for recommendations of the scientific community to become legally binding objectives with institutional mechanisms that guarantee the real participation of citizens – source: rebelioncientifica.es

As scientists, we each have a powerful toolkit to use in activism: we are trained in statistics and comprehension of complicated reports; we present our findings to different audiences; we might have experience publishing, maintaining websites, communicating across sectors, teaching. These are all valuable skills for activists to have, and we have many of them at once!

Climate activists are sometimes depicted as dangerous radicals. But, the truly dangerous radicals are the countries that are increasing the production of fossil fuels. (António Guterres, UN Secretary-General)

Closing thoughts

Climate and ecological collapse pose existential risks to humanity. If we are to avert the worst effects, and place ourselves in a position best able to support the most impacted, then we need to rethink the purpose of our societies.

Taking non-violent direct action sparks controversy, and is shocking. But as a disruptive tactic, it is successful at initiating debate.


[1] Anita Mureithi 2023 “Scrap plans to give cops more power, say women as David Carrick jailed for life” OpenDemocracy news https://www.opendemocracy.net/en/public-order-bill-metropolitan-police-david-carrick-protest

[2] Morrison, T.H., Adger, W.N., Agrawal, A. et al. Radical interventions for climate-impacted systems. Nat. Clim. Chang. 12, 1100–1106 (2022). https://doi.org/10.1038/s41558-022-01542-y

[3] Doughnut Economics Action Lab – About https://doughnuteconomics.org/about-doughnut-economics

[4] Oxfam “Survival Of The Richest: How We Must Tax The Super-Rich Now To Fight Inequality” 2023 https://www.oxfam.ca/publication/davos-report-2023

[5] Rikki Blue, “Listen to the science. Civil disobedience by 1000 scientists.”, Real Media https://realmedia.press/listen-to-the-science

[6] Gardner, C.J, Thierry, A., Rowlandson, W., Steinberger, J.K. From Publications to Public Actions: The Role of Universities in Facilitating Academic Advocacy and Activism in the Climate and Ecological Emergency. Frontiers in Sustainability. 2, 2022. https://doi.org/10.3389/frsus.2021.679019

[7] Gabriel Perez, Climate Science and Power, The Social Metwork https://socialmetwork.blog/2021/11/05/climate-science-and-power