In the tropics, organised convective systems provide the majority of precipitation and are often responsible for extreme events. To understand these systems, researchers now use kilometre-resolution (k-scale) global and regional convection-permitting models, along with the latest satellite observations. Machine learning tools have also emerged as important supplements to our dynamical and thermodynamic understanding.
It’s crucial to understand these tools to address key questions such as:
How do deep and shallow convection organise in k-scale models?
Can energy budgets help explain their precipitation biases?
What are the recent advances in convective parameterisation?
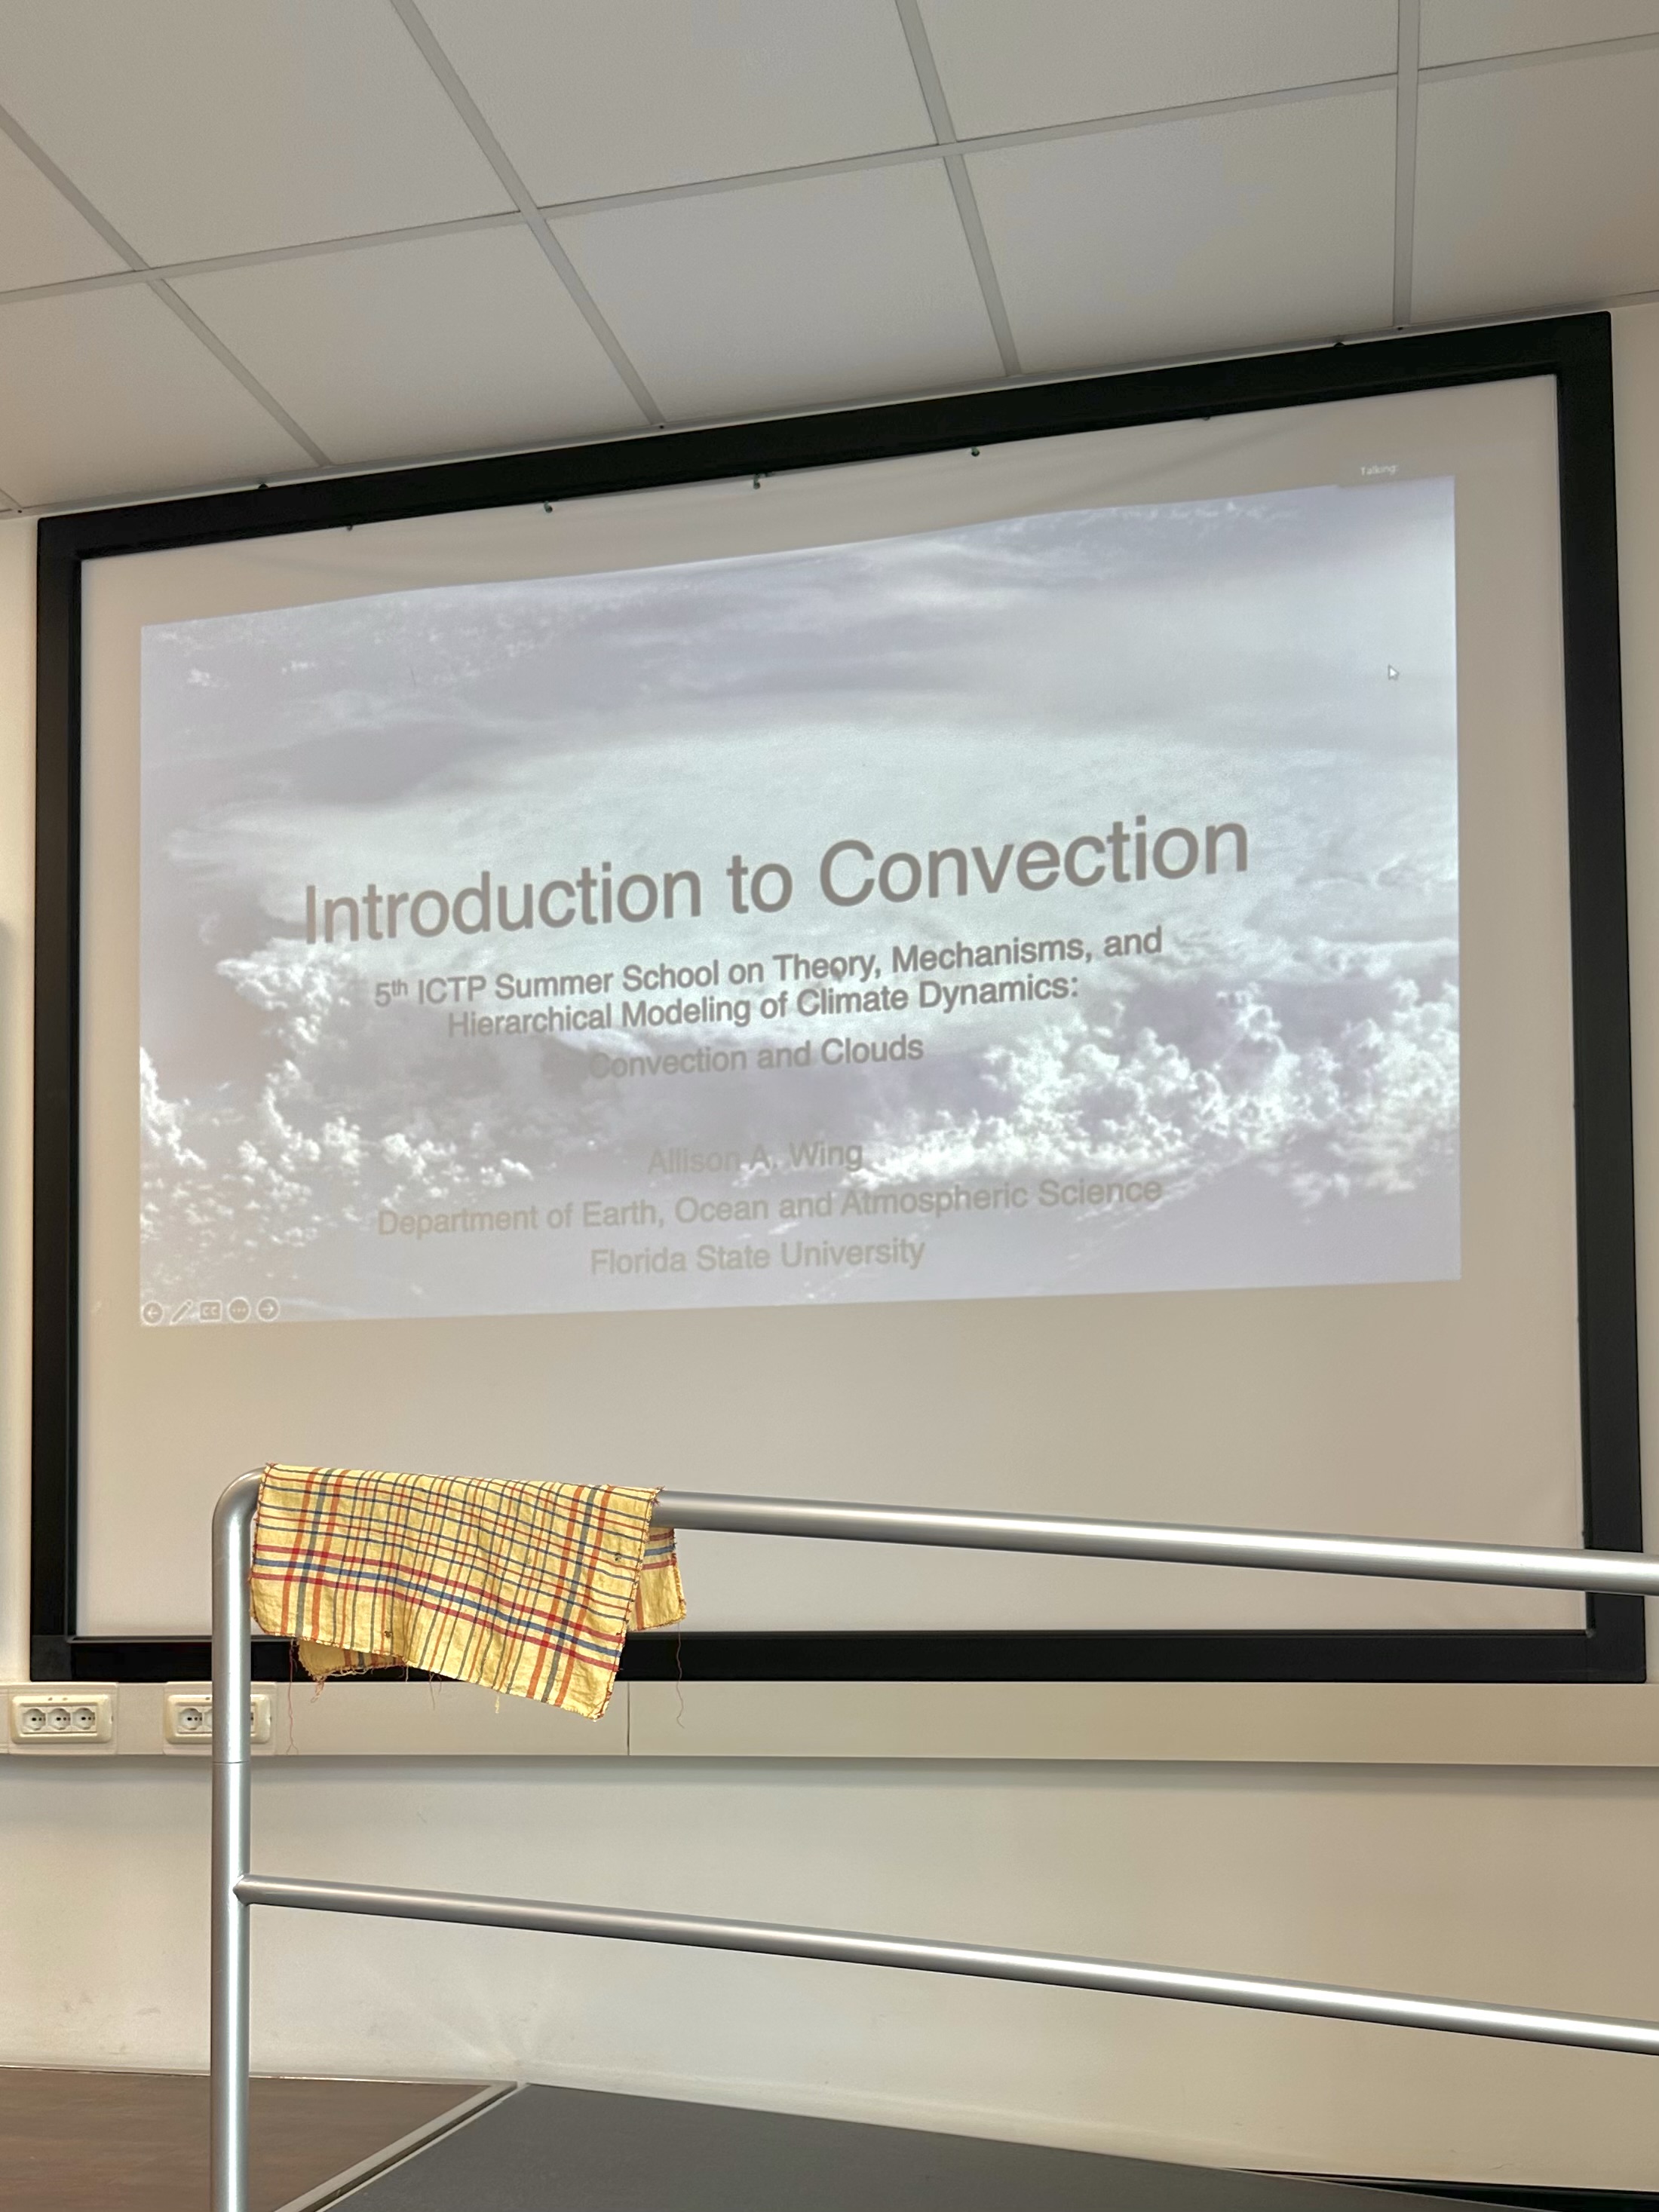
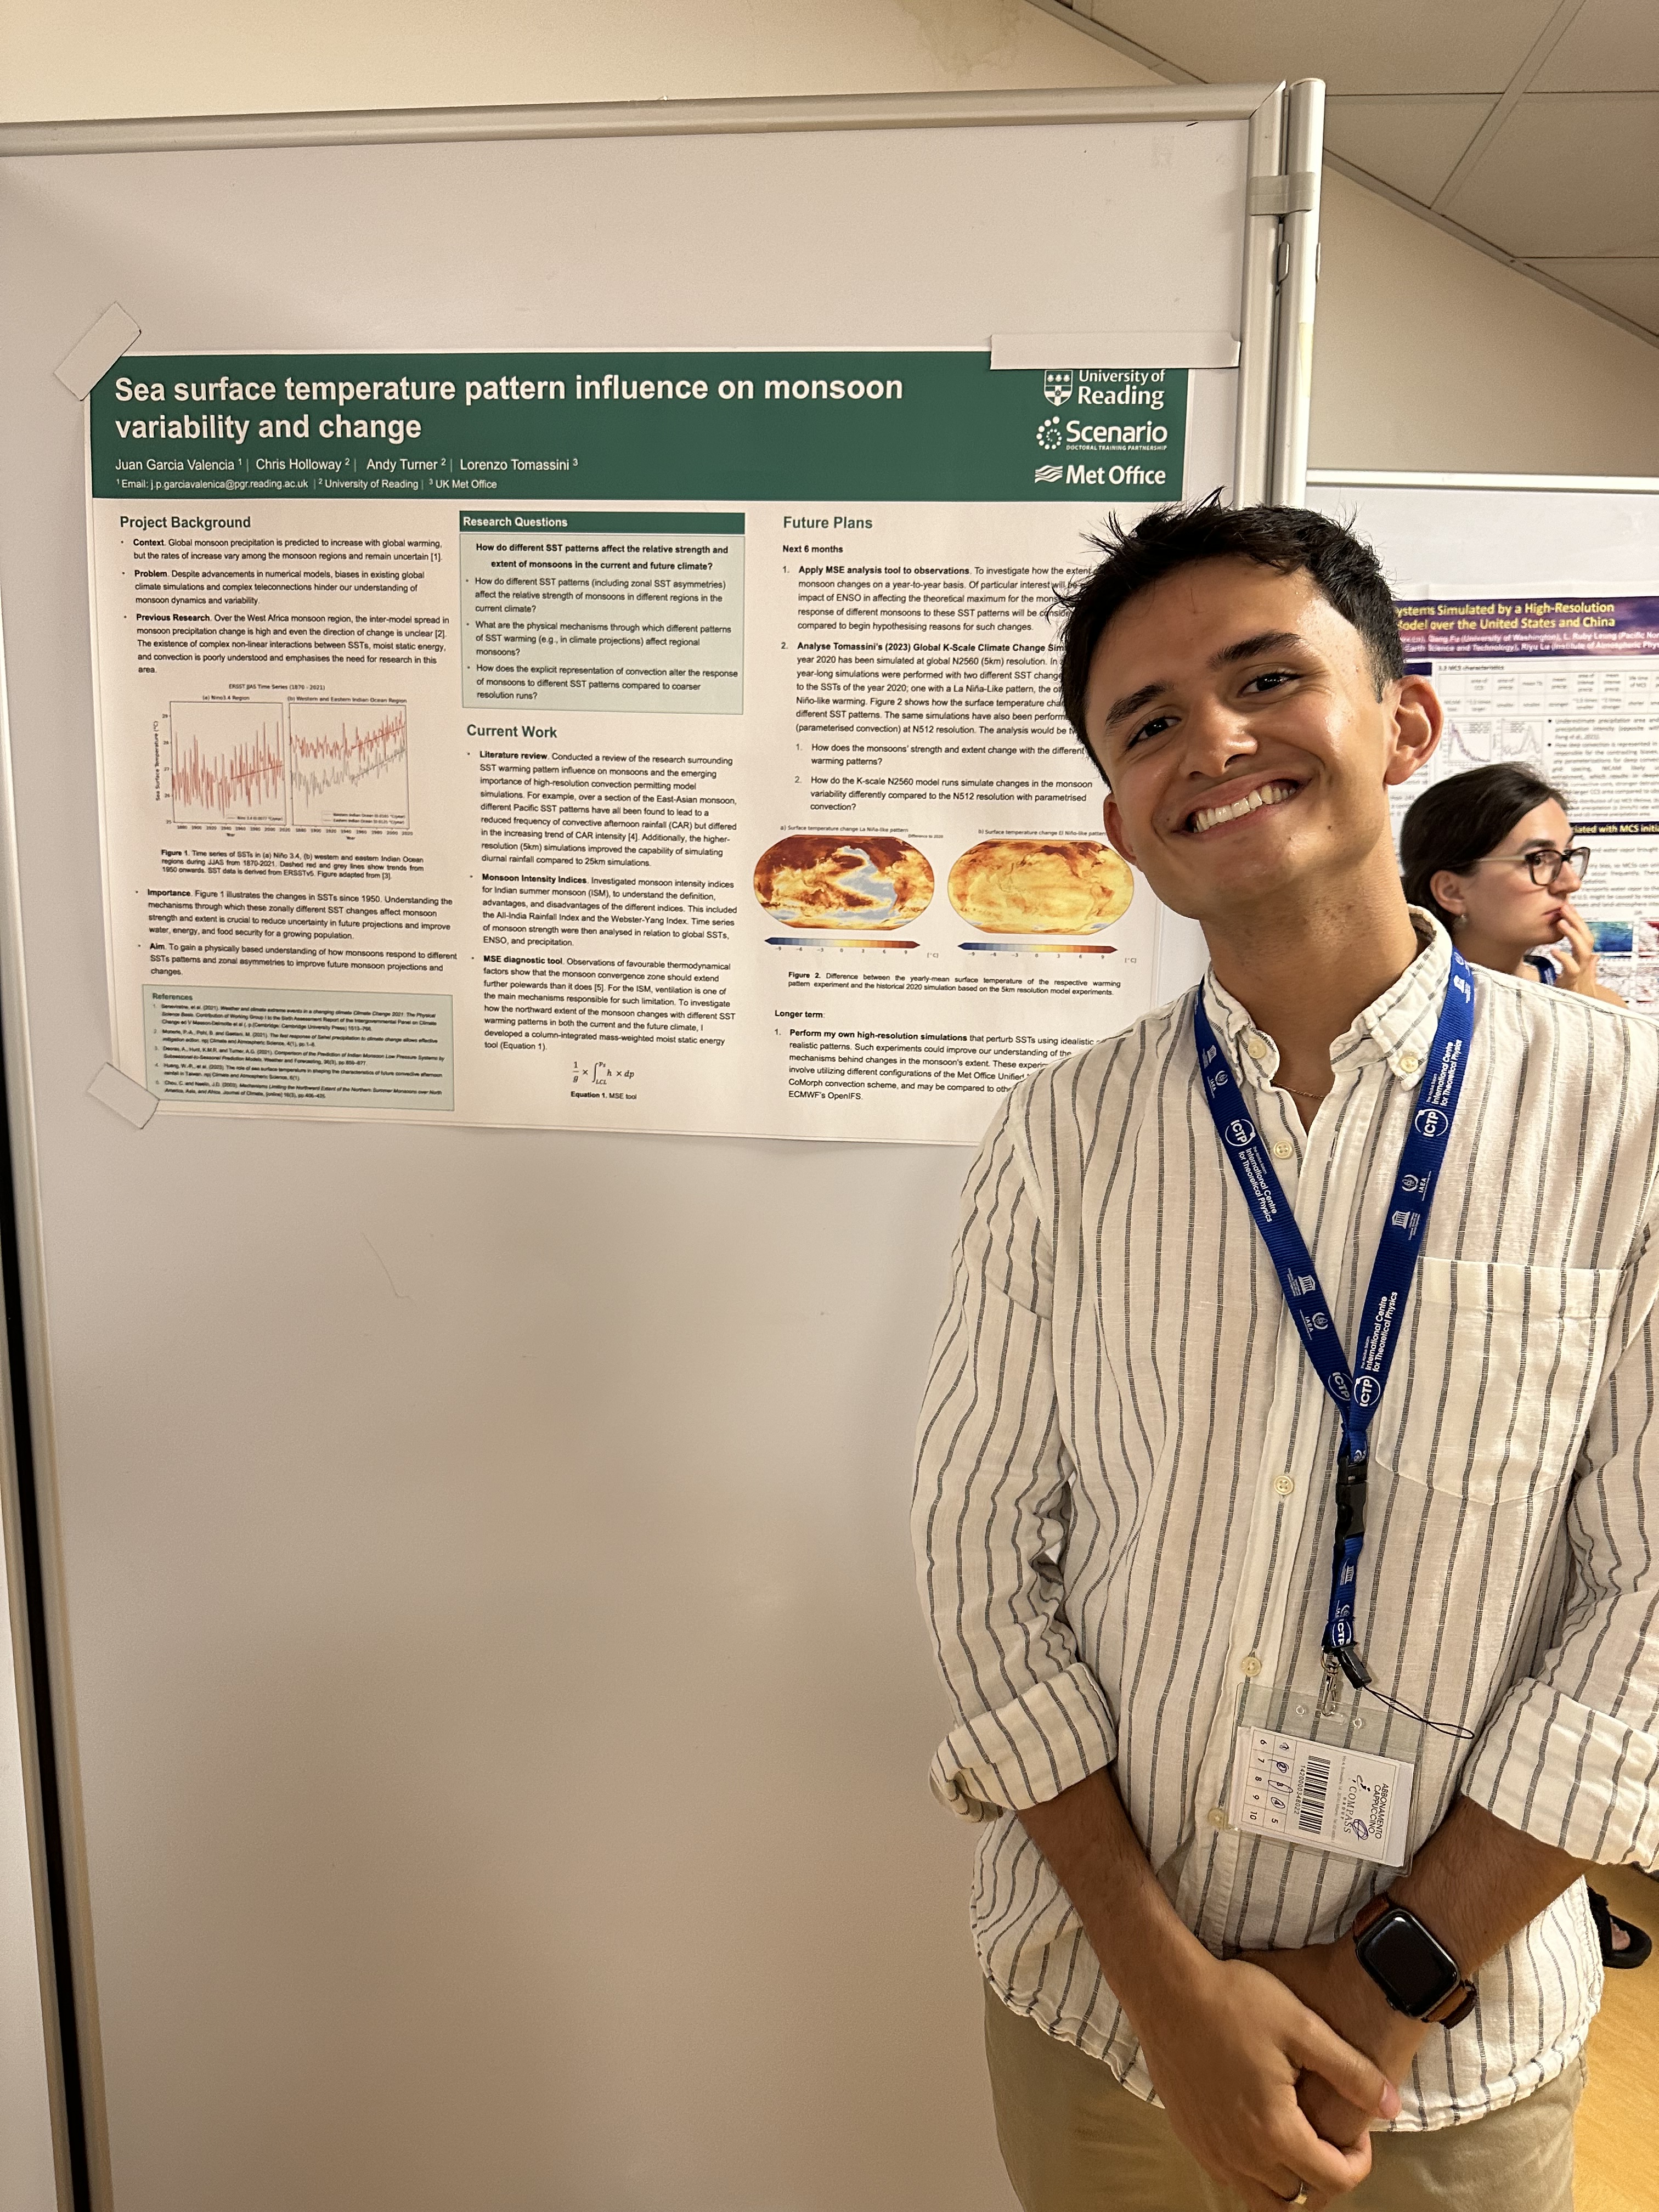
These questions were the focus of the “5th Summer School on Theory, Mechanisms and Hierarchical Modelling of Climate Dynamics: Convection and Clouds,” which I had the privilege of attending from the 1st–19th of July 2024 at the International Centre for Theoretical Physics (ICTP) in Trieste, Italy.
Picture 1 and 2. First lecture and campus.
The program offered a mix of introductory and advanced lectures, hands-on data analysis through participant projects, and the chance to get involved in the “4th Workshop on Convective Organisation and Precipitation Extremes (WCO4).” The opportunity to attend arose because two of my supervisors, Chris Holloway and Lorenzo Tomassini, presented their work at the conference and taught some of the lectures in the course. As a PhD student researching monsoons using kilometre-scale simulations, I also felt like I had to attend!
The three-week schedule was intense, with most days running from 9 AM to 6 PM (thankfully with plenty of coffee breaks and a long lunch). A typical day began with lectures from leading experts like Simona Bordoni, Robert Pincus, and Courtney Schumacher. Topics ranged from convection and radiation to RCE, stochastic parameterisation, and observations. Afternoons were usually dedicated to computer lab sessions or group project work.
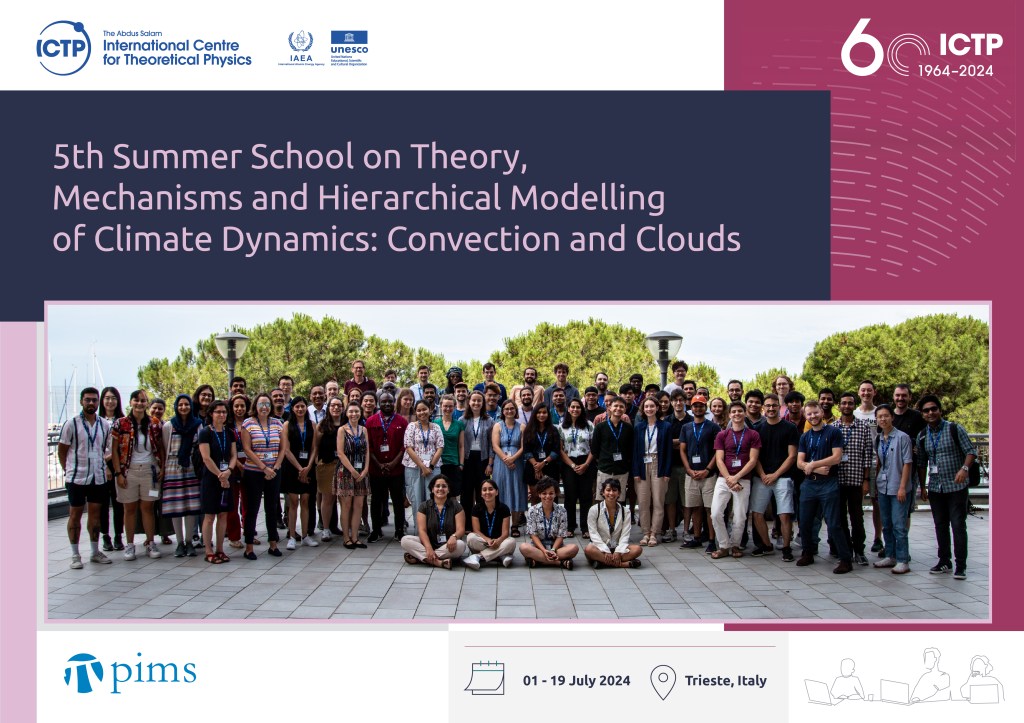
Picture 3. Attendees of the summer school.
The second week centred on the WCO4 conference, covering topics from convective self-aggregation in idealized experiments to precipitation extremes associated with organized convection and optimizing our use of observational data. Students had the opportunity to present posters on their research—an incredibly valuable experience for me as I received loads of useful feedback about my ideas and goals. This was also my first time presenting research at an international event, so it was great to show what I’ve been working on in front of all the attendees and meet so many people genuinely interested in my work.
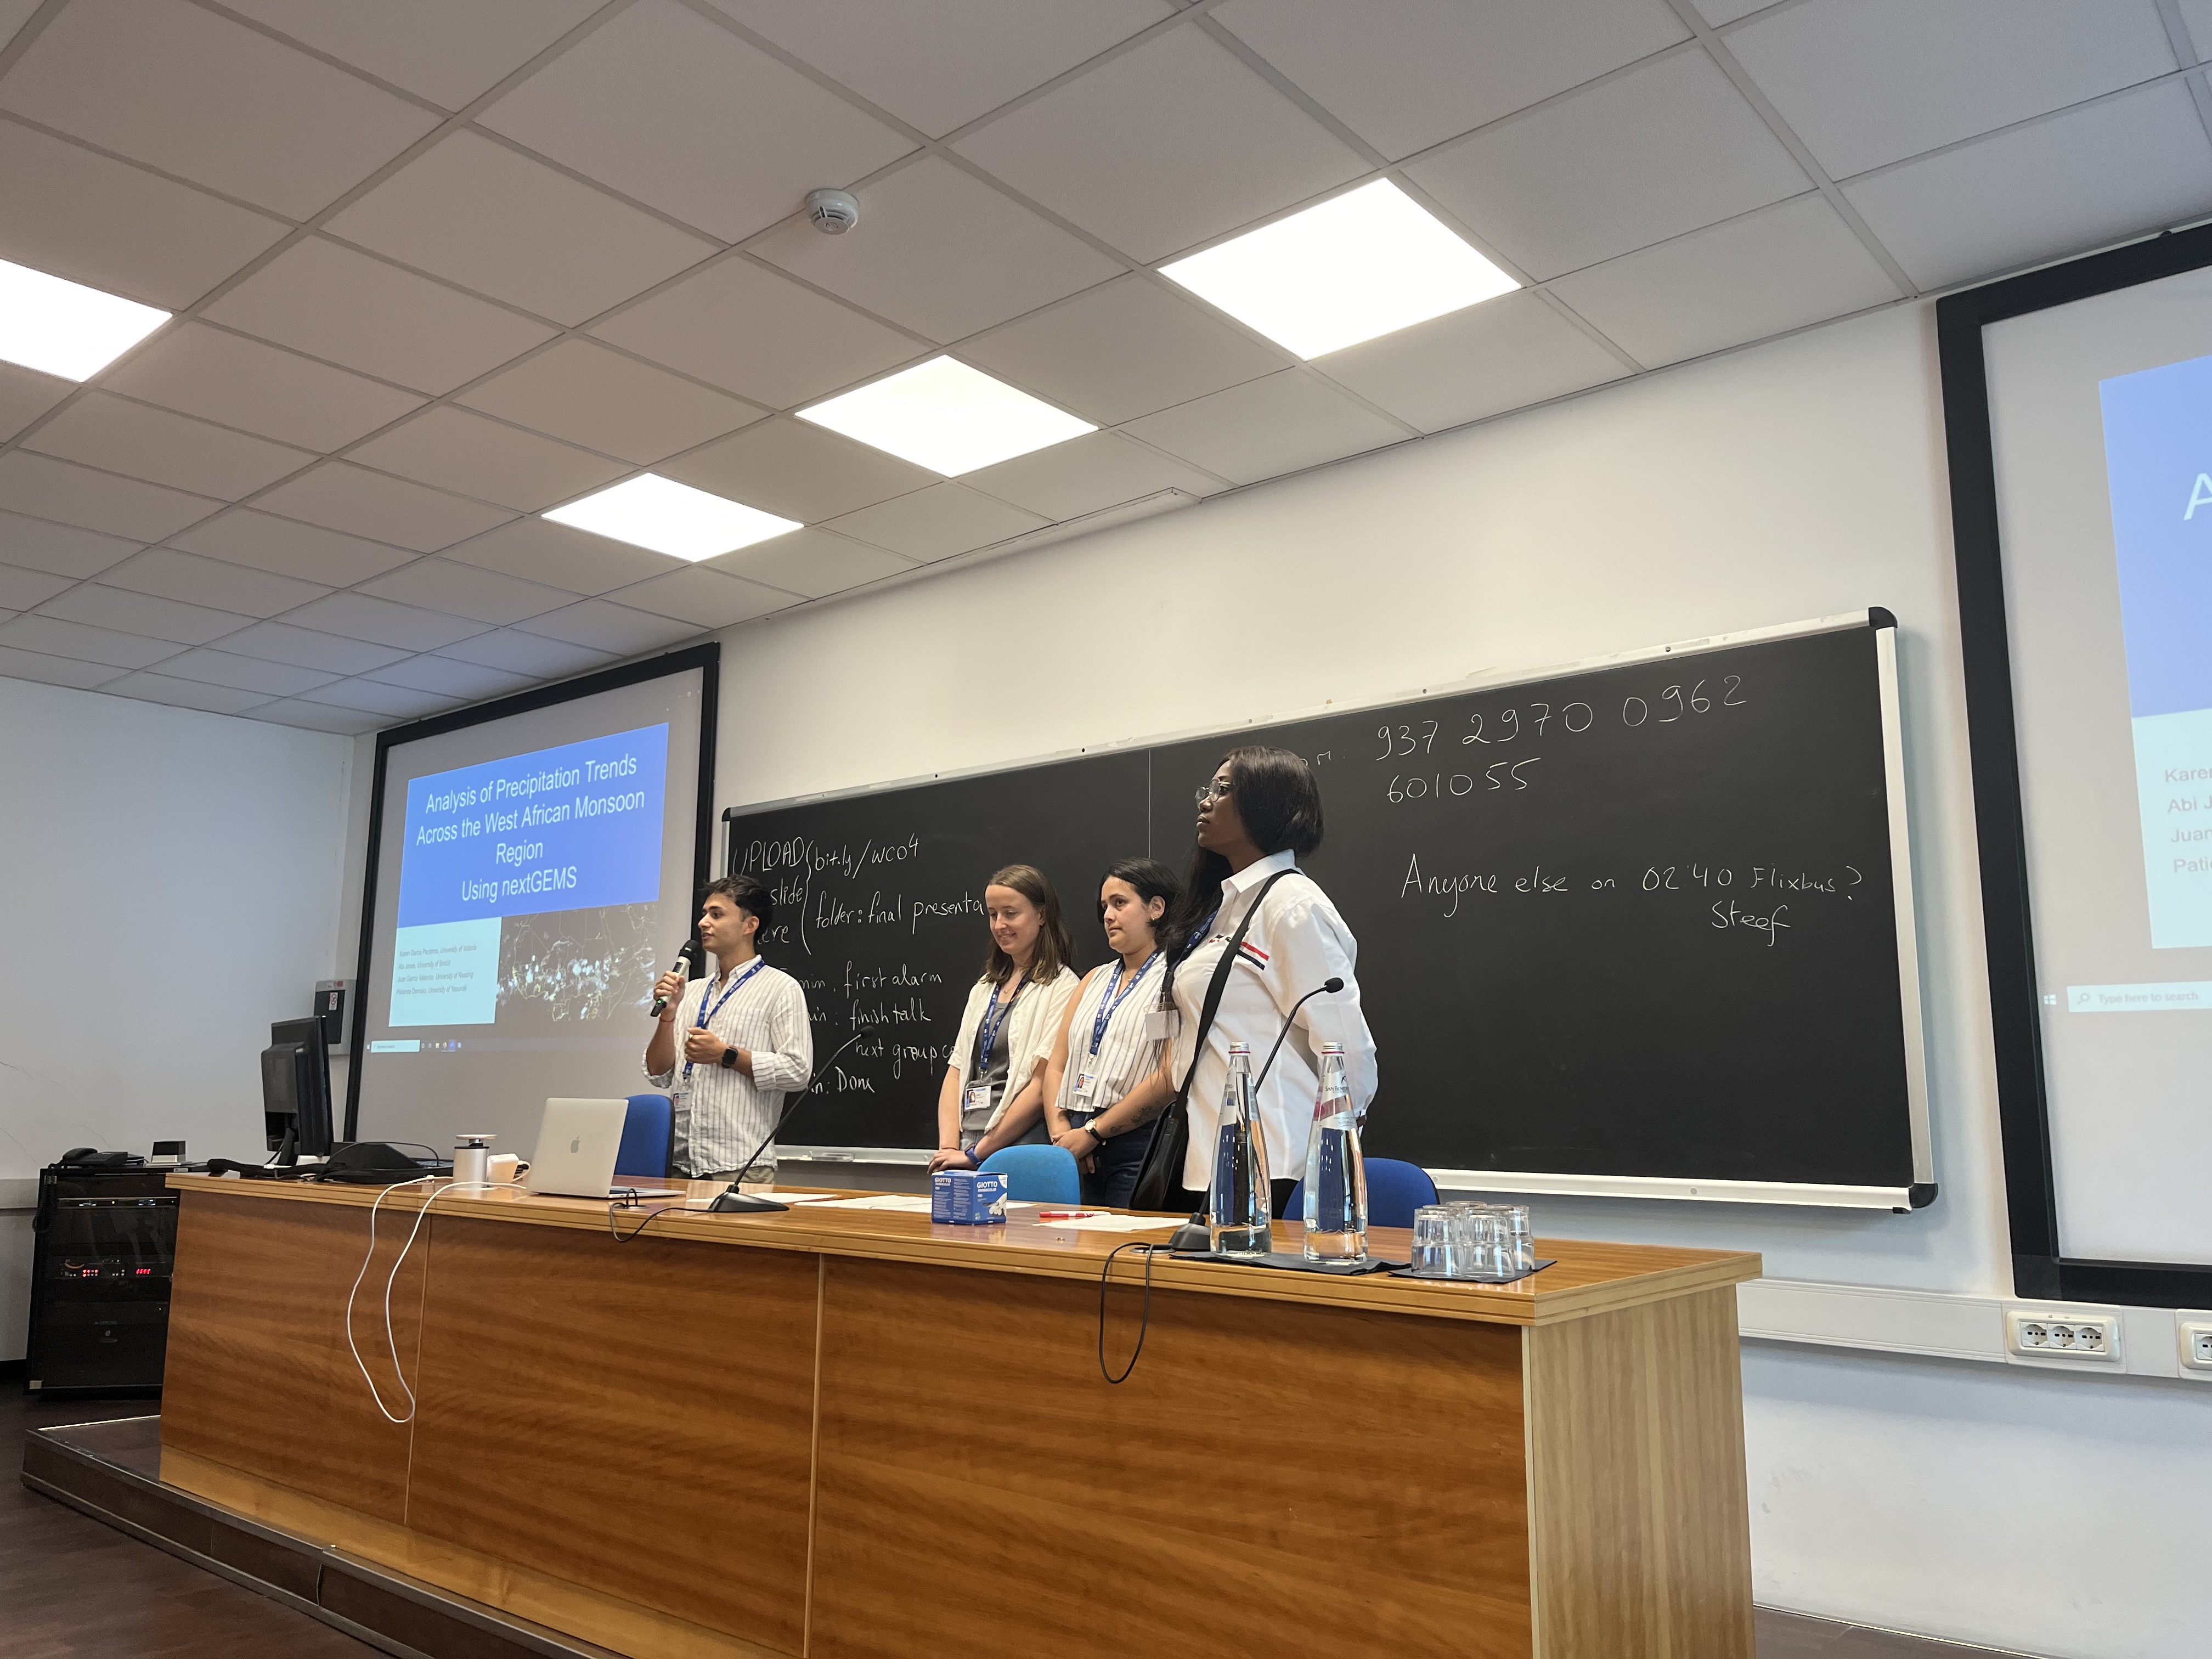
The final week focused on hands-on projects. In groups of 4–5, we analysed numerical model data and presented our results to everyone. My group examined how precipitation extremes change in a warming world using NextGEMS data, but every group had different topics that they had chosen according to their interest and expertise. Many of the tasks and analyses we did were similar to my first-year work, so I left with a plenty of new ideas for my research!
Picture 4. End of group project presentation and poster presentation.
Being an international centre, the school and conference brought together staff and students from all corners of the globe—one of my favourite aspects of the course. Despite knowing no one beforehand, I quickly got to know other PhDs and post-docs from various institutions, all working on projects similar to mine. I felt at ease in this new environment, making friends and meeting potential future colleagues!
Another fantastic aspect of this summer school was its stunning location on Italy’s sunny, warm northern Adriatic coast. After each day’s activities, we were free to spend our evenings as we pleased. This was the perfect opportunity to relax by the sea, swim, and explore Trieste’s picturesque town centre. More often than not, we’d venture into town for pizza and, of course, gelato!
On Tuesday 23rd April 2024, I presented my PhD work at the lunchtime seminar to the department. The work I presented incorporated a lot of the work I have achieved during the 3 and a half years of my PhD. This blog post will be a brief overview of the work discussed.
Every year, between 300 and 4000 million tons of mineral dust are lofted from the Earth’s surface (Huneeus et al., 2011; Shao et al., 2011). This dust can travel vast distances, affecting the Earth’s radiative budget, water and carbon cycles, fertilization of land and ocean surfaces, as well as aviation, among other impacts. Observations from recent field campaigns have revealed that we underestimate the amount of coarse particles (>5 um diameter) which are transported long distances (Ryder et al., 2019). Based on our understanding of gravitational settling, some of these particles should not physically be able to travel as far as they do. This results in an underestimation of these particles in climate models, as well as a bias towards modelling finer particles (Kok et al., 2023). Furthermore, fine particles have different impacts on the Earth than coarse particles, for example with the radiative budget at the top of the atmosphere; including more coarse particles in a model reduces the cooling effect that dust has on the Earth.
Thus, my PhD project was born! We wanted to try and peel back the layers of the dusty onion. How are these coarse particles travelling so far?
Comparing a Climate Model and Observations
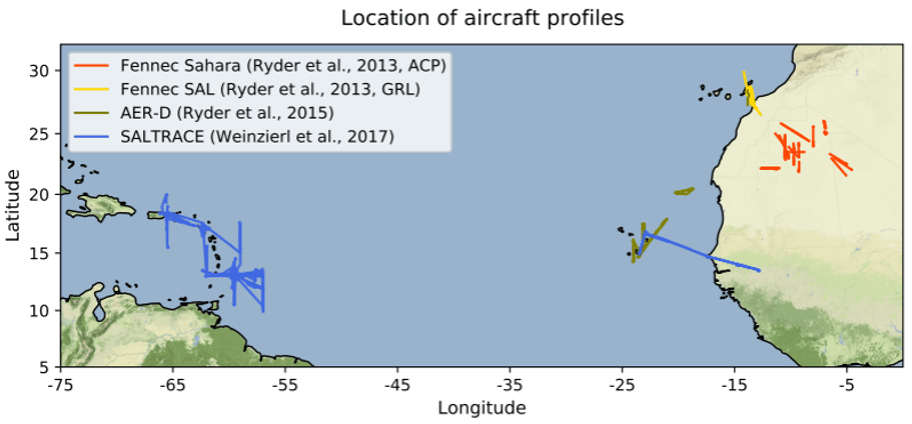
First, we compared in-situ aircraft observations to a climate model simulation to assess the degree to which the model was struggling to represent coarse particle transport from the Sahara across the Atlantic to the Caribbean. Measuring particles up to 300 um in diameter, the Fennec, AER-D and SALTRACE campaigns provide observations at three stages of transport throughout the lifetime of dust in the atmosphere (near emission, moving over the ocean and at distance from the Sahara; Figure 1). Using these observations, we assess a Met Office Unified Model HadGEM3 configuration. This model has six dust size bins, ranging from 0.063-63.2 um diameter. This is a much larger upper bound than most climate models, which tend to have an upper bound at 10-20 um.
Figure 1: Map showing the location of the flight tracks which were taken when the observations were measured.
We found that the model significantly underestimates the total mass of mineral dust in the atmosphere, as well as the fraction of dust mass made up of coarse particles. This happens at all locations, including at the Sahara: firstly, this suggests that the model is not emitting enough coarse particles to begin with and secondly, the growing model underestimation with distance suggests that the coarse particles are being deposited too quickly. By looking further into the model, we found that the coarsest particles (20-63.2 um) were lost from the atmosphere very quickly, barely surpassing Cape Verde in their westwards transport. Whereas in the observations, these coarsest particles were still present at the Caribbean, representing ~20% of the total dust mass. We also found that the distribution of coarse particles tended to have a stronger dependence on altitude than in the observations, with fewer particles observed at higher altitudes. This work has been written up into a paper which is currently undergoing review, but can be seen in preprint; Ratcliffe et al., (preprint).
Sensitivity Testing of the Model
Now that we have confirmed that the model is struggling to retain coarse particles for long- range transport, we want to work out if any of the model processes involved in transport and deposition could be over- or under-active in coarse particle transport. This involved turning off individual processes one at a time and seeing what impact it has on the dust transport. As we wanted to focus on the impact to coarse particle transport, we needed to start with an improved emission distribution at the Sahara, so we tuned the model to better match the observations from the Fennec campaign.
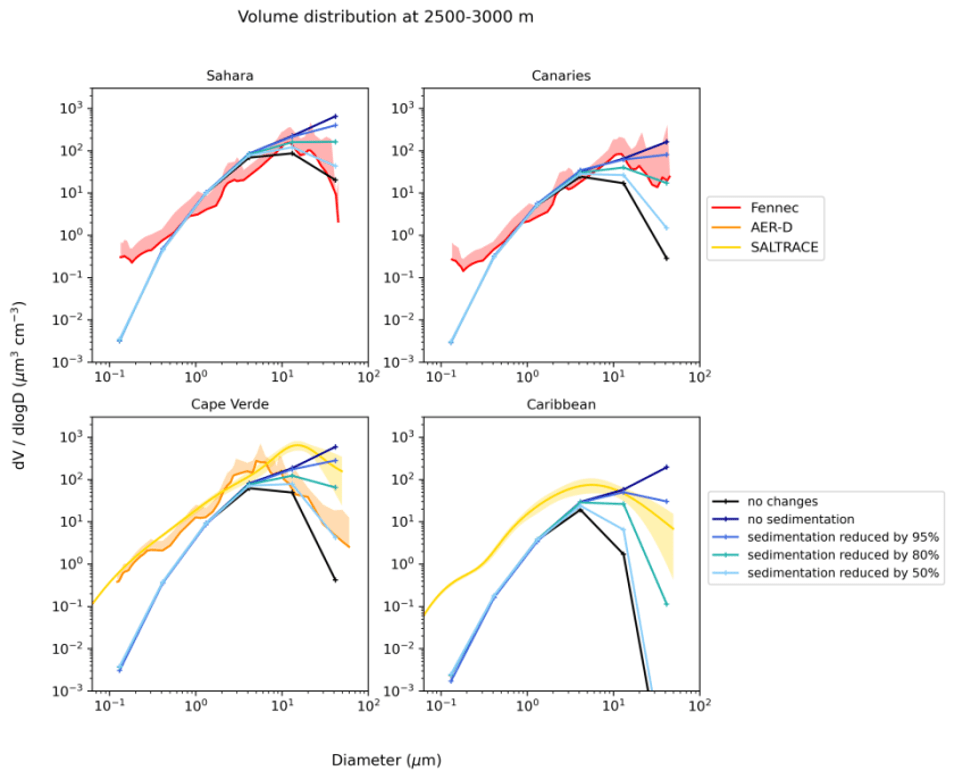
In our first tests we decided to ‘turn off’ or reduce gravitational settling of dust particles in the model to see what happens if we eliminate the greatest removal mechanism for coarse particles. Figure 2 shows the volume size distribution of these gravitational settling model experiments against the observations. We found that completely removing gravitational settling increased the mass of coarse particles too much, while having little to no effect on the fine particles. We found that to bring the model into better agreement with the observations, sedimentation needs to be reduced by ~50% at the Sahara and more than 80% at the Caribbean.
Figure 2: Mean volume size distribution between 2500-3000 m in the Fennec (red), AER-D (orange) and SALTRACE (yellow) observations, the control mode simulation (black) and the reduced dust sedimentation experiments (blue shades).
We also tested the sensitivity of turbulent mixing, convective mixing and wet deposition on coarse dust transport; however, these experiments did not have as great of an impact on coarse transport as the sedimentation. We found that removing the mixing mechanisms resulted in decreased vertical transport of dust which tended to reduce the horizontal transport. We also carried out an experiment where we doubled the convective mixing, and this did show improved vertical and horizontal transport. Finally, when we removed wet deposition of dust, we found that it had a greater impact on the fine particles, less so on the coarse particles, suggesting that wet deposition is the main removal mechanism for the four finest size bins in the model.
Final Experiment
Now that we know our coarse particles are settling out too quickly and sit a bit too low in the atmosphere, we come to our final set of experiments. Let’s say that our coarse particles in the model and our dust scheme are actually set up perfectly, then could it be the meteorology in the model which is wrong? If the coarse particles were mixed higher up at the Sahara, then would they reach faster horizontal winds to travel further across the Atlantic? To test this theory, I hacked the files which the model uses to start a simulation, and I put all the dust over the Sahara up to the top of the dusty layer (~5 km). We found this increased the lifetime of the coarsest particles so that it took twice as long to lose 50% of the starting mass. This unfortunately only slightly improved transport distance as the particles were still lost relatively quickly. After checking the vertical winds in the model, we found that they were an order of magnitude smaller at the Sahara, Canaries and Cape Verde than the observations made during the field campaigns. This suggests that if the vertical winds were stronger, they could initially raise the dust higher and keep the coarse particles raised higher for longer, extending their atmospheric lifetime.
Summarised Conclusions
To summarise what I’ve found during my PhD:
The model underestimates coarse mass at emission and the underestimation is exacerbated with westwards transport.
Altering the settling velocity of dust in the model brings the model into better agreement with the observations.
a. Turbulent mixing, convective mixing and wet deposition have minimal impact on coarse transport.
Lofting the coarse particles higher initially improves transport minimally.
a. Vertical winds in the model are an order of magnitude too small.
So what’s next?
If we’ve found that the coarse particles are settling out the atmosphere too quickly (by potentially more than 80%), would that suggest that the deposition equations are wrong and are overestimating particle deposition? So, we change those and everything’s fixed, right? I wish. Unfortunately, the deposition equations are one of the things that we are more scientifically sure of, so our results mean that there’s something happening to the coarse particles that we aren’t modelling which is able to counteract their settling velocity by a very significant amount. Our finding that the vertical winds are too small could be a part of this. Other recent research suggests that processes such as particle asphericity, triboelectrification, vertical mixing and turbulent mixing (has been shown to help in a higher-resolution (not climate) model) in the atmosphere could enhance coarse particle transport.
Huneeus, N., Schulz, M., Balkanski, Y., Griesfeller, J., Prospero, J., Kinne, S., Bauer, S., Boucher, O., Chin, M., Dentener, F., Diehl, T., Easter, R., Fillmore, D., Ghan, S., Ginoux, P., Grini, A., Horowitz, L., Koch, D., Krol, M. C., Landing, W., Liu, X., Mahowald, N., Miller, R., Morcrette, J.-J., Myhre, G., Penner, J., Perlwitz, J., Stier, P., Takemura, T., and Zender, C. S. 2011. Global dust model intercomparison in AeroCom phase I. Atmospheric Chemistry and Physics. 11(15), pp. 7781-7816
Kok, J. F., Storelvmo, T., Karydis, V. A., Adebiyi, A. A., Mahowald, N. M., Evan, A. T., He, C., and Leung, D. M. Jan. 2023. Mineral dust aerosol impacts on global climate and climate change. Nature Reviews Earth Environment 2023, pp. 1–16. url: https://www.nature.com/articles/s43017-022-00379-5
RatcliLe, N. G., Ryder, C. L., Bellouin, N., Woodward, S., Jones, A., Johnson, B., Weinzierl, B., Wieland, L.-M., and Gasteiger, J.: Long range transport of coarse mineral dust: an evaluation of the Met Office Unified Model against aircraft observations, EGUsphere [preprint], https://doi.org/10.5194/egusphere-2024-806, 2024
Ryder, C. L., Highwood, E. J., Walser, A., Seibert, P., Philipp, A., and Weinzierl, B. 2019. Coarse and giant particles are ubiquitous in Saharan dust export regions and are radiatively significant over the Sahara. Atmospheric Chemistry and Physics. 19(24), pp. 15353–15376
Shao, Y., Wyrwoll, K.-H., Chappell, A., Huang, J., Lin, Z., McTainsh, G. H., Mikami, M., Tanaka, T. Y., Wang, X., and Yoon, S. 2011. Dust cycle: An emerging core theme in Earth system science. Aeolian Research. 2(4), pp. 181–204
To date, the 2020 North Atlantic hurricane season has been the most active on record, producing 20 named storms, 7 hurricanes, and a major hurricane which caused $9 billion in damages across the southern United States. With the potential for such destructive storms, it is understandable that a large amount of attention is paid to the North Atlantic basin at this time of year. Whilst hurricanes have been known to cause devastation in the tropics for centuries, until recently there was little appreciation for the destructive potential of these systems across Europe.
As tropical cyclones such as hurricanes move poleward – away from the tropics and into regions of lower sea surface temperatures and higher vertical wind shear, they undergo a process called extratropical transition (Klein et al., 2000): Over a period of time, the cyclones change from symmetric, warm cored systems into asymmetric cold core systems fuelled by horizontal temperature gradients, as opposed to latent heat fluxes (Evans et al., 2017). These systems, so-called post-tropical cyclones (PTCs), often reintensify in the mid-latitude Atlantic with consequences for land masses downstream – often Europe. This was highlighted in 2017, when ex-hurricane Ophelia impacted Ireland, bringing with it the strongest winds Ireland had seen in 50 years (Stewart, 2018). 3 people were killed, and 360,000 homes were without power.
In a recent paper, we quantify the risk associated with PTCs across Europe relative to mid-latitude cyclones (MLCs) for the first time – in terms of both the absolute risk (i.e. what fraction of high impact wind events across Europe are caused by PTCs?) and also the relative risk (for a given PTC, how likely is it to be associated with high-impact winds, and how does this compare to a given MLC?). By tracking all cyclones impacting a European domain (36-70N, 10W-30E) in the ERA5 reanalysis (1979-2017) using a feature tracking algorithm (Hodges, 1994, 1995, 1999), we identify the post-tropical cyclones using spatiotemporal matching (Hodges et al., 2017) with the observational record, IBTrACS (Knapp et al., 2010).
Figure 1: Distributions of the maximum intensity (maximum wind speed, minimum MSLP) attained by each PTC and MLC inside (a-c) the whole European domain (36-70N, 10W-30E), (d-f) the Northern Europe domain (48-70N, 10W-30E) and (g-i) the Southern Europe domain (36-48N, 10W-30E), using cyclones tracked through the ERA5 reanalysis all year round, 1979-2017. [Figure 2 in Sainsbury et al. 2020].
Figure 1 shows the distributions of maximum intensity for PTCs and MLCs across the entire European domain (top), Northern Europe (48-70°N, 10°W-30°E; middle) and Southern Europe (36-48°N, 10°W-30°E; bottom), using all cyclone tracks all year round. The distribution of PTC maximum intensities is higher (in terms of both wind speed and MSLP) than MLCs, particularly across Northern Europe. The difference between the maximum intensity distributions of PTCs and MLCs across Northern Europe is statistically significant (99%). PTCs are also present in the highest of intensity bins, indicating that the strongest PTCs have intensities comparable to strong wintertime MLCs.
Whilst Figure 1 shows that PTCs are stronger than MLCs even when considering MLCs forming all year round (including the often much stronger wintertime MLCs), it is also useful to compare the risks posed by PTCs relative to MLCs forming at the same time of the year – during the North Atlantic hurricane season (June 1st-November 30th).
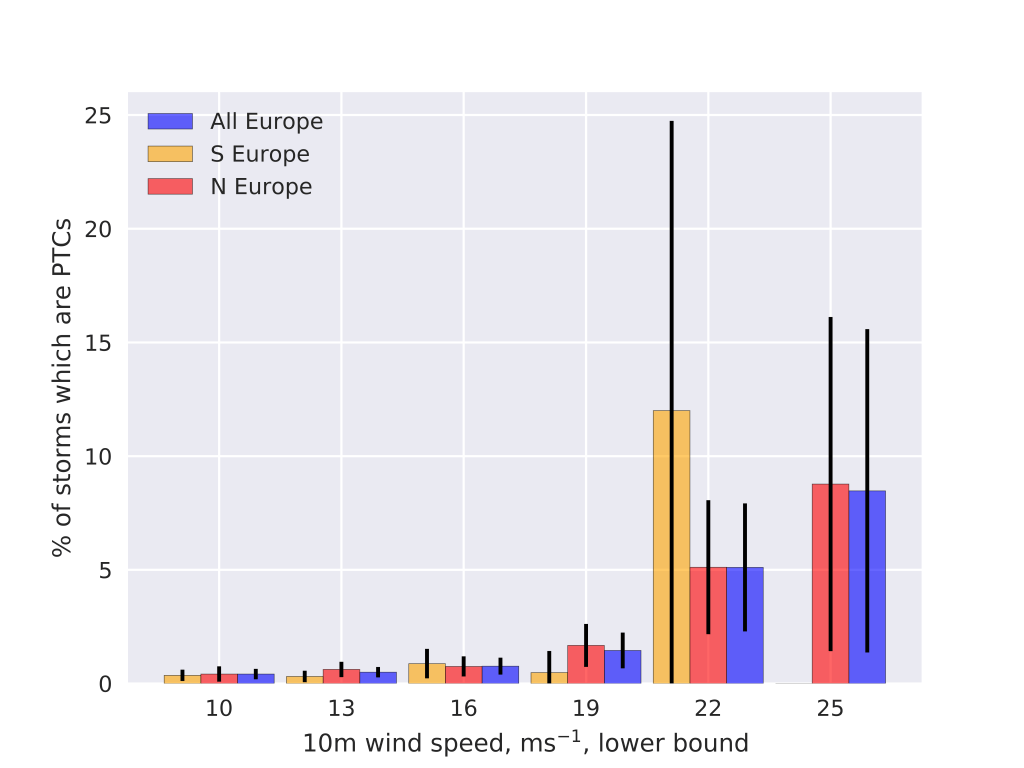
Figure 2 shows the fraction of all storms, binned by their maximum intensity in their respective domains, which are PTCs. For storms with weak-moderate maximum winds (first three bins in the figure), <1% of such events are caused by PTCs (with the remaining 99% caused by MLCs). For stronger storms, particularly those of storm force (>25 ms-1 on the Beaufort scale), this percentage is much higher. Despite less than 1% of all storms impacting Northern Europe during hurricane season being PTCs, almost 9% of all storms with storm-force winds which impact the region are PTCs, suggesting that a disproportionate fraction of high-impact windstorms are PTCs. 8.2% of all Northern Europe impacting PTCs which form during hurricane season impact the region with storm-force winds. This fraction is only 0.8% for MLCs, suggesting that the fraction of PTCs impacting Northern Europe with storm-force winds is approximately 10 times greater than MLCs.
Figure 2: The fraction of cyclones impacting Europe which are PTCs as a function of their maximum 10m wind speed in their respective domain. Lower bound of wind speed is shown on the x axis, bin width = 3. Error bars show the 95% confidence interval. All cyclone tracks forming during the North Atlantic hurricane season are used. [Figure 4 in Sainsbury et al. 2020].
Here we have shown that PTCs, at their maximum intensity over Northern Europe, are stronger than MLCs. However, the question still remains as to why this is the case. Warm-seclusion storms post-extratropical transition have been shown to have the fastest rates of reintensification (Kofron et al., 2010) and typically have the lowest pressures upon impacting Europe (Dekker et al., 2018). Given the climatological track that PTCs often take over the warm waters of the Gulf stream, along with the contribution of both baroclinic instability and latent heat release for warm-seclusion development (Baatsen et al., 2015), one hypothesis may be that PTCs are more likely to develop into warm seclusion storms than the broader class of mid-latitude cyclones, potentially explaining the disproportionate impacts they cause across Europe. This will be the topic of future work.
Despite PTCs disproportionately impacting Europe with high intensities, they are a relatively small component of the total cyclone risk in the current climate. However, only small changes are expected in MLC number and intensity under RCP 4.5 (Zappa et al., 2013). Conversely, the number of hurricane-force (>32.6 ms-1) storms impacting Norway, the North Sea and the Gulf of Biscay has been projected to increases by a factor of 6.5, virtually all of which originate in the tropics (Haarsma et al., 2013). Whilst the absolute contribution of PTCs to hurricane season windstorm risk is currently low, PTCs may make an increasingly significant contribution to European windstorm risk in a future climate.
Sainsbury, E. M., R. K. H. Schiemann, K. I. Hodges, L. C. Shaffrey, A. J. Baker, K. T. Bhatia, 2020: How Important Are Post‐Tropical Cyclones for European Windstorm Risk? Geophysical Research Letters, 47(18), e2020GL089853, https://doi.org/10.1029/2020GL089853
References
Baatsen, M., Haarsma, R. J., Van Delden, A. J., & de Vries, H. (2015). Severe Autumn storms in future Western Europe with a warmer Atlantic Ocean. Climate Dynamics, 45, 949–964. https://doi.org/10.1007/s00382-014-2329-8
Dekker, M. M., Haarsma, R. J., Vries, H. de, Baatsen, M., & Delden, A. J. va. (2018). Characteristics and development of European cyclones with tropical origin in reanalysis data. Climate Dynamics, 50(1), 445–455. https://doi.org/10.1007/s00382-017-3619-8
Evans, C., Wood, K. M., Aberson, S. D., Archambault, H. M., Milrad, S. M., Bosart, L. F., et al. (2017). The extratropical transition of tropical cyclones. Part I: Cyclone evolution and direct impacts. Monthly Weather Review, 145(11), 4317–4344. https://doi.org/10.1175/MWR-D-17-0027.1
Haarsma, R. J., Hazeleger, W., Severijns, C., De Vries, H., Sterl, A., Bintanja, R., et al. (2013). More hurricanes to hit western Europe due to global warming. Geophysical Research Letters, 40(9), 1783–1788. https://doi.org/10.1002/grl.50360
Hodges, K., Cobb, A., & Vidale, P. L. (2017). How well are tropical cyclones represented in reanalysis datasets? Journal of Climate, 30(14), 5243–5264. https://doi.org/10.1175/JCLI-D-16-0557.1
Klein, P. M., Harr, P. A., & Elsberry, R. L. (2000). Extratropical transition of western North Pacific tropical cyclones: An overview and conceptual model of the transformation stage. Weather and Forecasting, 15(4), 373–395. https://doi.org/10.1175/1520-0434(2000)015<0373:ETOWNP>2.0.CO;2
Knapp, K. R., Kruk, M. C., Levinson, D. H., Diamond, H. J., & Neumann, C. J. (2010). The international best track archive for climate stewardship (IBTrACS). Bulletin of the American Meteorological Society, 91(3), 363–376. https://doi.org/10.1175/2009BAMS2755.1
Kofron, D. E., Ritchie, E. A., & Tyo, J. S. (2010). Determination of a consistent time for the extratropical transition of tropical cyclones. Part I: Examination of existing methods for finding “ET Time.” Monthly Weather Review, 138(12), 4328–4343. https://doi.org/10.1175/2010MWR3180.1
Stewart, S. R. (2018). Tropical Cyclone Report: Hurricane Ophelia. National Hurricane Center, (February), 1–32. https://doi.org/AL142016
Zappa, G., Shaffrey, L. C., Hodges, K. I., Sansom, P. G., & Stephenson, D. B. (2013). A multimodel assessment of future projections of North Atlantic and European extratropical cyclones in the CMIP5 climate models. Journal of Climate, 26(16), 5846–5862. https://doi.org/10.1175/JCLI-D-12-00573.1
It is often useful to know how much energy is available to generate motion in the atmosphere, for example in storm tracks or tropical cyclones. To this end, Lorenz (1955) developed the theory of Available Potential Energy (APE), which defines the part of the potential energy in the atmosphere that could be converted into kinetic energy.
To calculate the APE of the atmosphere, we first find the minimum total potential energy that could be obtained by adiabatic motion (no heat exchange between parcels of air). The atmospheric setup that gives this minimum is called the reference state. This is illustrated in Figure 1: in the atmosphere on the left, the denser air will move horizontally into the less dense air, but in the reference state on the right, the atmosphere is stable and no motion would occur. No further kinetic energy is expected to be generated once we reach the reference state, and so the APE of the atmosphere is its total potential energy minus the total potential energy of the reference state.
Figure 1: Construction of the APE reference state for a 2D atmosphere. The purple shading indicates the density of the air; darker colours mean denser air. In the actual state, the density stratification is not completely horizontal, which leads to the air motion shown by the orange arrows. The reference state has a stable, horizontal density stratification, so the air will not move without some disturbance.
If we think about an atmosphere that only varies in the vertical direction, it is easy to find the reference state if the atmosphere is dry. We assume that the atmosphere consists of a number of air parcels, and then all we have to do is place the parcels in order of increasing potential temperature with height. This ensures that density decreases upwards, so we have a stable atmosphere.
However, if we introduce water vapour into the atmosphere, the situation becomes more complicated. When water vapour condenses, latent heat is released, which increases the temperature of the air, decreasing its density. One moist air parcel can be denser than another at a certain height, but then less dense if they are lifted to a height where the first parcel condenses but the second one does not. The moist reference state therefore depends on the exact method used to sort the parcels by their density.
It is possible to find the rearrangement of the moist air parcels that gives the minimum possible total potential energy, using the Munkres (1957) sorting algorithm, but this takes a very long time for a large number of parcels. Lots of different sorting algorithms have therefore been developed that try to find an approximate moist reference state more quickly (the different types of algorithms are explained by Stansifer (2017) and Harris and Tailleux (2018)). However, these sorting algorithms do not try to analyse whether the parcel movements they are simulating could actually happen in the real atmosphere—for example, many work by lifting all parcels to a fixed level in the atmosphere, without considering whether the parcels could feasibly move there—and there has been little understanding of whether the reference states they find are accurate.
As part of my PhD, I have performed the first assessment of these sorting algorithms across a wide range of atmospheric data, using over 3000 soundings from both tropical island and mid-latitude continental locations (Harris and Tailleux, 2018). This showed that whilst some of the sorting algorithms can provide a good estimate of the minimum potential energy reference state, others are prone to computing a rearrangement that actually has a higher potential energy than the original atmosphere.
We also showed that a new algorithm, which does not rely on sorting procedures, can calculate APE with comparable accuracy to the sorting algorithms. This method finds a layer of near-surface buoyant parcels, and performs the rearrangement by lifting the layer upwards until it is no longer buoyant. The success of this method suggests that we do not need to rely on possibly unphysical sorting algorithms to calculate moist APE, but that we can move towards approaches that consider the physical processes generating motion in a moist atmosphere.
References
Harris, B. L. and R. Tailleux, 2018: Assessment of algorithms for computing moist available potential energy. Q. J. R. Meteorol. Soc., 144, 1501–1510, https://doi.org/10.1002/qj.3297
Munkres, J., 1957: Algorithms for the Assignment and Transportation Problems. J. Soc. Ind. Appl. Math., 5, 32–38, https://doi.org/10.1137/0105003
Stansifer, E. M., P. A. O’Gorman, and J. I. Holt, 2017: Accurate computation of moist available potential energy with the Munkres algorithm. Q. J. R. Meteorol. Soc., 143, 288–292, https://doi.org/10.1002/qj.2921
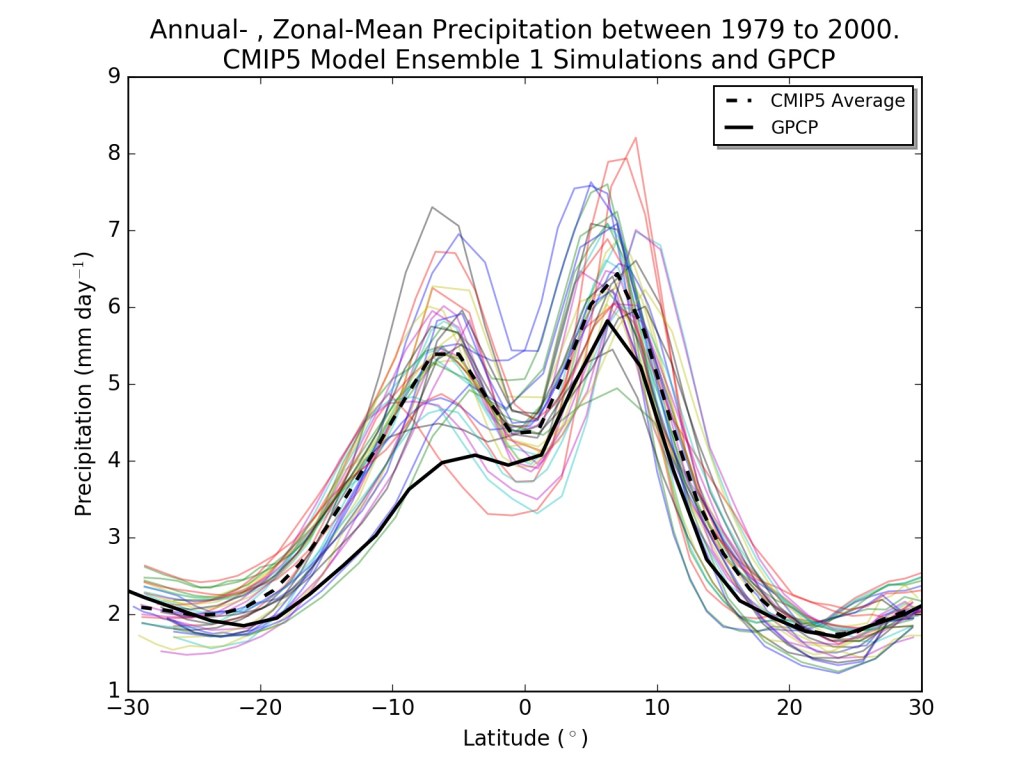
Rainfall in the tropics is commonly associated with the Intertropical Convergence Zone (ITCZ), a discontinuous line of convergence collocated at the ascending branch of the Hadley circulation, where strong moist convection leads to high rainfall. What controls the location and intensity of the ITCZ remains a fundamental question in climate science.
Figure 1: Annual-mean, zonal-mean tropical precipitation (mm day-1) from Global Precipitation Climatology Project (GPCP, observations, solid black line) and CMIP5 (current coupled models) output. Dashed line indicates CMIP5 ensemble mean.
In current and previous generations of climate models, the ITCZ is too intense in the Southern Hemisphere, resulting in two annual-mean, zonal-mean tropical precipitation maxima, one in each hemisphere (Figure 1). Even if we take the same atmospheric models and couple them to a world with only an ocean surface (aquaplanets) with prescribed sea surface temperatues (SSTs), different models simulate different ITCZs (Blackburn et al., 2013).
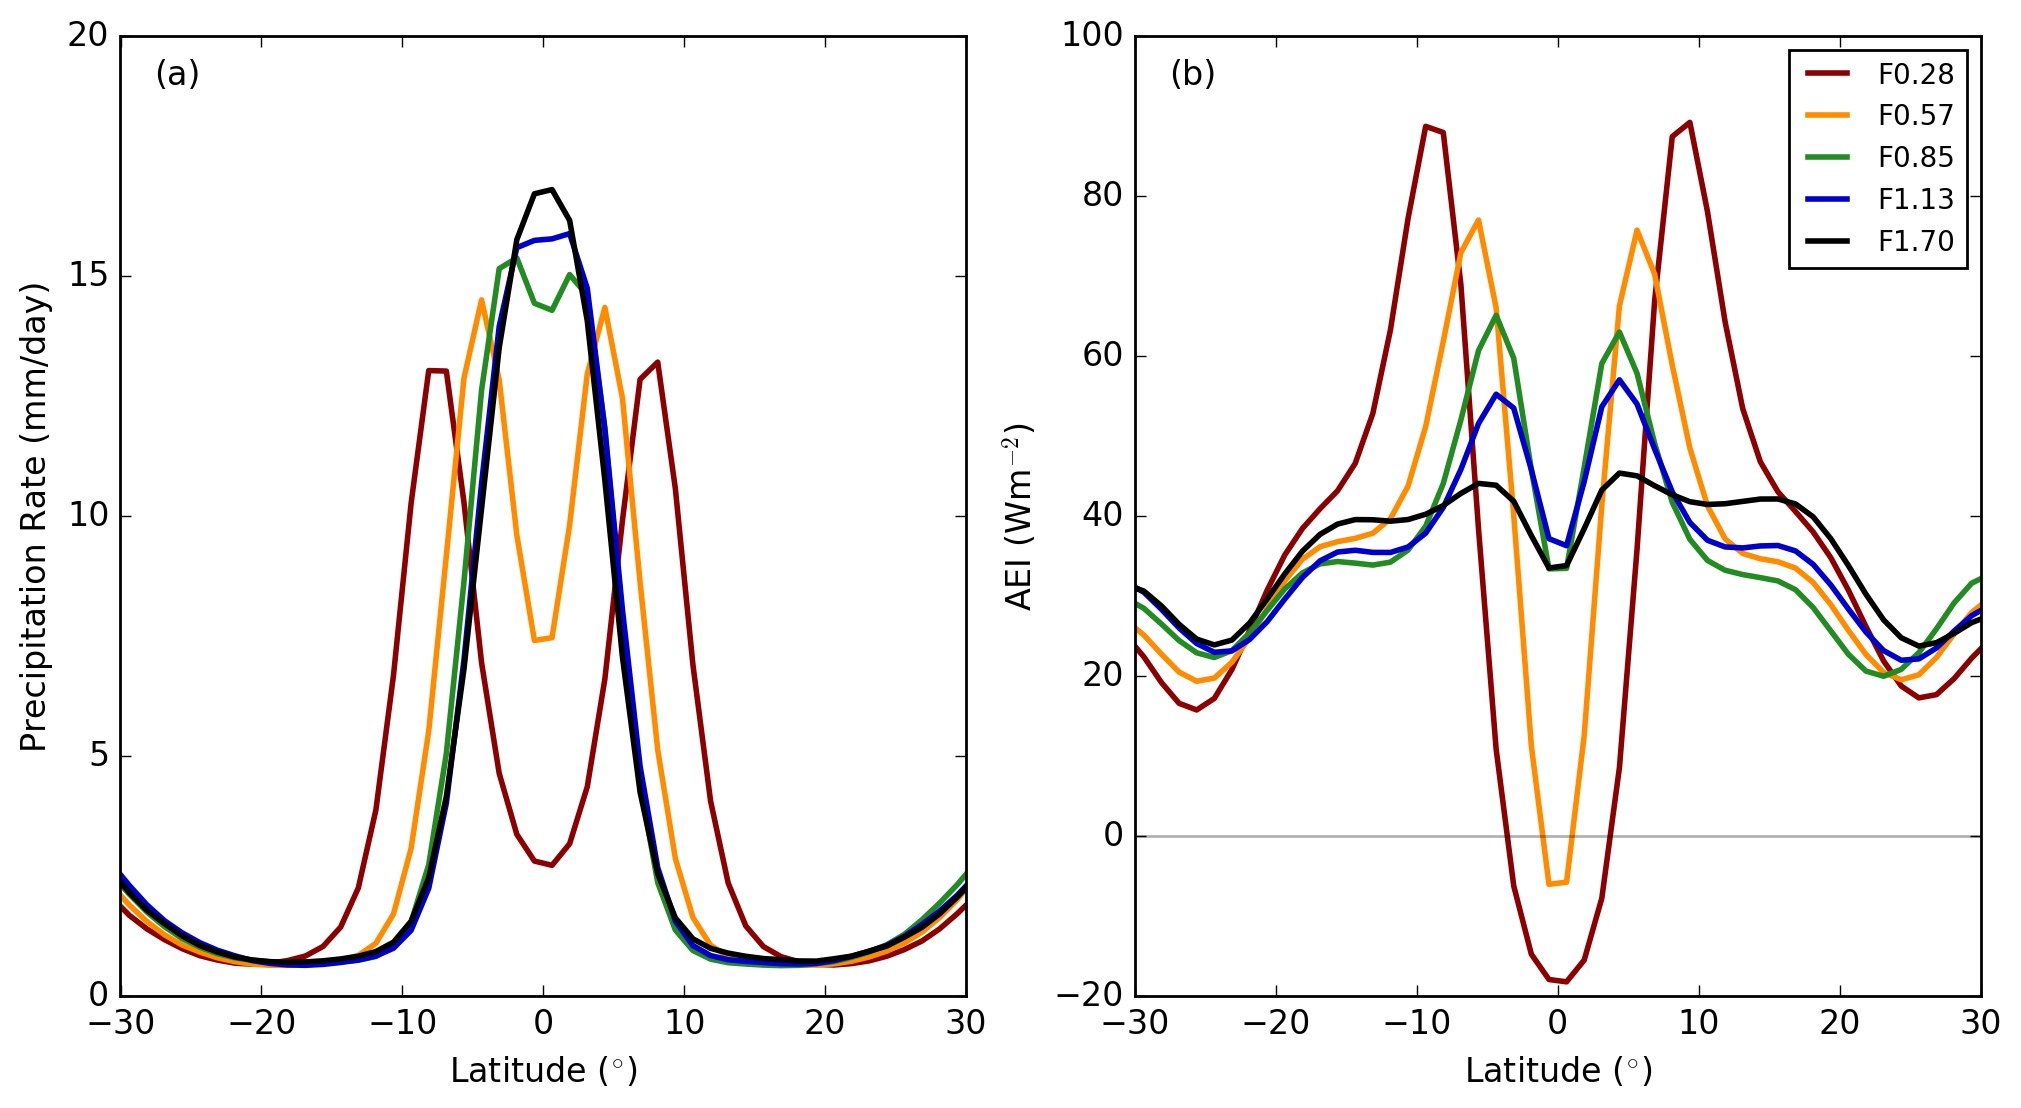
Within a climate model parameterisations are used to replace processes that are too small-scale or complex to be physically represented in the model. Parameterisation schemes are used to simulate a variety of processes including processes within the boundary layer, radiative fluxes and atmospheric chemistry. However my work, along with a plethora of others, shows that the representation of the ITCZ is sensitive to the convective parameterisation scheme (Figure 2a). The convective parameterisation scheme simulates the life cycle of clouds within a model grid-box.
Our method of showing that the simulated ITCZ is sensitive to the convective parameterisation scheme is by altering the convective mixing rate in prescribed-SST aquaplanet simulations. The convective mixing rate determines the amount of mixing a convective parcel has with the environmental air, therefore the greater the convective mixing rate, the quicker a convective parcel will become similar to the environmental air, given fixed convective parcel properties.
Figure 2: Zonal-mean, time-mean (a) precipitation rates (mm day-1}$) and (b) AEI (W m-2) in simulations where the convective mixing rate is varied.
In our study, the structure of the simulated ITCZ is sensitive to the convective mixing rate. Low convective mixing rates simulate a double ITCZ (two precipitation maxima, orange and red lines in Figure 2a), and high convective mixing rates simulate a single ITCZ (blue and black lines).
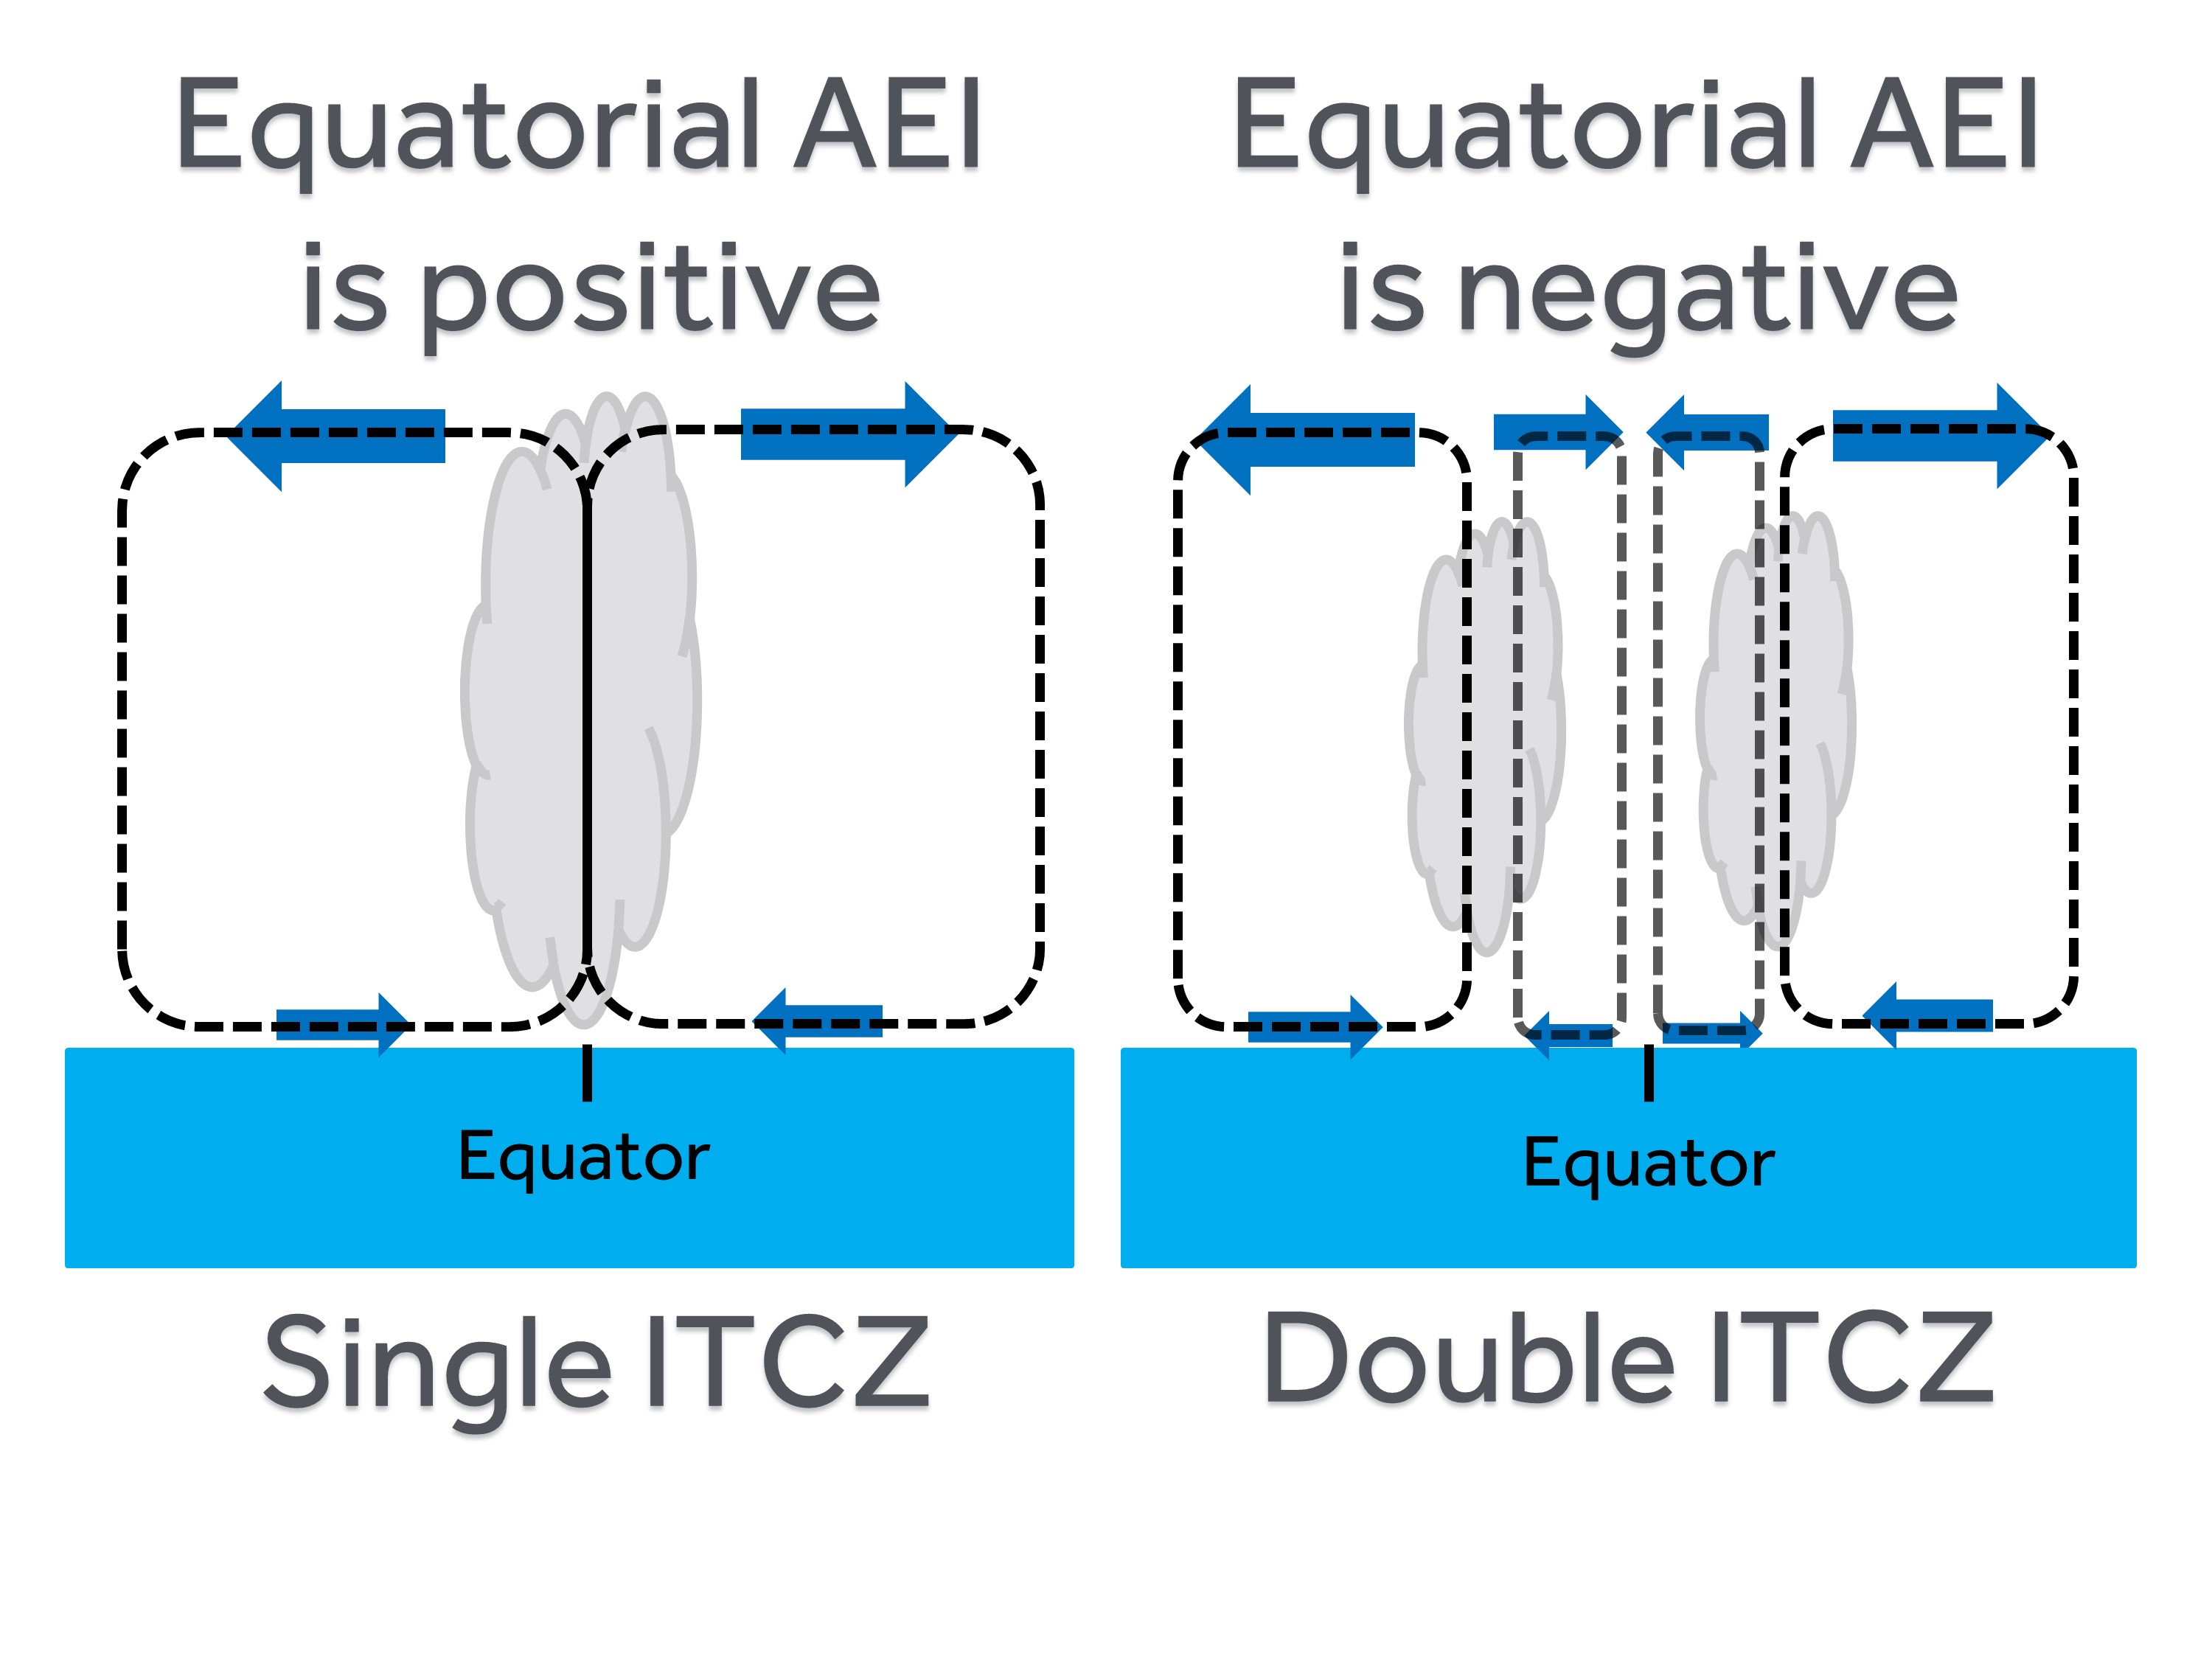
We then associate these ITCZ structures to the atmospheric energy input (AEI). The AEI is the amount of energy left in the atmosphere once considering the top of the atmosphere and surface energy budgets. We conclude, similar to Bischoff and Schneider, 2016, that when the AEI is positive (negative) at the equator, a single (double) ITCZ is simulated (Figure 2b). When the AEI is negative at the equator, energy is needed to be transported towards the equator for equilibrium. From a mean circulation perspective, this take place in a double ITCZ scenario (Figure 3). A positive AEI at the equator, is associated with poleward energy transport and a single ITCZ.
Figure 3: Schematic of a single (left) and double ITCZ (right). Blue arrows denote energy transport. In a single ITCZ scenario more energy is transported in the upper branches of the Hadley circulation, resulting in a net-poleward energy transport. In a double ITCZ scenario, more energy is transport equatorward than poleward at low latitudes, leading to an equatorward energy transport.
In our paper, we use this association between the AEI and ITCZ to hypothesize that without the cloud radiative effect (CRE), atmospheric heating due to cloud-radiation interactions, a double ITCZ will be simulated. We also hypothesize that prescribing the CRE will reduce the sensitivity of the ITCZ to convective mixing, as simulated AEI changes are predominately due to CRE changes.
In the rest of the paper we perform simulations with the CRE removed and prescribed to explore further the role of the CRE in the sensitivity of the ITCZ. We conclude that when removing the CRE a double ITCZ becomes more favourable and in both sets of simulations the ITCZ is less sensitive to convective mixing. The remaining sensitivity is associated with latent heat flux alterations.
My future work following this publication explores the role of coupling in the sensitivity of the ITCZ to the convective parameterisation scheme. Prescribing the SSTs implies an arbitary ocean heat transport, however in the real world the ocean heat transport is sensitive to the atmospheric circulation. Does this sensitivity between the ocean heat transport and atmospheric circulation affect the sensitivity of the ITCZ to convective mixing?
Thanks to my funders, SCENARIO NERC DTP, and supervisors for their support for this project.
References:
Blackburn, M. et al., (2013). The Aqua-planet Experiment (APE): Control SST simulation. J. Meteo. Soc. Japan. Ser. II, 91, 17–56.
Bischoff, T. and Schneider, T. (2016). The Equatorial Energy Balance, ITCZ Position, and Double-ITCZ Bifurcations. J. Climate., 29(8), 2997–3013, and Corrigendum, 29(19), 7167–7167.
You’ve watched many speak before you. You’ve practised your presentation repeatedly. You’ve spent hours, days, months, and sometimes years, understanding your scientific work. Yet, no matter the audience’s size or specialism, the nerves always creep in before a presentation. It’s especially no different at your first international conference!
Between the 16th and 20th April 2018, me, Jonathan Beverley and Bethan Harris were fortunate enough to attend and present at the American Meteorological Society 33rd Conference on Hurricanes and Tropical Meteorology in Ponte Vedra, Florida. For each of us, our first international conference!
Being a regular user of Instagram through the conference, especially the Instagram Story function, I was regularly asked by my friends back home, “what actually happens at a scientific conference”? Very simple really – scientists from around the world, from different departments, universities, and countries, come to share their work, in the hope of progressing the scientific field, to learn from one another, and network with future collaborators. For myself, it was an opportunity to present recently submitted work and to discuss with fellow researchers on the important questions that should be asked during the rest of my PhD. One outcome of my talk for example, was a two-hour discussion with a graduate student from Caltech, which not only improved my own work, but also helped me understand other research in global circulation.
Recordings of the presentations given by University of Reading PhD students can be found at:
Alongside presenting my own work, I had the opportunity to listen and learn from other scientific researchers. The conference had oral and poster presentations from a variety of tropical meteorology subject areas including hurricanes, global circulation, sub-seasonal forecasting, monsoons and Madden-Julian Oscillation. One of the things that I most enjoy at conferences is to hear from leading academics give an overview of certain topic or issue. For example, Kerry Emanuel spoke on the inferences that can be made from simple models of tropical convection. Through applying four key principles of tropical meteorology including the weak temperature gradient approximation and conservation of free-tropospheric moist static energy, we can understand tropical meteorology processes including the Intertropical Convergence Zone, Walker circulation and observed temperature and humidity profiles.
Of course, if you’re going to fly to the other side of the pond, you must take advantage of being in the USA. We saw a SPACEX rocket launch, (just at a distance of 150 miles away,) experienced travelling through a squall line, visited the launch sites of NASA’s first space programs, and explored the sunny streets of Miami. It was a great privilege to have the opportunity to present and attend the AMS 33rd Conference on Hurricanes and Tropical Meteorology, and I am hugely thankful to NERC SCENARIO DTP and the Department of Meteorology for funding my work and travel.
Joseph Taylor, NERC SCEARNIO DTP student. Zoological Society of London.
Email: J.Taylor5@pgr.reading.ac.uk
Projecting the impacts of climate change on biodiversity is important for informing
Male Mauritius kestrel (Falco punctatus) in the Bambous Mountains, eastern Mauritius. Photo by Joe Taylor.
mitigation and adaptation strategies. There are many studies that project climate change impacts on biodiversity; however, changes in the occurrence of extreme weather events are often omitted, usually because of insufficient understanding of their ecological impacts. Yet, changes in the frequency and intensity of extreme weather events may pose a greater threat to ecosystems than changes in average weather regimes (Jentsch and Beierkuhnlein 2008). Island species are expected to be particularly vulnerable to climate change pressures, owing to their inherently limited distribution, population size and genetic diversity, and because of existing impacts from human activities, including habitat destruction and the introduction of non-native species (e.g. Fordham and Brook 2010).
Mauritius is an icon both of species extinction and the successful recovery of threatened species. However, the achievements made through dedicated conservation work and the investment of substantial resources may be jeopardised by future climate change. Conservation programmes in Mauritius have involved the collection of extensive data on individual animals, creating detailed longitudinal datasets. These provide the opportunity to conduct in-depth analyses into the factors that drive population trends.
My study focuses on the demographic impacts of weather conditions, including extreme events, on three globally threatened bird species that are endemic to Mauritius. I extended previous research into weather impacts on the Mauritius kestrel (Falco punctatus), and applied similar methods to the echo parakeet (Psittacula eques) and Mauritius fody (Foudia rubra). The kestrel and parakeet were both nearly lost entirely in the 1970s and 1980s respectively, having suffered severe population bottlenecks, but all three species have benefitted from successful recovery programmes. I analysed breeding success using generalised linear mixed models and analysed survival probability using capture-mark-recapture models. Established weather indices were adapted for use in this study, including indices to quantify extreme rainfall, droughts and tropical cyclone activity. Trends in weather indices at key conservation sites were also analysed.
The results for the Mauritius kestrel add to a body of evidence showing that precipitation is an important limiting factor in its demography and population dynamics. The focal population in the Bambous Mountains of eastern Mauritius occupies an area in which rainfall is increasing. This trend could have implications for the population, as my analyses provide evidence that heavy rainfall during the brood phase of nests reduces breeding success, and that prolonged spells of rain in the cyclone season negatively impact the survival of juveniles. This probably occurs through reductions in hunting efficiency, time available for hunting and prey availability, so that kestrels are unable to capture enough prey to sustain themselves and feed their young (Nicoll et al. 2003, Senapathi et al. 2011). Exposure to heavy and prolonged rainfall could also be a direct cause of mortality through hypothermia, especially for chicks if nests are flooded (Senapathi et al. 2011). Future management of this species may need to incorporate strategies to mitigate the impacts of increasing rainfall.
References:
Fordham, D. A. and Brook, B. W. (2010) Why tropical island endemics are acutely susceptible to global change. Biodiversity and Conservation 19(2): 329‒342.
Jentsch, A. and Beierkuhnlein, C. (2008) Research frontiers in climate change: Effects of extreme meteorological events on ecosystems. Comptes Rendus Geoscience 340: 621‒628.
Nicoll, M. A. C., Jones, C. G. and Norris, K. (2003) Declining survival rates in a reintroduced population of the Mauritius kestrel: evidence for non-linear density dependence and environmental stochasticity. Journal of Animal Ecology 72: 917‒926.
Senapathi, D., Nicoll, M. A. C., Teplitsky, C., Jones, C. G. and Norris, K. (2011) Climate change and the risks associated with delayed breeding in a tropical wild bird population. Proceedings of the Royal Society B 278: 3184‒3190.
Climate scientists have a lot of insight into the factors driving weather systems in the mid-latitudes, where the rotation of the earth is an important influence. The tropics are less well served, and this can be a problem for global climate models which don’t capture many of the phenomena observed in the tropics that well.
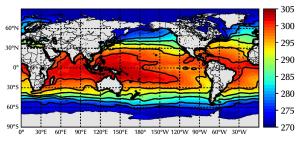
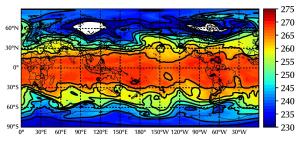
What we do know about the tropics however is that despite significant contrasts in sea surface temperatures (Fig. 1) there is very little horizontal temperature variation in the atmosphere (Fig. 2) – because the Coriolis force (due to the Earth’s rotation) that enables this gradient in more temperate climates is not present. We believe that the large-scale circulation acts to minimise the effect these surface contrasts have higher up. This suggests a model for vertical wind which cools the air over warmer surfaces and warms it where the surface is cool, called the Weak Temperature Gradient (WTG) Approximation, that is frequently used in studying the climate in the tropics.
Fig.1 Sea surface temperatures (K) at 0Z on 1/1/2000 (ERA-Interim)
Fig.2 Temperatures at 500 hPa (K) at 0Z on 1/1/2000 (ERA-Interim)
Thermodynamic ideas have been around for some 200 years. Carnot, a Frenchman worried about Britain’s industrial might underpinning its military potential(!), studied the efficiency of heat engines and showed that the maximum mechanical work generated by an engine is determined by the ratio of the temperatures at which energy enters and leaves the system. It is possible to treat climate systems as heat engines – for example Kerry Emanuel has used Carnot’s idea to estimate the pressure in the eye of a hurricane. I have been building on a recent development of these ideas by Olivier Pauluis at New York University who shows how to divide up the maximum work output of a climate heat engine into the generation of wind, the lifting of moisture and a lost component, which he calls the Gibbs penalty, which is the energetic cost of keeping the atmosphere moist. Typically, 50% of the maximum work output is gobbled up by the Gibbs penalty, 30% is the moisture lifting term and only 20% is used to generate wind.
For my PhD, I have been applying Pauluis’ ideas to a modelled system consisting of two connected tropical regions (one over a cooler surface than the other), which are connected by a circulation given by the weak temperature gradient approximation. I look at how this circulation affects the components of work done by the system. Overall there is no impact – in other words the WTG does not distort the thermodynamics of the underlying system – which is reassuring for those who use it. What is perhaps more interesting however, is that even though the WTG circulation is very weak compared to the winds that we observe in the two columns, it does as much work as is done by the cooler column – in other words its thermodynamic importance is huge. This suggests that further avenues of study may help us better express what drives the climate in the tropics.