Email: J.Gristey@pgr.reading.ac.uk
Web: http://www.met.reading.ac.uk/~fn008822/
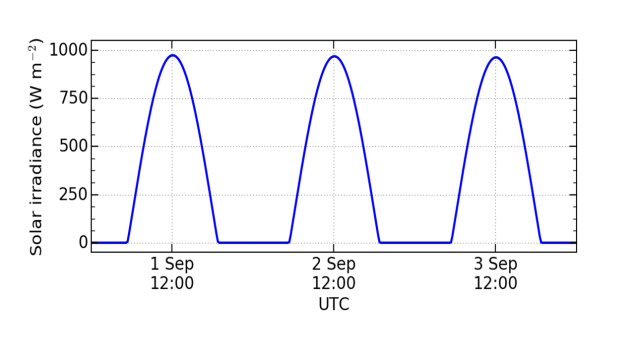
As the Earth rotates, each location on its surface is periodically exposed to incoming sunlight. For example, over London at the beginning of September, the intensity of incoming sunlight ranges from zero overnight, when the sun is below the horizon, to almost 1000 W m–2 at noon, when the sun is highest in the sky (Fig. 1).
Earth’s atmosphere and surface respond to this repeating daily cycle of incoming sunlight in ways that can change the amount of energy that is emitted or reflected back to space. For example, the increased amount of sunlight in the afternoon can heat up the surface and cause more thermal energy to be emitted to space. Meanwhile, the surface heating can also cause the air near the surface to warm up and rise to form clouds that will, in turn, reflect sunlight back to space. The resulting daily cycle of the top-of-atmosphere outgoing energy flows is therefore intricate and represents one of the most fundamental cycles of our weather and climate. It is essential that we can properly represent the physical processes controlling this daily variability to obtain accurate weather and climate forecasts. However, the daily variability in Earth’s outgoing energy flows is not currently well observed across the entire globe, and current weather and climate models can struggle to reproduce realistic daily variability, highlighting a lack of understanding.
To improve understanding, dominant patterns of the daily cycle in outgoing energy flows are extracted from Met Office model output using a mathematical technique known as “principal component analysis”.
The daily cycle of reflected sunlight is found to be dominated by the height of the sun in the sky, or the “solar zenith” angle, because the atmosphere and surface are more reflective when the sun is low in the sky. There is a lesser importance from low-level clouds over the ocean, known as “marine stratocumulus” clouds, which burn off during the afternoon, reducing the amount of reflected sunlight, and tall and thick clouds, known as “deep convective” clouds, which develop later in the afternoon over land and increase the amount of reflected sunlight. On the other hand, the daily cycle of emitted thermal energy is dominated by surface heating, which increases the emitted energy at noon, but also by deep convective clouds that have very high and cold tops, reducing the emitted energy later in the afternoon. These dominant processes controlling the daily cycle of Earth’s outgoing energy flows and their relative importance (summarised in Fig. 2) have not been revealed previously at the global scale.

The physical processes discussed above are consistent with the daily cycle in other relevant model variables such as the surface temperature and cloud amount, further supporting the findings. Interestingly, a time lag is identified in the response of the emitted thermal energy to cloud variations, which is thought to be related to changes in the humidity of the upper atmosphere once the clouds evaporate.
The new results highlight an important gap in the current observing system, which can be utilized to evaluate and improve deficiencies in weather and climate models.
Gristey, J. J., Chiu, J. C., Gurney, R. J., Morcrette, C. J., Hill, P. G., Russell, J. E., and Brindley, H. E.: Insights into the diurnal cycle of global Earth outgoing radiation using a numerical weather prediction model, Atmos. Chem. Phys., 18, 5129-5145, https://doi.org/10.5194/acp-18-5129-2018, 2018.