Hello dear readers! Reviewing submissions and discovering the fascinating research that takes place in Reading Meteorology has been an amazing experience, and a personal highlight of the year!
Thank you to everyone who has contributed to the social metwork this year, and especially to those who have been patient whilst myself and Brian have been getting used to our new roles as co-editors. The quality of submissions has been very high, but don’t let that deter you if you haven’t written for the blog before! Writing for the social metwork is not as tricky as you might think – we promise!
At the time of writing, the blog has had over 5550 visitors, and is on track for an all time high by the end of the year. We hope that the social metwork has contributed to lifting spirits and continuing the met department social atmosphere throughout the year. In case you missed any posts, or want a second look at some, here is a list of all the posts from this year:
This year’s Conference of the Parties (COP) should have taken place earlier in November, hosted by the UK in Glasgow and in partnership with Italy. Despite many global events successfully moving online this year, from film festivals to large conferences such as the EGU general assembly, the international climate talks were postponed until November 2021.
But young people around the world are more engaged than ever before with the urgent need for international cooperation in the face of the climate emergency. The Fridays for Future (FFF) movement has recorded participation since late 2018 of more than 13,000,000 young people, in 7500cities from all continents. FFF has adapted to the covid-19 crisis, and on 25th September this year participants from over 150 countries took part both online and in the streets, highlighting the Most Affected People and Areas (MAPA).
Unimpressed by the delay of important climate talks and negotiations, students and youth activists from FFF and a multitude of groups and movements have initiated the MOCK COP26, a 2-week online global conference on climate change that mirrors the real COP.
“My country, the Philippines, is struggling. We don’t want more floods that rise up to 15 feet, winds that peel off roofs in seconds, the rain that drowns our pets and livestock, and storm surges that ravage coastal communities. We don’t want more people to die. We’re still a developing country that contributes so little to global carbon emissions yet we face the worst of its consequences. This is absurd!
Over a dozen academic support videos break down complicated topics such as “The Kyoto Protocol”, “Agriculture and Agribusiness”, and the “History of Climate Negotiation”. These videos are helping youth delegates and all participants to understand what happens at a COP summit.
Panel sessions have featured United Nations Youth Envoy Jayathma Wickramanayake, 9 year old Climate & Environmental Activist Licypriya Kangujam, and (actual) COP26 president Alok Sharma.
High Level Country Statements
A unique aspect of MOCK COP that I have been excitedly anticipating is the high level country statements; each a 3 minute speech given by youth climate activists representing their nation.
Mock COP26 is not dominated by big polluters as COP26 is. We believe that we need to amplify the people on the frontlines of climate change, which is why we will be aiming to, throughout Mock COP, uplift the voices of those from MAPA (Most Affected People and Areas) countries above those from the Global North. This is why Mock COP26 is special.
Youth delegates have been encouraged to give speeches in whichever language they are most comfortable talking. At the time of writing, subtitles don’t appear to be fully functioning. However a large number of talks are given in English, and transcripts of all talks have been made available here: https://drive.google.com/drive/folders/1wnQUMt-rcD9XoKtg8YPWba_LZSf16qTD
I highly recommend setting some time aside to give these speeches a listen. Although the total number might put you off, it is very easy to jump in and out of talks. You can find videos embedded below, or on the official youtube channel.
Africa
Pick: Two youth delegates represent Morocco. Whilst Morocco has been ranked a role model for climate action, the reality of the country’s future is alarming. Globally the most affected are the least protected. It’s time for world leaders to protect everyone.
Americas
Pick: The delegate for Suriname explains risks faced as a Small Island Developing State (SIDS) with infrastructure near the coast. Suriname must implement climate adaptation whilst enhancing its legislation in forestry, mining, and agriculture.
Asia
Pick: Indonesia’s delegate opens with the stark warning that the country will lose 1500 of its islands due to rising sea levels by 2050. The high level statement includes calls to incorporate climate education into the national curriculum, and find ways to protect natural habitat. Indonesia has the 2nd biggest rainforest in the world, but currently has no agreed emissions reductions pathway.
Europe
Pick: Ireland’s youth delegates present a necessarily progressive 5 year plan to stick to the EU target of reducing emissions by at least 65% by 2030. The need for much stronger climate education, and providing access to affordable and sustainable energy, are among many other commitments.
Oceania
Pick: The year started with forest fires devastating large swathes of Australia’s natural habitats. Youth delegates want their nation to lead the world as a renewable energy exporter, and an overhaul of media rules to foster new diverse media outlets and prevent monopolies that currently stall climate action.
But youth messages can be heard loud and clear at MOCK COP 26, reflecting the 5 themes of the conference.
We demand concrete action, not mere promises. It’s time for our leaders to wake up, prioritize the realization of the Green Deal, and cut carbon emissions.
We won’t have more time to alter the effects of the climate crisis if we let this opportunity pass. The clock is ticking. The time for action is NOW.
In the wake of covid-19 induced economic shocks, policy makers must ensure genuine green recovery that engages with ideas of global climate justice.
Youth delegate panels will continue over the weekend, working towards the creation of a final statement outlining their demands for world leaders. This will be presented to High Level Climate Action Champion for COP26 Nigel Topping, at the closing ceremony (12:00 GMT Tuesday 1st December)
The current PhD travel budget of £2000 doesn’t go far, especially if you have your eye on attending the AGU Fall Meeting in San Francisco. If the world ever goes back to normal (and fingers crossed it will – though hopefully with more greener travel options, and remote participation in shorter conferences?) you might wonder how you are ever going to afford the conferences your supervisors suggest. Luckily, there are many ways you can supplement your budget. Receiving travel grants not only means more conferences (and more travel!), but it also looks great on your CV. In this blog post I share what I have learnt about applying for conference grants and list the main places to apply.
Unlimited payments until you have received £300 in total
4 deadlines throughout the year: 1st March, 1st June, 1st September and 1st December
Note: you apply for funding from an IOP group, and the conference must be relevant to the group. For example, most meteorology PhD students would apply for conference funding from the Environmental Physics group. You get to choose which groups to join when you become an IOP member.
2 deadlines each year: 15th February and 15th August
From the conference organiser
Finally, many conferences offer their own student support, so it’s always worth checking the conference website to see
Both EGU and AGU offer grants to attend their meetings each year
Application Tips
Apply early!!!
Many of these schemes take months to let you know whether you have been successful. Becoming a member can also take a while, especially when societies only approve new members at certain times of the year. So, it’s good to talk to your supervisor and make a conference plan early on in your PhD, so you know when to apply.
Writing your application
Generally, these organisations are keen to give away their funds, you just have to write a good enough application. Keep it simple and short: remember the person reading the application is very unlikely to be an expert in your research. It can be helpful to ask someone who isn’t a scientist (or doesn’t know your work well) to read it and highlight anything that doesn’t make sense to them.
Estimating your conference expenses
You are usually expected to provide a breakdown of the conference costs with every application. The main costs to account for are:
Accommodation: for non-UK stays must apply for a quote through the university travel agent
Travel: UK train tickets over £100 and all international travel must be booked by university too
Subsistence: i.e. food! University rules used to say this could be a maximum of £30 per day – check current guidelines
Conference Fees: the conference website will usually list this
The total cost will depend on where the conference is. You are generally expected to choose cheaper options, but there is some flexibility. As a rough guide: a 4-day conference within the UK cost me around £400 (in 2019) and a 5-night stay in San Francisco to attend AGU cost me around £2200 (in 2019).
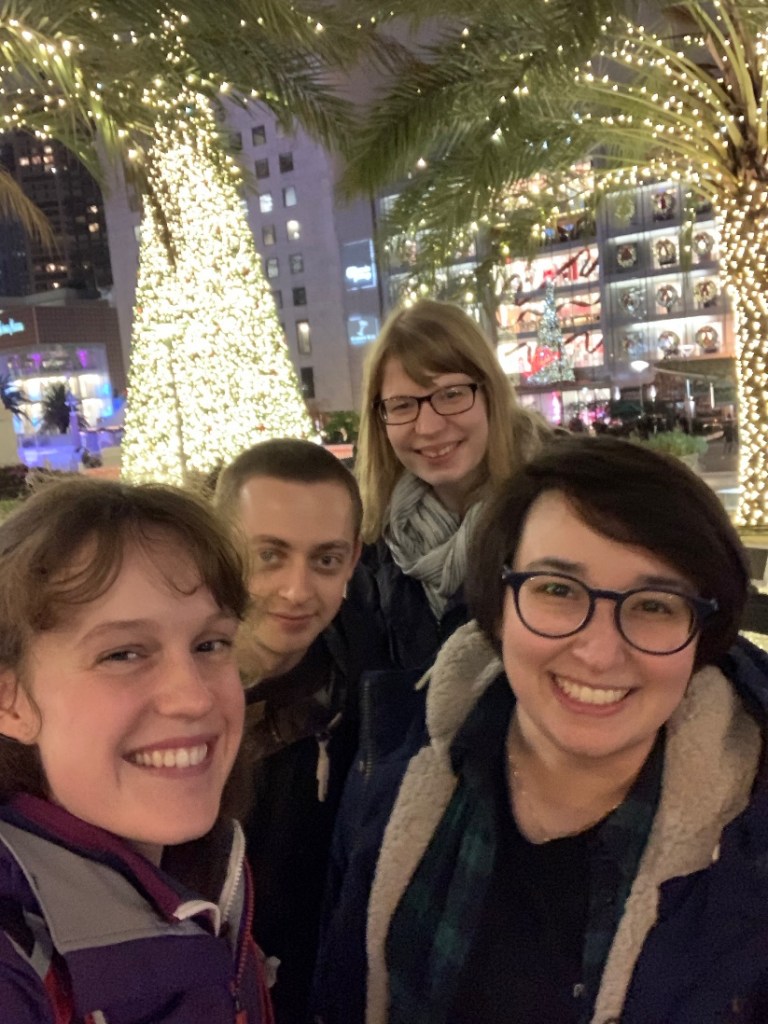
Reading PhD students at Union Square, San Francisco for AGU!
The ECMWF/EUMETSAT NWP SAF Workshop (European Centre for Medium-Range Weather Forecasts/European Organisation for the Exploitation of Meteorological Satellites Numerical Weather Prediction Satellite Application Facilities Workshop) was originally to be held at the ECMWF centre in Reading, but as with everything else in 2020 was moved online. The workshop was designed to be a place to share new ideas and theories for dealing with errors in satellite data assimilation: encompassing the treatment of random errors; biases in observations; and biases in the model.
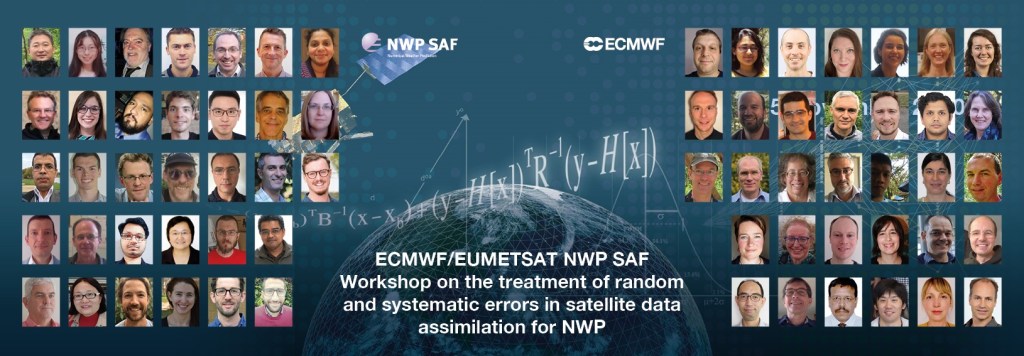
Group photo of attendees of ECMWF/EUMETSAT NWP SAT Workshop – Virtual Event: ECMWF/EUMETSAT NWP SAF Workshop on the treatment of random and systematic errors in satellite data assimilation for NWP.
It was held over four days: consisting of oral and poster presentations; panel discussions; and concluded on the final day with the participants split into groups to discuss what methods are currently in use and what needs to be addressed in the future.
Oral Presentations
The oral presentations were split into four sessions: scene setting talks; estimating uncertainty; correction of model and observation biases; and observation errors. The talks were held over Zoom for the main presenters and shown via a live broadcast on the workshop website. This worked well as the audience could only see the individual presenter and their slides, without having the usual worry of checking that mics and videos were off for other people in the call!
Scene Setting Talks
I found the scene setting talks by Niels Bormann (ECMWF) and Dick Dee (Joint Center for Satellite Data Assimilation – JCSDA) very useful as they gave overviews of observation errors and biases respectively: both explaining the current methods as well as the evolution of different methods over the years. Both Niels and Dick are prominent names amongst data assimilation literature, so it was interesting to hear explanations of the underlying theories from the experts in the field before moving onto the more focused talks later in the day.
Correction of Model and Observation Biases
The session about the correction of model and observation biases, was of particular interest to me as it discussed many new theoretical methods for disentangling model and observation biases which are beginning to be used in operational NWP.
The first talk by Patrick Laloyaux (ECMWF) was titled Estimation of Model Biases and Importance of Scale Separation and looked at weak-constraint 4D-Var: a variational bias correction technique that includes an error term in the model, such that solving the cost function involves varying three variables: the state; the observation bias correction coefficient; and the model error. When the background and model errors have different spatial scales and when there are sufficient reference observations, it has been shown in a simplified model that weak-constraint 4D-Var can accurately correct model and initial state errors. They argue that the background error covariance matrix contains small spatial scales, and the model error covariance matrix contains large spatial scales, which means that the errors can be disentangled in the system. However, without this scale difference, separating the errors would be much harder, so this method can only be considered when there are vast differences within the spatial scales.
On the other hand, the talk by Mark Buehner (Environment and Climate Change Canada) discussed an offline technique that performs 3D-Var analysis every six hours using only unbiased, also known as “anchor”, observations to reduce the effects of model bias. These analyses can then be used as reference states in the main 4D-EnVar assimilation cycle to estimate the bias in the radiance observations. This method was much discussed over the course of the workshop, as it is yet to be used operationally and was very interesting to see a completely different bias correction technique to tackle the problem of disentangling model and observation biases.
Posters
Poster presentations were shown via individual pages on the workshop website, with a comments section for small questions and virtual rooms – where presenters were available for a set two hours over the week. There were 12 poster presentations available, ranging from the theoretical statistics behind errors as well as operational techniques to tackle these errors.
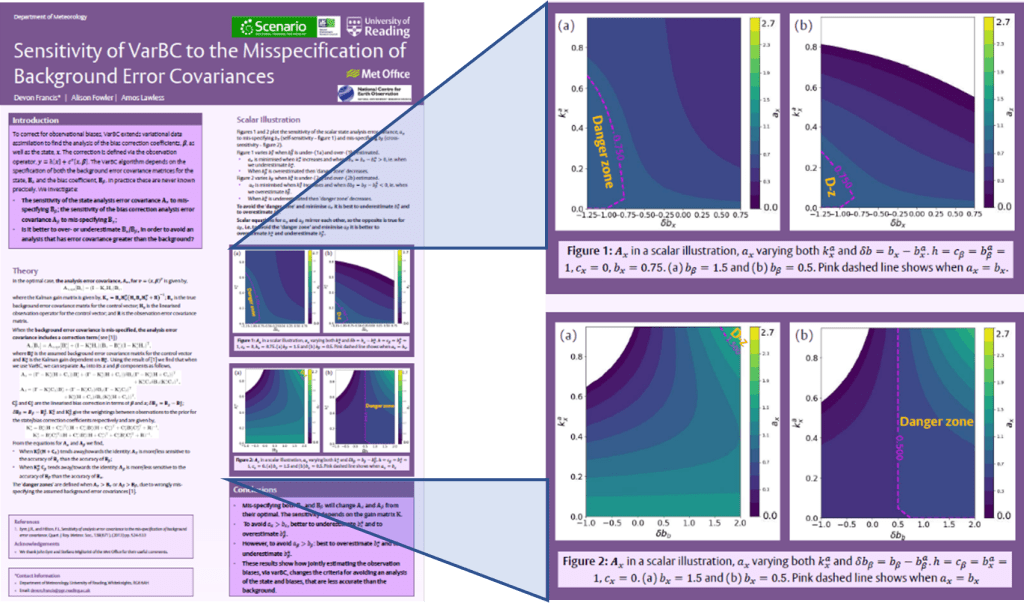
My poster, focused on figures 1 and 2 which show the scalar state analysis error variances when (1) we vary the state background error variance accuracy for (a) underestimating and (b) overestimating the bias background error variance; (2) we vary the bias background error variance accuracy for (a) underestimating and (b) overestimating the state background error variance.
I presented a poster on work that I had been focussing on for the past few months titled Sensitivity of VarBC to the misspecification of background error covariances. My work focused on the effects of wrongly specifying the state and bias background error covariances on the analysis error covariances for the state and the bias. This was the first poster that I had ever presented so was a fast learning curve in how to clearly present detailed work in an aesthetic way. It was a useful experience as it gave me a hard deadline to conclude my current work and I had to really think about my next steps as well as why my work was important. Presenting online was a very different experience to presenting in person as it involved a lot of waiting around in a virtual room by myself, but when people did come, I was able to have some useful conversations, as well as the added bonus of being able to share my screen to share relevant papers.
Working Groups
On the final day we split ourselves into four working groups to discuss two different topics: the treatment of biases and the treatment of observation errors. The goal was to discuss current methods, as well as what we thought needed to be researched in the future or potential challenges that we would come across. This was hosted via the BlueJeans app, which provided a good space to talk as well as share screens and had the useful option to choose the ratio of viewing people’s videos, to viewing the presenter’s screen. Although I wasn’t able to contribute much, this was a really interesting day as I was able to listen to views of the experts in the field and listen to their discussions on what they believed to be the most important current issues, such as increasing discussion between data centres receiving the data and numerical weather prediction centres assimilating the data; and disentangling biases from different sources. Unfortunately for me, some of them felt that we were focussing too much on the theoretical statistics behind NWP and not enough on the operational testing, but I guess that’s experimentalists for you!
Final Thoughts
Although I was exhausted by the end of the week, the ECMWF/EUMETSAT NWP SAF Workshop was a great experience and I would love to attend next time, regardless of whether it is virtual or in person. As much as I missed the opportunity to talk to people face to face, the organisers did a wonderful job of presenting the workshop online and there were many opportunities to talk to the presenters. There were also some benefits of the virtual workshop: people from across the globe could easily join; the presentations were recorded, so can easily be re-watched (all oral and poster presentations can be found via this link – https://events.ecmwf.int/event/170/overview); and resource sharing was easy via screen sharing. I wonder whether future workshops and conferences could be a mixture of online as well as in person, in order to get the best of both worlds? I would absolutely recommend this workshop, both for people who are just starting out in DA as well as for researchers with years of experience, as it encompassed presentations from big names who have been working in error estimation for many years as well as new presenters and new ideas from worldwide speakers.
Just over a month ago in September 2020, I started my journey as a PhD student. Since then, have I spent all of my working hours solely on research – plotting radar scans of heavy rainfall events and coding up algorithms to analyse the evolution of convective cells? Surely not! Outside my research work, I have also taken on the role of demonstrating this academic year.
What is demonstrating? In the department, PhD students can sign up to facilitate the running of tutorials and problems, synoptic, instrument, and computing laboratory classes. Equipped with a background in Physics and having taken modules as an MSc student at the department in the previous academic year, I signed up to run problem classes for this year’s Atmospheric Physics MSc module.
I have observed quite a few lectures during my undergraduate education at Cambridge, MSc programme at Reading and also a few Massive Open Online Courses (MOOCs) as a student. Each had their unique mode of teaching. At Cambridge, equations were often presented on a physical blackboard in lectures, with problem sheet questions handed in 24 hours before each weekly one-hour “supervision” session as formative assessment. At Reading, there have been less students in each lecture, accompanied by problem classes that are longer and more relaxed, allowing for more informal discussion on problem sheet questions between students. These different forms of teaching were engaging to me in their own ways. I have also given a mix of good and not-as-good tutorial sessions for Year 7s to 13s. Good tutorials included interactive demonstrations, such as exploring parametric equations on an online graphing calculator, whereas the not-as-good ones had content that were pitched at too high of a level. Based on these experiences and having demonstrated for 10 hours, I hopefully can share some tips on demonstrating through describing what one would call a “typical” 9am Atmospheric Physics virtual problems class.
PhD Demonstrating 101
You, a PhD student, have just been allocated the role as demonstrator on Campus Jobs and are excited about the £14.83 per hour pay. With the first problems class happening in just a week’s time, you start thinking about tools you will need to give these MSc students the best learning experience. A pencil, paper, calculator and that handy Thermal Physics of the Atmosphere textbook would certainly suffice for face-to-face classes. The only difference this year: You will be running virtual classes! This means that moist-adiabatic lapse rate equation you have quickly scribbled down on paper may not show well on a pixelated video call due to a “poor (connection) experience” from Blackboard. How are you going to prevent this familiar situation from happening?
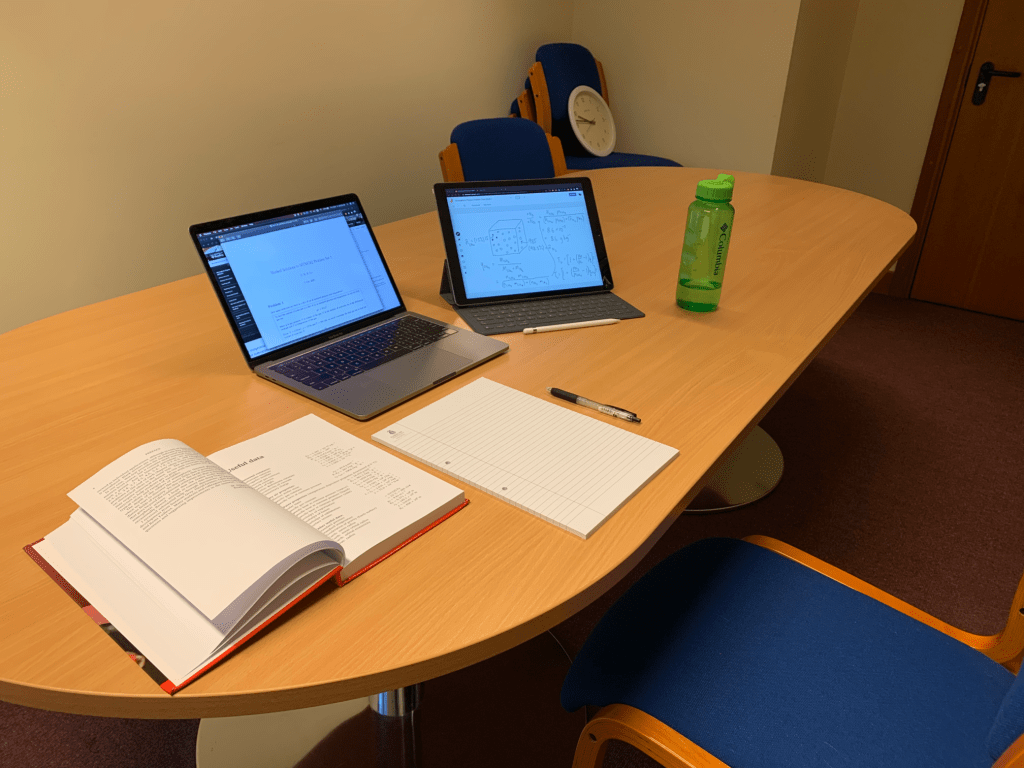
Figure 1: Laptop with an iPad with a virtual whiteboard for illustrating diagrams and equations to be shown on Blackboard Collaborate.
In my toolbox, I have an iPad and an Apple pencil for me to draw diagrams and write equations. The laptop’s screen is linked to the iPad with Google Jamboard running and could be shared on Blackboard Collaborate. Here I offer my first tip:
Explore tools available to design workflows for content delivery and decide on one that works well
Days before the problems class, you wonder whether you have done enough preparation. Have you read through and completed the problem sheet; ready to answer those burning questions from the students you will be demonstrating for? It is important you…
Figure 2: Snippet of type-written worked solutions for the Atmospheric Physics MSc module.
Have your worked solutions to refer to during class
A good way to ensure you are able to resolve queries about problem sheet questions is to have a version of your own working. This could be as simple as some written out points, or in my case, fully type-written solutions, just so I have details of each step on hand. In some of my fully worked solutions, I added comments for steps where I found the learning curve was quite steep and annotated places where students may run into potential problems.
Students seem to take interest in these worked solutions, but here I must recommend…
Do not send out or show your entire worked solutions
It is arguable whether worked solutions will help students who have attempted all problems seriously, but the bigger issue lies in those who have not even given the problems a try. As a demonstrator, I often explain the importance of struggling through the multiple steps needed to solve and understand a physics problem. My worked solutions usually present what I consider to be the quick and more refined way to the numerical solution, but usually are not the most intuitive route. On that note, how then are you supposed to help someone stuck on a problem?
It may be tempting to show snippets of your solutions to help someone stuck on a certain part of a problem. Unfortunately, I found this did not work very well. Students can end up disregarding their own attempt and copy down what they regard as the “model answer”. (A cheeky student would have taken multiple screenshots while I scrolled through my worked solutions on the shared screen…) What I found worked better in breakout groups was for the student(s) to explain how they got stuck.
For example, I once had a few students ask me how they should work out the boiling temperature from saturated vapour pressure using Tetens’ formula. However, my worked solutions solved this directly using the Clausius-Clapeyron equation. Instead of showing them my answer, I arrived at the point where they got stuck (red in Figure 3), essentially putting myself in their shoes. From that point, I was able to give small hints in the correct direction. Using their method, we worked together towards a solution for the problem (black in Figure 3). Here is another tip:
Work through the problem from your students’ perspective
Figure 3: Google Jamboard slide showing how Tetens’ formula is rearranged. Red shows where some students got up to in the question, whereas black is further working to reach a solution.
This again illustrates the point on there being no “model answer”. As in many scientific fields, there exist multiple path functions that get you from a problem to a plausible solution, and the preference for such a path is unique to us all.
There will always be a group of diligent students who gave the problem sheet a serious attempt prior to the class. You will find they only take less than 30 minutes to check their understanding and numerical solutions with you, and they might do their own thing afterwards. This is the perfect opportunity to…
Present bonus material to stretch students further
Some ideas include asking for a physical interpretation from their mathematical result, or looking for other (potentially more efficient) methods of deriving their result. For example, I asked students to deduce a cycle describing the Stirling engine on a TS diagram, instead of the pV diagram they had already drawn out as asked by the problem sheet.
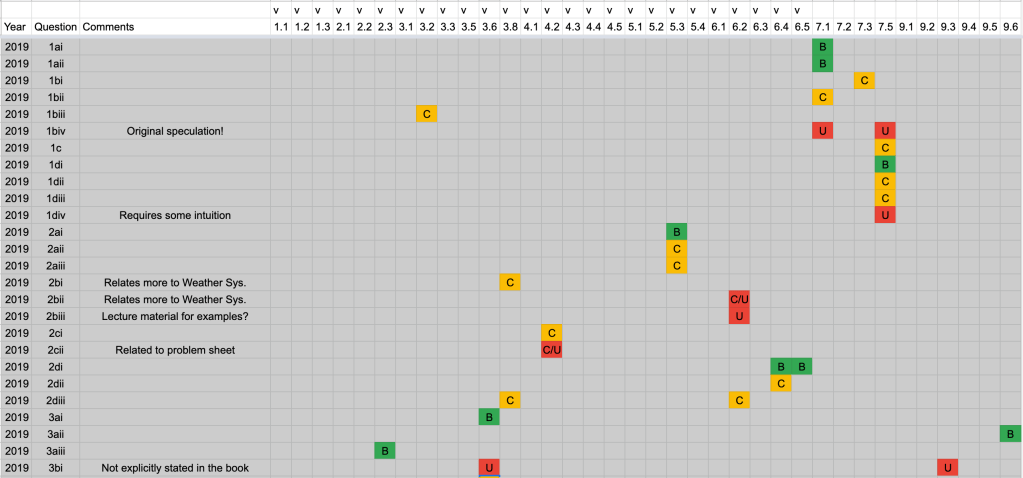
Figure 4: A spreadsheet showing the content coverageof each past exam question
I also have a table of past exam questions, with traffic light colours indicating which parts of the syllabus they cover. If a student would like to familiarise themselves with the exam style, I could recommend one or two questions using this spreadsheet.
On the other hand, there may be the occasional group who have no idea where equation (9.11) on page 168 of the notes came from, or a student who would like the extra-reassurance of more mathematical help on a certain problem. As a final tip, I try to cater to these extra requests by…
Staying a little longer to answer a final few questions
The best demonstrators are approachable, and go the extra mile to cater to the needs of the whole range of students they teach, with an understanding of their perspectives. After all, being a demonstrator is not only about students’ learning from teaching, but also your learning by teaching!
I would welcome your ideas about demonstrating as a PhD. Feel free to contact me at brian.lo@pgr.reading.ac.uk if you would like to discuss!
As per annual tradition in the Meteorology Department, PhD students have chosen a distinguished scientist to visit the department for one week. Previous years’ visitors include Prof. Tapio Schneider (Caltech), Prof. Olivia Romppainmen-Martius (University of Bern), and Prof. Cecilia Bitz (University of Washington). This year’s winning vote was New York University’s Prof. Laure Zanna, who will be visiting the department virtually1 between 2 – 6th November.
Laure is an oceanographer and climate scientist whose career so far has spanned three continents, won her an American Meteorological Society (AMS) Early Careers’ award for “exceptionally creative” science this year, and netted her 600 citations in the last two years. Her research interests encompass ocean turbulence, climate dynamics, predictability, machine learning and more. Some of the many topics of her published papers include the uncertainty in projections of ocean heat uptake; ocean turbulence parametrisations; predictions of seasonal to decadal sea surface temperatures in the Atlantic using simple statistical models and machine learning to inform prediction of extreme events. Besides being an exceptional scientist, speaker and educator, Laure is a down-to-Earth and friendly person, described by the Climate Scientists podcast’s Dan Jones as ‘a really great person who helps to tie the whole community together’.
As someone who had received their PhD only just over a decade ago, we thought Laure would be the perfect candidate to inspire us and our science through sharing some of her academic experiences with us. Before her visit next week, Laure kindly answered some interview-style questions for this week’s Social Metwork blog post.
Q: What inspired you to research oceanography and climate in the first place?
A: I always enjoyed math and physics. The possibility of using these disciplines to study scientific problems that I could “see” was very appealing.
Q: Why were you drawn to machine learning?
A: The power of machine learning (ML) to advance fields such as natural processing language or computer science is indisputable. I was excited by the premise of ML for climate science. In particular, can ML help deepen our understanding of certain aspects of the climate systems (e.g. interactions between scales or interactions between the ocean and atmosphere)? Can ML improve the representation of small-scale processes in climate models? ML, by itself, is not enough but combined with our physical understanding of the climate system could push the field forward.
Q: Can you give us an idea of what’s the most exciting research you are working on right now?
A: This is impossible. I work on 2 main areas of research right now: understanding and parameterizing ocean mesoscale eddies and understanding the role of the oceans in climate. I am passionate and excited about both topics. Hopefully, you will hear about both of them during the week.
Q: When did you realise/decide you were going to remain in academia?
A: I decided that I wanted to try and stay in academia in the last year of my PhD. I was lucky enough to be able to.
Q: What is your favourite part of your job?
A: Working with my group! The students and postdocs in the group have different expertise but all are passionate about their research. They make the work and the research more fun, more challenging, and more inspiring.
We are honoured to have our invitation accepted by Laure and are eagerly anticipating answers to more of these kind of questions throughout next week’s conversations. Laure will be presenting a seminar titled, “Machine learning for physics-discovery and climate modelling” during the Monday Departmental Seminar series, as well as another seminar in the Climate and Ocean Dynamics research group, titled “Understanding past and future ocean warming”. She will also give a career-focused session at PhD group and, of course, engage with both the PhD students and staff on an individual basis during one-to-one meetings. We are grateful and delighted to be able to welcome Laure to the Meteorology department despite the various difficulties the year 2020 has posed on everyone, so come along to next week’s events!
A Doctoral Training Programme (DTP) provides funding, training, and opportunities for many PhD students in our department. Every year three environmentally focused DTPs: the SCENARIO NERC DTP, the London NERC DTP, and the Science and Solutions for a Changing Planet (SSCP) DTP, combine forces to hold a conference bringing together hundreds of PhD students to present their work and to network. As for many conferences in 2020, COVID19 disrupted our plans for the Joint DTP conference. Usually the conference is hosted at one of the universities involved with a DTP however, this year it was held virtually using a mixture of Zoom and Slack.
The decision to go virtual was difficult. We had to decide early in the pandemic when we didn’t know how long the lockdown would last nor what restrictions would be in place in September. If possible, we wanted to keep the conference in-person so that attendees got the full experience as it’s often the first time the new cohort meet and one of the few chances for the DTPs to mingle. However, as meeting and mingling was, and is, very much discouraged, making the decision to go virtual early on meant we had time to re-organise.
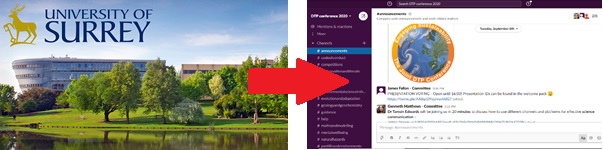
Figure 1 – It was initially planned to hold the conference at the University of Surrey campus, which is located in Guildford, Surrey and hosts some students from the SCENARIO NERC DTP. The conference was instead held on Slack, an online communication platform that allows content to be divided into channels, and presentation sessions were hosted on Zoom.
When we thought we were organising a conference to be held at the University of Surrey, the main theme was “Engaging Sustainability” with the aim of making the conference as sustainable as possible. Since one of the often-made criticisms of conferences, especially those within the environmental fields, is the impact of large numbers of people travelling to one place, a virtual conference has obvious environmental benefits. An additional benefit was that we could invite guest speakers, such as Mya-Rose Craig (aka Bird Girl @birdgirluk), who may not have been able to attend if the event was held in person. It was also easier for some participants who had other commitments, such as childcare, to attend, although poor internet connection was an issue for others.
The pandemic exposed, and often enhanced, many issues within academia and society in general. A questionnaire sent out before the event showed that most attendees were finding working from home and all other pandemic induced changes exhausting and mentally challenging. The recent Black Lives Matter protests around the world and the disproportionate impact of COVID on ethnic minority communities highlighted both the overt and systemic racism that is still prevalent in society. The UK Research and Innovation COVID funding controversy, and an increased focus on the challenges faced by the LGBTQ+ researchers emphasised the inequalities and poor representation specifically experienced in academia. Scientists working at the forefront of the pandemic response faced the challenge of providing clear information to enable people and policy makers to take life-disrupting actions before they are directly impacted; a challenge familiar to climate and environmental scientists. These issues gave us our topics for the external sessions which focused on wellbeing, inclusivity and diversity in academia, and communicating research.
Barring technical difficulties, oral presentations are easy to replicate online, however, virtual conferences held earlier this year often had issues with recreating the poster sessions. Attempting to learn from these snags, instead of replicating an in-person poster session and possibly producing a poor-quality knock-off, participants were asked to create an animated “Twitter poster”. These were required to describe the key points of their research in a simple format that could be shared on social media and that was accessible to a non-expert. The posters were available for comments and questions throughout the two days in one easy-to-find location. Many of the participants shared their posters on Twitter after the conference using the conference hashtag #JointDTPCon.
Another issue we faced was how to run a social and networking event. We kept the social event simple. A quiz. A pandemic classic with a fantastic double act as hosts. Randomly assigned teams meant that new connections could be made. However, the quiz was held online and after a full day of video calls most people didn’t want to spend their evenings also starring at a screen.
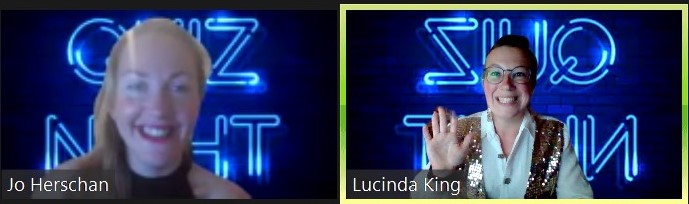
Fig 2 – Jo Herschan and Lucinda King, members of the SCENARIO DTP and on the conference organising committee, hosted an entertaining quiz on the first night of the conference. An ethical objects photo round linked the quiz to the conference’s main theme.
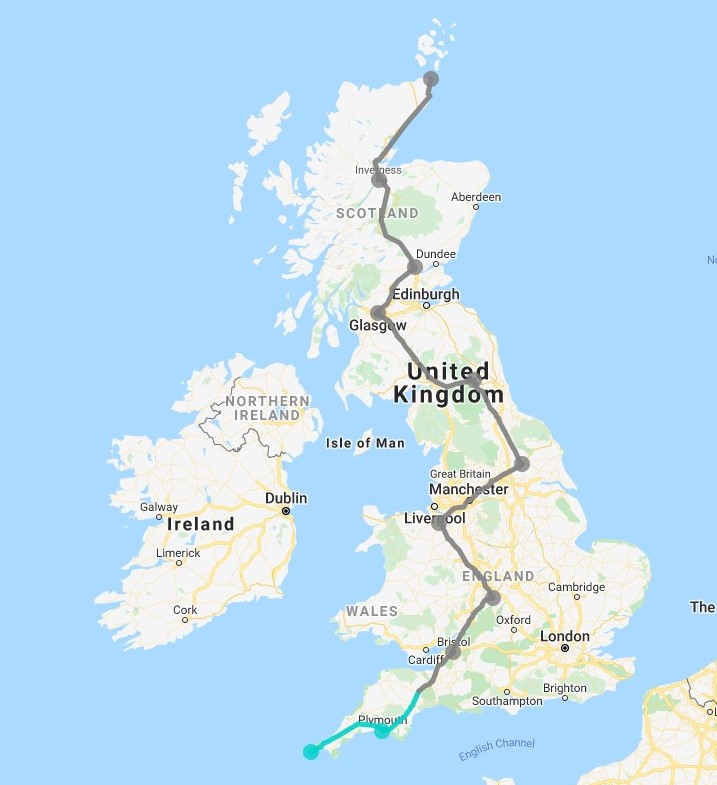
With everyone having stayed at home and everything being conducted virtually for a few months by the time of our conference, Zoom fatigue was an issue we were aware could occur and tried to counter as much as possible during the day without losing any of the exciting new research being presented. In the weeks running up to the conference we had several discussions about how to encourage people to move throughout the two days without missing any of the sessions they wanted to attend. We decided on two ideas: a yoga session and a walking challenge. The yoga session was a success and not only gave participants an opportunity to stretch in the middle of the day but also linked strongly to our theme of researcher wellbeing. The walking challenge was not as successful. The aim was that collectively the conference participants would walk the distance from Land’s End to John O’Groats. We did not make it that far; but we did make it out of Cornwall.
Fig 3 – Using World Walking to track the distance, we intended to collectively walk the 1576km (or 2,299,172 steps) from Land’s End to John O’Groats. This may have been an optimistic endeavour as we only achieved 235km (343, 311 steps).
Helping to organise a virtual conference as part of an enthusiastic committee was a lot of fun and attending the conference and learning about the research being undertaken (from fungi in Kew Gardens to tigers in North Korea) was even more fun. There is still enormous room for improvement in virtual conferences, but since they aren’t as well established as traditional in-person conferences there’s also a lot of flexibility for each conference to be designed differently. Once we’re through the pandemic and in-person conferences return it’d be nice for some of these benefits to be maintained as hybrid conferences are designed.
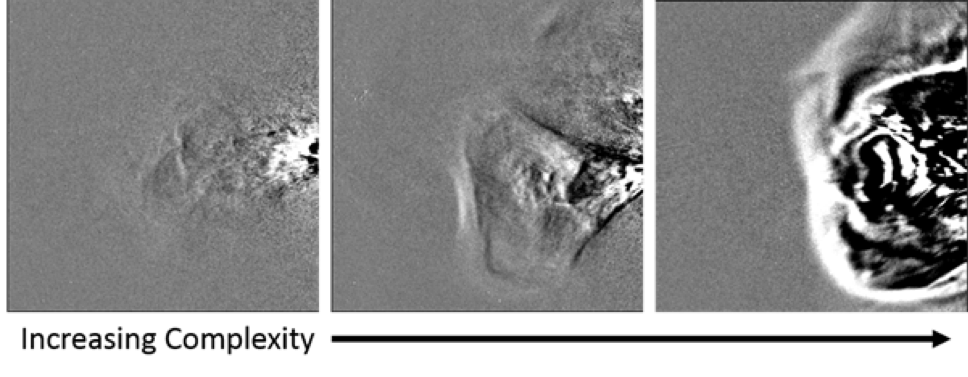
Coronal Mass Ejections (CMEs), or solar storms, are huge eruptions of particles and magnetic field from the Sun. With the help of 4,028 citizen scientists, my supervisors and I have just published a paper, showing that the appearance of CMEs changes over the solar cycle, with CMEs appearing more visually complex towards solar maximum.
Figure 1. Example images showing three example CMEs in ranked order of subjective complexity increasing from low (left-hand image) through to high (right-hand image).
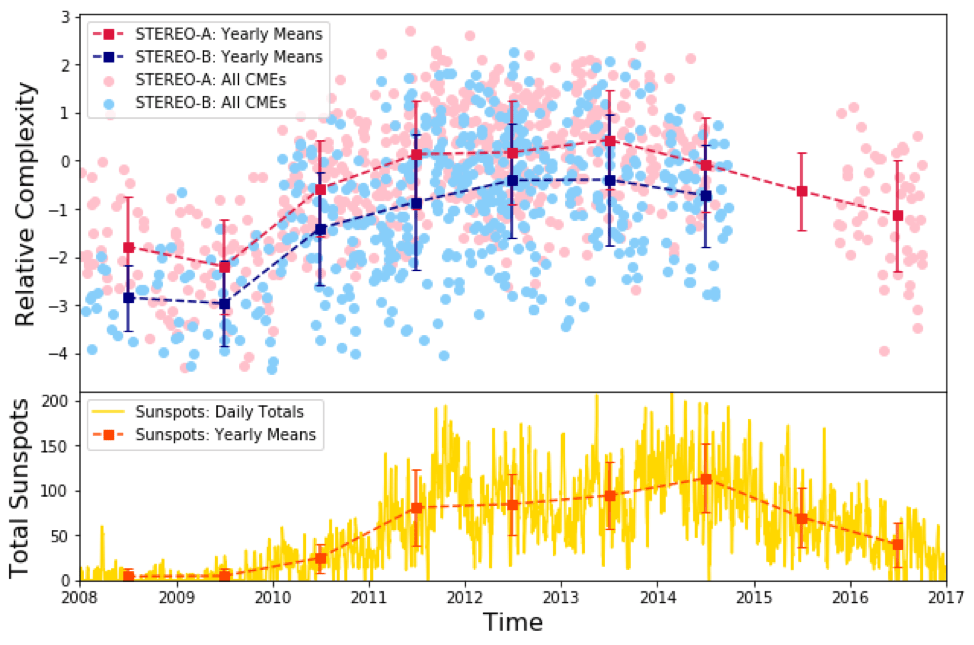
Figure 2 shows the relative complexity of all 1,110 CMEs, with CMEs observed by STEREO-A shown by pink dots, and CMEs observed by STEREO-B shown by blue dots. The lower panel shows the daily sunspot number over the same time period, using data from SILSO World Data Center. This shows that the annual average complexity values follow the solar cycle, and that the average complexity of CMEs observed by STEREO-B is consistently lower that the complexity of CMEs observed by STEREO-A. This might be due to slight differences between the imagers: STEREO-B is affected by pointing errors, which might blur smaller-scale features within the images.
Figure 2. Top panel: relative complexity of every CME in the ranking plotted against time. Pink points represent STEREO-A images, while blue points represent STEREO-B images. Annual means and standard deviations are over plotted for STEREO-A (red dashed line) and STEREO-B (blue dashed line) CMEs. Bottom panel: Daily total sunspot number from SILSO shown in yellow, with annual means over plotted (orange dashed line).
If a huge CME were to hit Earth, there could be serious consequences such as long-term power cuts and satellite damage. Many of these impacts could be reduced if we had adequate warning that a CME was going to hit. Our results suggest that there is some predictability in the structure of CMEs, which may help to improve future space weather forecasts.
We plan to continue our research and quantitatively determine which CME characteristics are associated with visual complexity. We also intend to investigate what is causing the CMEs to appear differently. Possible causes include: the complexity of the magnetic field at the CME source region on the Sun; the structure of the solar wind the CME passes through; or multiple CMEs merging, causing a CME to look more complex.
Please see the paper for more details, or email me at s.jones2@pgr.reading.ac.uk if you have any questions!
Jones, S. R., C. J. Scott, L. A. Barnard, R. Highfield, C. J. Lintott and E. Baeten (2020): The visual complexity of coronal mass ejections follows the solar cycle. Space Weather, https://doi.org/10.1029/2020SW002556.