R. Emerton, H. Cloke, E. Stephens, E. Zsoter, S. Woolnough, F. Pappenberger (2017). Complex picture for likelihood of ENSO-driven flood hazard. Nature Communications. doi: 10.1038/NCOMMS14796
Email: r.e.emerton@pgr.reading.ac.uk
When an El Niño is declared, or even forecast, we think back to memorable past El Niños (such as 1997/98), and begin to ask whether we will see the same impacts. Will California receive a lot of rainfall? Will we see droughts in tropical Asia and Australia? Will Peru experience the same devastating floods as in 1997/98, and 1982/83?

El Niño and La Niña, which see changes in the ocean temperatures in the tropical Pacific, are well known to affect weather, and indeed river flow and flooding, around the globe. But how well can we estimate the potential impacts of El Niño and La Niña, and how likely flooding is to occur?
This question is what some of us in the Water@Reading research group at the University of Reading have been looking to answer in our recent publication in Nature Communications. As part of our multi- and inter-disciplinary research, we work closely with the Red Cross / Red Crescent Climate Centre (RCCC), who are working on an initiative called Forecast-based Financing (FbF, Coughlan de Perez et al.). FbF aims to distribute aid (for example providing water purification tablets to prevent spread of disease, or digging trenches to divert flood water) ahead of a flood, based on forecasts. This approach helps to reduce the impact of the flood in the first place, rather than working to undo the damage once the flood has already occurred.


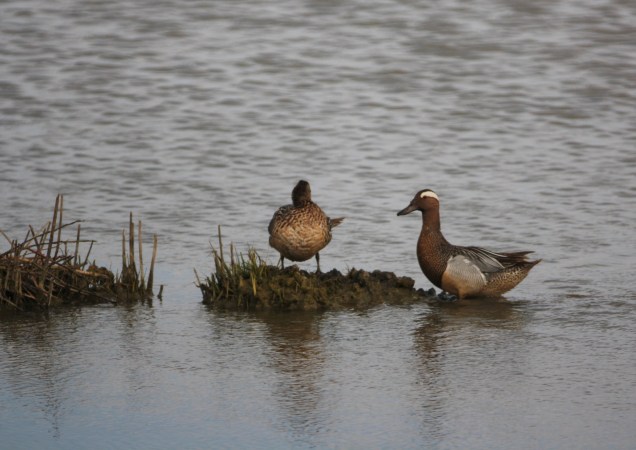
Photo credit: Red Cross / Red Crescent Climate Centre
In Peru, previous strong El Niños in 1982/83 and 1997/98 had resulted in devastating floods in several regions. As such, when forecasts in early 2015 began to indicate a very strong El Niño was developing, the RCCC and forecasters at the Peruvian national hydrological and meteorology agency (SENAMHI) began to look into the likelihood of flooding, and what FbF actions might need to be taken.
Typically, statistical products indicating the historical probability (likelihood [%] based on what happened during past El Niños) of extreme precipitation are used as a proxy for whether a region will experience flooding during an El Niño (or La Niña), such as these maps produced by the IRI (International Research Institute for Climate and Society). You may also have seen maps which circle regions of the globe that will be drier / warmer / wetter / cooler – we’ll come back to these shortly.
These rainfall maps show that Peru, alongside several other regions of the world, is likely to see more rainfall than usual during an El Niño. But does this necessarily mean there will be floods? And what products are out there indicating the effect of El Niño on rivers across the globe?
For organisations working at the global scale, such as the RCCC and other humanitarian aid agencies, global overviews of potential impacts are key in taking decisions on where to focus resources during an El Niño or La Niña. While these maps are useful for looking at the likely changes in precipitation, it has been shown that the link between precipitation and flood magnitude is nonlinear (Stephens et al.), – more rain does not necessarily equal floods – so how does this transfer to the potential for flooding?
The motivation behind this work was to provide similar information, but taking into account the hydrology as well as the meteorology. We wanted to answer the question “what is the probability of flooding during El Niño?” not only for Peru, but for the global river network.
To do this, we have taken the new ECMWF ERA-20CM ensemble model reconstruction of the atmosphere, and run this through a hydrological model to produce the first 20th century global hydrological reconstruction of river flow. Using this new dataset, we have for the first time estimated the historical probability of increased or decreased flood hazard (defined as abnormally high or low river flow) during an El Niño (or La Niña), for the global river network.

The question – “what is the probability of flooding during El Niño?”, however, remains difficult to answer. We now have maps of the probability of abnormally high or low river flow (see Figure 1), and we see clear differences between the hydrological analysis and precipitation. It is also evident that the probabilities themselves are often lower, and much more uncertain, than might be useful – how do you make a decision on whether to provide aid to an area worried about flooding, when the probability of that flooding is 50%?

The likely impacts are much more complex than is often perceived and reported – going back to the afore-mentioned maps that circle regions of the globe and what their impact will be (warmer, drier, wetter?) – these maps portray these impacts as a certainty, not a probability, with the same impacts occurring across huge areas. For example, in Figure 2, we take one of the maps from our results, which indicates the probability of increased or decreased flood hazard in one month during an El Niño, and draw over this these oft-seen circles of potential impacts. In doing this, we remove all information on how likely (or unlikely) the impacts are, smaller scale changes within these circles (in some cases our flood hazard map even indicates a different impact), and a lot of the potential impacts outside of these circles – not to mention the likely impacts can change dramatically from one month to the next. For those organisations that take actions based on such information, it is important to be aware of the uncertainties surrounding the likely impacts of El Niño and La Niña.
“We conclude that while it may seem possible to use historical probabilities to evaluate regions across the globe that are more likely to be at risk of flooding during an El Niño / La Niña, and indeed circle large areas of the globe under one banner of wetter or drier, the reality is much more complex.”
PS. During the winter of 2015/16, our results estimated an ~80% likelihood of increased flood hazard in northern coastal Peru, with only ~10% uncertainty surrounding this. The RCCC took FbF actions to protect thousands of families from potentially devastating floods driven by one of the strongest El Niños on records. While flooding did occur, this was not as severe as expected based on the strength of the El Niño. More recently, during the past few months (January – March 2017), anomalously high sea surface temperatures (SSTs) in the far eastern Pacific (known as a “coastal El Niño” in Peru but not widely acknowledged as an El Niño because central Pacific SSTs are not anomalously warm) have led to devastating flooding in several regions and significant loss of life. And Peru wasn’t the only place that didn’t see the impacts it expected in 2015/16; other regions of the world, such as the US, also saw more rainfall than normal in places that were expected to be drier, and California didn’t receive the deluge they were perhaps hoping for. It’s important to remember that no two El Niños are the same, and El Niño will not be the only influence on the weather around the globe. While El Niño and La Niña can provide some added predictability to the atmosphere, the impacts are far from certain.

Full reference:
R. Emerton, H. Cloke, E. Stephens, E. Zsoter, S. Woolnough, F. Pappenberger (2017). Complex picture for likelihood of ENSO-driven flood hazard. Nature Communications. doi: 10.1038/NCOMMS14796
Press Release:
Improved El Niño flood hazard warnings could save lives


 and assume that the wind speed and direction are always the same everywhere. We’ll label the temperature
  , label time
  , and label the south-to-north direction
  , then we can write down the advection equation using
 ), depending on the north-south temperature contrast (
 ) multiplied by the wind speed


 , will vary over time. We can calculate this by reconstructing a continuous temperature field and using this to approximate temperature values at the north and south faces of the cell,
  and
and  ,
,
 is the distance between the north and south cell faces. This is the same reconstruction process that we described earlier, only, instead of approximating temperatures using nearby weather station measurements, we are approximating temperatures using nearby cell centre values.


